

Abstract
Background:
Bone density measurement in a radiographic view is a valuable method for evaluating the density of bone quality before performing some dental procedures such as, dental implant placements. It seems that Cone-Beam Computed Tomography (CBCT) can be used as a diagnostic tool for evaluating the density of the bone, prior to any treatment, as the reported radiation dose in this method is minimal. The aim of this study is to investigate the effect of object location on the density measurement in CBCT versus Multislice computed tomography (CT).
Materials and Methods:
In an experimental study, three samples with similar dimensions, but different compositions, different densities (Polyethylene, Polyamide, Polyvinyl Chloride), and three bone pieces of different parts of the mandibular bone were imaged in three different positions by CBCT and Multislice CT sets. The average density value was computed for each sample in each position. Then the data obtained from each CBCT was converted to a Hounsfield unit and evaluated using a single variable T analysis. A P value <0.05 was considered to be significant.
Results:
The density in a Multislice CT is stable in the form of a Hounsfield Number, but this density is variable in the images acquired through CBCT, and the change in the position results in significant changes in the density. In this study, a statistically significant difference (P value = 0.000) has been observed for the position of the sample and its density in CBCT in comparison to Multislice CT.
Conclusions:
Density values in CBCT are not real because they are affected by the position of the object in the machine.
Keywords: Bone density, cone-beam computed tomography, implant
INTRODUCTION
Advances in three-dimensional imaging resulted in a better understanding of the craniofacial structures.[1] One of the modern techniques, Cone Beam Computed Tomography (CBCT), which was invented for angiography in 1982, was then used for maxillofacial imaging.[2] In contrast to the common cephalometric radiographies, CBCT produced images with the actual anatomic size. The reconstructed three-dimensional images showed the cranium in all angles and views and provided helpful information on the teeth and other structures for diagnostic and descriptive purposes.[3] CBCT has many advantages over conventional CT, including a lower radiation dose, better image quality (less than a millimeter resolution), lower price, less physical space, and a better capability of restoration.[4]
Regarding the bone structures, the effect on the type of the bone is recognized on its tolerance to the imposed forces, and it is stated that the low quality of the bone is related to higher complication after dental treatments.[5,6,7] Fanuscu and Chang state that the bone mass, structure, and characteristics are effective factors in bone quality.[8] Therefore, it is necessary for the clinician to have appropriate knowledge of the bone quality, prior to any treatment. For instance, this knowledge may be helpful before the implantation procedure.[9,10] CT is one of the medical imaging methods that is useful for acquiring information from the structure, as also the density of the tissue. Accordingly, based on the Hounsfield Unit, the density of the bone is in direct relationship with the radiation attenuation coefficient of the tissue.[11,12]
Due to its higher radiation dose, CT is not applicable for evaluating the density of the alveolar bone; for instance, in orthodontic treatments, the patient may need several CT images in several months.[12] Application of CBCT in dentistry is rapidly growing and it seems that evaluating the quality and quantity of the bones by using the information acquired from CBCT will be practical.[3]
Although studies have been done on the accuracy of CBCT in comparison with intraoral radiography, panoramic tomography, and conventional CT, yet few studies have dealt with the precision of computation of bone density and the effect of the position of the object, that is, the position of the patient in different CBCT Units, on the acquired density.
In 2011, Nackaert, et al. evaluated the variety of densities in CBCT images in comparison to Multislice CT, based on the Hounsfield number. The results indicated that evaluation of the density in Multislice CT images showed a stable Hounsfield number, but the quantity of density was variable in the CBCT images.[11]
In 2011, Chang, et al. evaluated the density changes on all sides of the tooth during orthodontia, by use of CBCT. The findings indicated that CBCT is a suitable method of evaluating the density changes of the bone in the teeth under orthodontic treatment.[12] In 2009, Nomura, et al. investigated the validity of CBCT-Voxel values in evaluating the Bone Mineral Density (BMD). The findings of that study indicated that there was a strong relationship between the CBCT-Voxel values and the Hounsfield Number in the Multislice CT.[13]
In 2008, Lagravere, et al. investigated the effect of the object position on density, in CBCT (New Tom 3G), based on the Hounsfield number. The results demonstrated that there was no statistically meaningful relationship between the object position in CBCT and the effect on the measured density.[9]
Therefore, considering the limitations of the present study and availability of different types of CBCT Units, we decided to investigate the precision of computation and the effect of object location on the density value in three systems of CBCT (Proma × 3D, Galileos 3D, and New Tom 3G) in comparison to the Multislice CT, as the gold standard.
MATERIALS AND METHODS
In an experimental study done in the Torabinejad Dental Research Center and Department of Oral and Maxillofacial Radiology, School of Dentistry, Esfahan University of Medical Science, Esfahan, Iran, three cylindrical samples with different densities, including Polyethylene (PE) (ρ 914/0 = g cm-3), Polyamide (PA) (ρ115/1 = g cm-3), and Polyvinyl Chloride (PVC) (ρ433/1 = g cm-3) were made with 20 mm height and 7.47 diameter. In addition, three bone pieces harvested from a cadaver, including the anterior mandibular bone from the central teeth position, posterior mandibular bone from the premolar teeth position, and posterior mandibular bone from the molar teeth position all with 10 mm width, were examined. For each sample, a thin plastic rectangular-shaped cylinder, 10 cm in length, 8 cm in width, and 4.5 cm in depth, filled with water was prepared and located in another thin plastic rectangular-shaped cylinder, 12 cm in length, 9.5 cm in width, and 7 cm in depth, filled with oil, to simulate the X radiation absorption of the soft tissues.[9] In order to determine the position of the samples, two perpendicular lines were drawn on the floor of the smaller cylinder in such a way that their conjunction was on the center of the cylinder. Next, the position of the samples was determined based on these two lines. Position 1: On the transversal line, 2 cm anterior to the center of the interior box. Position 2: On the right side of the box, 1 cm posterior to the center of the longitudinal line on the right side. Position 3: On the left side, 1 cm anterior to the center of the longitudinal line on the left side of the box [Figure 1].
Figure 1.
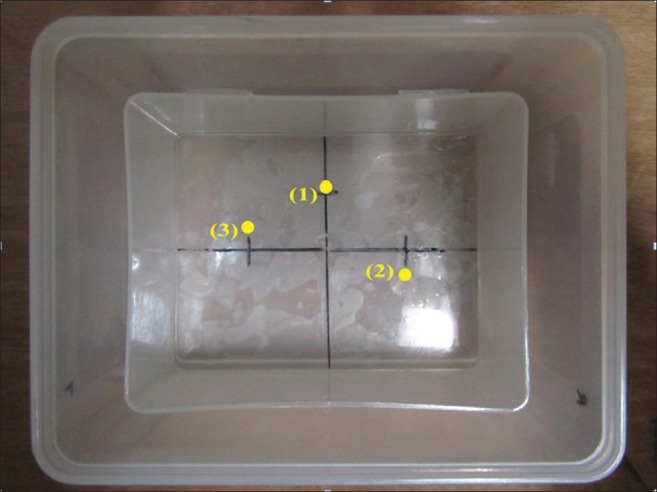
A view of the prepared box and positions of material on its floor
Each of the sample objects was located in all positions in each of the Units and they were exposed to radiation: Galileos 3D (Germany, kvp = 85, mAs = 28). NewTom 3G (Italy, kvp = 110, mAs = 1.25), Proma × 3D (Finland, kvp = 84, mAs = 16), and Multislice CT (Germany, 16 slice, kvp = 85, mAs = 100).
Subsequently, three cross-sectional slices were prepared of each sample (with 1 mm width and 1 mm distance). Five millimeters of the top and 5 mm of the bottom of each sample were ignored in computations and only 10 mm of the central part of each sample was considered for computations of density. Two lines were drawn on the image acquired from each cross-sectional slice, to divide it into four equal parts. The conjunction of the two lines was the center of the slice. The density of each of the four parts and the central point was computed. For each slice five values and for each sample 15 values were computed [Figure 2]. For bone samples, five cross-sectional slices were prepared (with 1 mm width and 1 mm distance). The central point was determined on the buccal cortex and 2 mm above it, as the points of computing the density, in such a way that for each slice two values and for each sample 10 values were computed.
Figure 2.
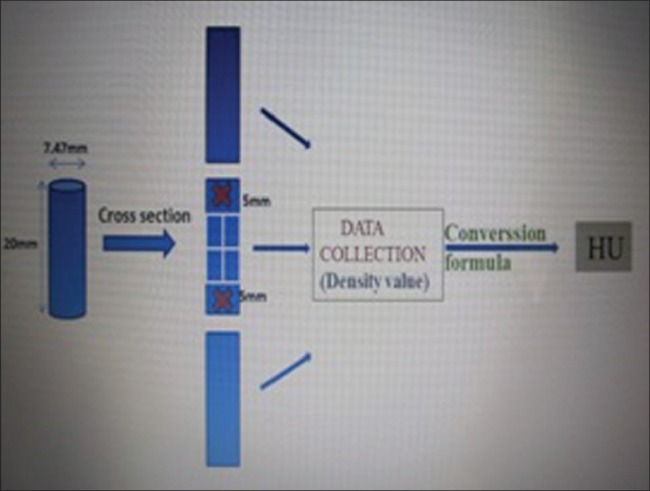
The computed method for evaluation of density in each cross-sectional slice
This process was performed for each sample in all three CBCT Units, Multislice CT Unit, and all the positions. The values acquired were recorded [Figure 3].
Figure 3.
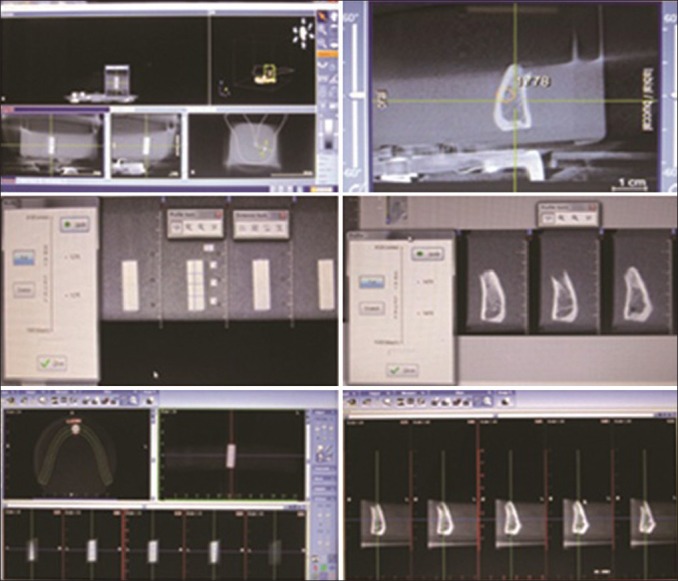
(a) CBCT images of cylindrical samples and bone pieces in Galileos 3D (b) NewTom 3G (c) Promax 3D
Then the density values acquired from all samples were converted into Hounsfield numbers by use of the regression equation of each Unit, for statistical purposes, and then a single variable T analysis was performed in the SPSS (9.01 version). The regression Equation of each unit was:
Galileos 3DY (Hounsfield Unit) = −2152.9 + 1.694 (Density)
Proma × 3DY (Hounsfield Unit) =358.99 + 1.236 (Density)
NewTom 3GY (Hounsfield Unit) = −146.97 + 1.316 (Density)
To compute the regression equation related to each unit, the average of the density values of the Polyviny l chloride (PVC) in position 1 of the central slice was compared with the Hounsfield number computed in the same position and the same slice in the CT unit. The regression equation was computed for converting the density values in each unit to a Hounsfield number.
RESULTS
In our study, the densities obtained for each of the materials and bone pieces in each position and for each unit were entered onto the check list, to be compared with the Multislice CT. Then the obtained results were compared with the Gold Standard through a single variable t test.
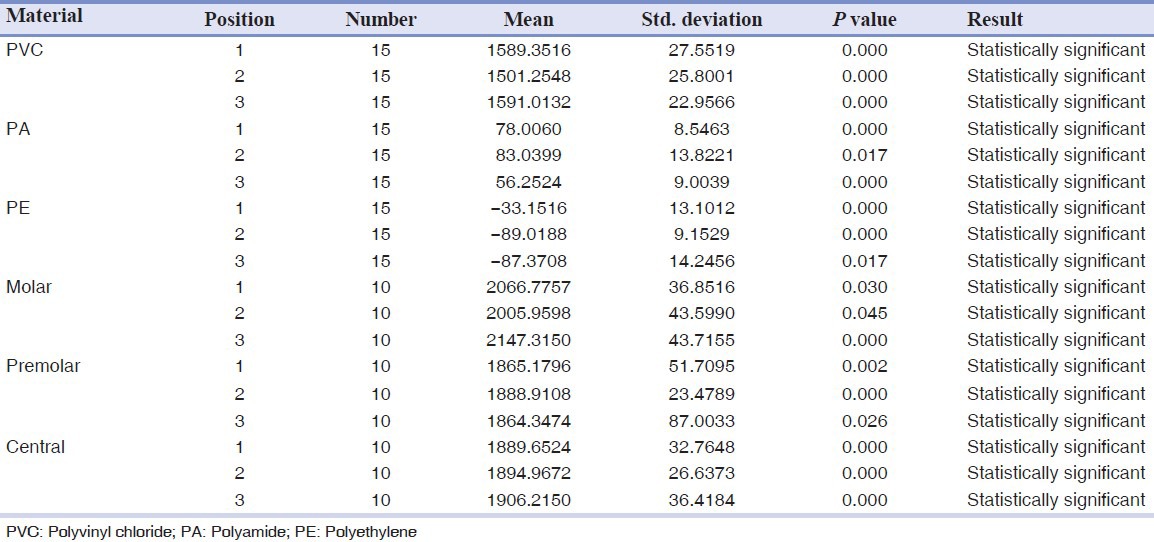
In Table 1, the average density of each sample, with its position changes in the Galileos 3D Unit is presented.
Table 1.
The average density of each sample with its position in galileos 3D
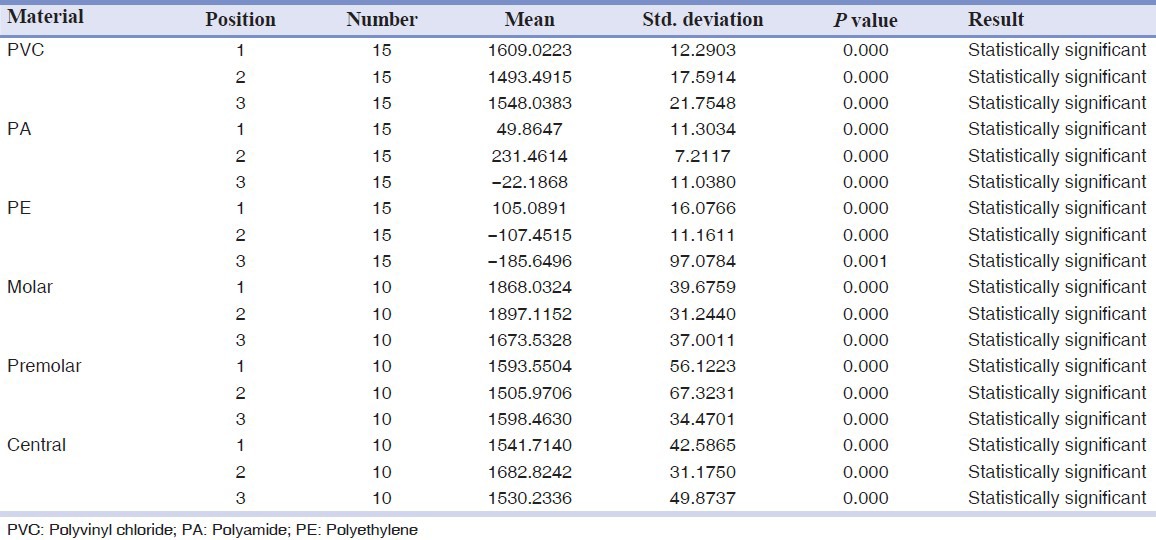
In all cases, a P value of <0.05 was considered significant. Therefore, in all cases, the average density showed a statistically meaningful difference in the reference value, and a change in position affected the density value.
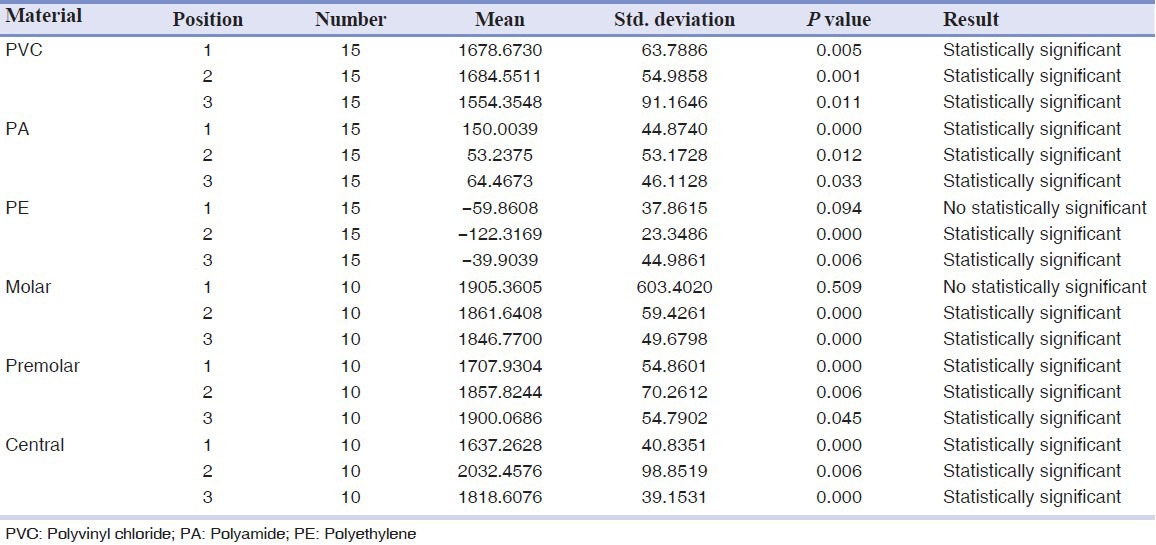
The results of the effect of the change in position on the density in Proma × 3D are demonstrated in Table 2.
Table 2.
The average density of each sample with its position in Promax 3D
The results indicate statistically meaningful differences of the test in all cases in a way that the resulting average density changes are evident with the changes in position.
The results obtained from NewTom 3G are presented in Table 3. In all cases (except for PE in position 1 and the Molar sample in position 1) the average density has a statistically meaningful difference in the reference value and the P value < 0.05, and the change in position affects the quantity of density.
Table 3.
The average density of each sample with its position in NewTom 3G
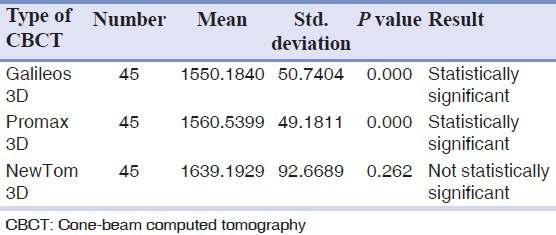
The findings of the surveys revealed that in Galileos 3D and Proma × 3D Units, the density had a statistically significant difference from the reference value, therefore, these two units were not reliable for determining the density.
On the other hand, in NewTom 3G, the P value is higher than 0.05, and therefore, it is not significant. Consequently, the average density in this unit does not have a statistically meaningful difference in the reference value and this unit is reliable for determining the density [Table 4].
Table 4.
The average density in every type of cone beam computed tomography
DISCUSSION
The clinical success of dental implants is affected by the quality and quantity of the bone. The quality and quantity are affected by different locations and from patient to patient.[14]
A true understanding of the quality of the bone is very helpful before implantation. It can help the clinician to predict the result of the treatments and provide the patient with very good treatment.[9,10] There are classified systems of evaluating the bone. Lekholm and Zarb classified the bone density in terms of radiography into four types, based on the density of the cortical bone in contrast to the trabecular bone.[15] Mish considers that the density of the bone is related to clinical stiffness of the bone, which is visible in drilling the bone before implantation.[16] In a new method, Johansson and Strid have introduced Cutting Resistance before implantation as a method of evaluating the bone.[17] On the other hand, in evaluating the density of the bone, it is possible to apply densitometry,[18] bone biopsy,[19,20] and ultrasound.[21] Although these techniques demonstrate the reliable quality of the bone, they are not practical methods for surgeons and clinicians, in terms of clinical considerations.[9,10]
There is the possibility of evaluating the density of the bone in CT and this quantity is shown with the HU number, which is reliable and can be used as the Gold Standard for determining density, but regarding the high radiation dose in CT, finding an appropriate substitute for it can be highly helpful.[11]
Regarding the increasing application of CBCT in dentistry, evaluating the quality of the bone may be practically possible. In each CBCT Unit, computing density is possible, but the reliability of the obtained values and the effect of the change in the position of the patient, or in fact, the position of the area to be observed in the unit, on the quantity of density have been always questioned. For instance, Zou H considers that CBCT is a helpful tool for evaluating density,[22] but Hua Y maintains that CBCT is not reliable for this purpose.[23]
In the present study the effect of the position of the object on the density value was investigated in CBCT in comparison to Multislice CT. The findings indicated that in contrast to the values obtained from Multislice CT, only the values obtained from the NewTom 3G unit did not have statistically meaningful differences, and therefore, it was reliable. On the other hand changing position affected the density value in all three units in comparison to the Multislice CT, which was in accordance with the findings of Nackaert, et al., who investigated the effect of changing position on the density value in five CBCT units. This demonstrated the stability of the Hounsfield Number in the Multislice CT and the change of density value due to the change of position in all CBCTs.[11] In addition, the findings of the present study were in contrast to that of the study of Lagravere MO, in 2008, on the NewTom 3G unit.[9] In that study, no finding demonstrated a meaningful relationship between the position of the object in CBCT and its density value. In that study two software systems were used in order to determine the linear relationship between the density and the Hounsfield Number, but in the present study, the Regression Equation acquired from the previous studies and the present study was applied for converting the density values obtained from each unit, because it was not possible to access such software systems, to download them from the Internet.
In justifying the effect of the object position on density, we can refer on the one hand to the Cone Beam Effect of the radiation in CBCT, which resulted in more noise, artifact, and distortion of the environment, and on the other hand to a high quantity of scatter rays and difference in homogeneity of the X-ray (Quantum mottle), which resulted in lack of uniformity in the radiated ray as well as the absorbed ray. In the study conducted by Chang, et al., the density change on all sides of the teeth, during orthodontia, was evaluated using CBCT and the findings confirmed that CBCT was reliable and useful for evaluating such changes.[12] In this study, although CBCT was able to show the changes of density in a given position, the reliability of the acquired values in comparison to the Gold Standard values was not studied and only the density values in a given position were evaluated during the time.
In the present study, the change in position had a significant effect on the density value and it seemed that in order to evaluate the density of a given area it was necessary to provide a repeatable position to eliminate the effect of the position on the density value. For all three types of CBCT Units, the findings indicated that regardless of the change in position in evaluating the density values, only the NewTom 3G type of CBCT Units were reliable. However, even in this type of unit, the change in position affected the density values. The results of the present study demonstrated that regardless of the method of study and data collection, a correct relationship between the values obtained from the CBCT Units and the Hounsfield Numbers obtained from the Multislice CT was of great importance. The obtained Regression Equations played a significant role in this regard. Naitoh, in his study, also mentioned this fact and stated that the CBCT values were not absolute, and using the Regression Line was useful in estimating the mineral density of the bone.[24] In addition, in Nomura Y's study, in 2009, the relationship between the voxel values of CBCT and CT numbers was nonlinear and the suggestions of the researcher for more future studies to determine the appropriate relationship, confirmed this fact.[13]
CONCLUSION
Evaluating the quality and quantity of bone has been done visually so far, through clinical diagnoses and radiographic images, in order to evaluate the bone trabecula and the space of the marrow. However, the present study demonstrates that although the change in position affects the density value, in the case of providing a repeatable position, it is possible to evaluate the quantity and quality of the bone in comparison to other areas of the mandible in the same patient and to determine the point with a higher density, to place the implant. In other words, in addition to radiographic diagnosis and evaluation, besides its high ability in linear evaluations, CBCT can show the clinician the points with higher density and the values that are exclusive to each unit, and are comparable to Multislice CT, in cases like the NewTom 3G type of CBCT.
ACKNOWLEDGMENT
This article was prepared based on a thesis and a research project approved by the Medical Ethics and Research Office at the Isfahan University of Medical Sciences and Hamedan University of Medical Science, Hamedan, Iran.
Footnotes
Source of Support: Nil
Conflict of Interest: None declared
REFERENCES
- 1.Song J, Zhao Z, Hu L. The influences upon the passive tensile of the masticatory muscles and ligaments by Herbst appliance under various bite reconstruction–a three dimensional finite element analysis. Hua Xi Kou Qiang Yi Xue Za Zhi. 2001;19:43–5. [PubMed] [Google Scholar]
- 2.Ito K, Yoshinuma N, Goke E. Clinical application of a New compact computed tomography system for evaluating the outcome of regenerative therapy: A case reports. J Periodontal. 2001;72:696–702. doi: 10.1902/jop.2001.72.5.696. [DOI] [PubMed] [Google Scholar]
- 3.Lagravère MO, Fang Y, Carey J. Density conversion factor determined using a cone-beam computed tomography unit NewTom QR-DVT 9000. Dentomaxillofac Radiol. 2006;35:407–9. doi: 10.1259/dmfr/55276404. [DOI] [PubMed] [Google Scholar]
- 4.Scarfe WC, Farman AG. Cone-beam Computed tomography in Oral radiology principles and interpretation. In: White SC, Pharoh MJ, editors. 6th ed. St Louis: Mosby; 2009. pp. 226–42. [Google Scholar]
- 5.Stavropoulos A, Wenzel A. Accuracy of cone beam dental CT, intraoral digital and conventional film radiography for detection of periapical lesions. An ex vivo study in pig jaws. Clin Oral Investig. 2007;11:101–6. doi: 10.1007/s00784-006-0078-8. [DOI] [PubMed] [Google Scholar]
- 6.van der Zel JM. Implant planing and placemant using optical scaning and cone beam CT technology. J Prosthodont. 2008;17:476–81. doi: 10.1111/j.1532-849X.2008.00322.x. [DOI] [PubMed] [Google Scholar]
- 7.Frederiksen NL, Benson BW, Sokolowski TW. Effective dose and risk assessment from computed tomography of the maxillofacial complex. Dentomaxillofac Radiol. 1995;24:55–8. doi: 10.1259/dmfr.24.1.8593910. [DOI] [PubMed] [Google Scholar]
- 8.Fanuscu MI, Chang TL. Three-dimensional morphometric analysis of human cadaver bone: Microstructural data from maxilla and mandible. Clin Oral Implants Res. 2004;15:213–8. doi: 10.1111/j.1600-0501.2004.00969.x. [DOI] [PubMed] [Google Scholar]
- 9.Lagravère MO, Carey J, Ben-Zvi M, Packota GV, Major PW. Effect of object location on the density measurement and Hounsfield conversion in a NewTom 3G cone beam computed tomography unit. Dentomaxillofac Radiol. 2008;37:305–8. doi: 10.1259/dmfr/65993482. [DOI] [PubMed] [Google Scholar]
- 10.ZamaniNaser A, Etemadi SH, Rismanchian M. Comparison of conventional and standardized bone densitometry around implants in periapical radiographs during a three months period. Dent Res J (Isfahan) 2011;8:33–8. [PMC free article] [PubMed] [Google Scholar]
- 11.Nackaerts O, Maes F, Yan H, Couto Souza P, Pauwels R, Jacobs R. Analysis of intensity variability in multislice and cone beam computed tomography. Clin Oral Implants Res. 2011;22:873–9. doi: 10.1111/j.1600-0501.2010.02076.x. [DOI] [PubMed] [Google Scholar]
- 12.Chang HW, Huang HL. Effects of orthodontic tooth movement on alveolar bone density. Clin Oral Investig. 2011;26:552–9. doi: 10.1007/s00784-011-0552-9. [DOI] [PubMed] [Google Scholar]
- 13.Nomura Y, Watanabe H. Reliability of voxel values from cone-beam computed tomography for dental use in evaluating bone mineral density. Clin Oral Implants Res. 2010;21:558–62. doi: 10.1111/j.1600-0501.2009.01896.x. [DOI] [PubMed] [Google Scholar]
- 14.Aranyarachkul P, Caruso J, Gantes B, Schulz E, Riggs M, Dus I, et al. Bone density assessments of dental implant sites: 2. Quantitative cone-beam computerized tomography. Int J Oral Maxillofac Implants. 2005;20:416–24. [PubMed] [Google Scholar]
- 15.Lekholm U, Zarb GA. Patient selection and preparation. In: Branemark PI, Zarb GA, Albrektsson T, editors. Tissue-integrated prostheses: Osseointegration in clinical dentistry. Chicago: Quintessence; 1985. pp. 199–209. [Google Scholar]
- 16.Misch CE. Divisions of available bone in implant dentistry. Int J Oral Implantol. 1990;7:17–21. [PubMed] [Google Scholar]
- 17.Johansson P, Strid KG. Assessment of bone quality from cutting resistance during implant surgery. Int J Oral Maxillofac Implants. 1994;9:279–88. [Google Scholar]
- 18.Devlin H, Horner K, Ledgerton D. A comparison of maxillary and mandibular bone mineral densities. J Prosthet Dent. 1998;79:323–7. doi: 10.1016/s0022-3913(98)70245-8. [DOI] [PubMed] [Google Scholar]
- 19.Thomsen JS, Ebbesen EN, Mosekilde L. Relationships between static histomorphometry and bone strength measurements in human iliac crest bone biopsies. Bone. 1998;22:153–63. doi: 10.1016/s8756-3282(97)00235-4. [DOI] [PubMed] [Google Scholar]
- 20.Trisi P, Rao W. Bone classification: Clinical-histomorphometric comparison. Clin Oral Implants Res. 1999;10:1–7. doi: 10.1034/j.1600-0501.1999.100101.x. [DOI] [PubMed] [Google Scholar]
- 21.Hans D, Fuerst T, Uffmann M. Bone density and quality measurement using ultrasound. Curr Opin Rheumatol. 1996;8:370–5. doi: 10.1097/00002281-199607000-00016. [DOI] [PubMed] [Google Scholar]
- 22.Zou H, Lai RF, Kong WD, Lin W, Chen MY. Evaluation of the implant sites of palatal implants using cone beam computed tomography. Zhonghua Kou Qiang Yi Xue Za Zhi. 2009;44:404–8. [PubMed] [Google Scholar]
- 23.Hua Y, Nackaerts O, Duyck J, Maes F, Jacobs R. Bone quality assessment based on cone beam computed tomography imaging. Clin Oral Implants Res. 2009;20:767–71. doi: 10.1111/j.1600-0501.2008.01677.x. [DOI] [PubMed] [Google Scholar]
- 24.Naitoh M, Hirukawa A. Prospective study to estimate mandibular cancellous bone density using large-volume cone-beam computed tomography. Clin Oral Implants Res. 2010;21:1309–13. doi: 10.1111/j.1600-0501.2010.01950.x. [DOI] [PubMed] [Google Scholar]