

Abstract
Background
Because of the slow pharmacokinetics of subcutaneous (SC) insulin, avoiding postprandial hyperglycemia has been a major challenge for an artificial pancreas (AP) using SC insulin without a meal announcement.
Methods
A semiautomated AP with Technosphere® Insulin (TI; MannKind Corporation, Valencia, CA) was designed to combine pulmonary and SC insulin. Manual inhalation of 10 U ultrafast-absorbing TI at mealtime delivers the first, or cephalic, phase of insulin, and an SC insulin pump controlled by zone model predictive controller delivers second-phase and basal insulin. This AP design was evaluated on 100 in silico subjects from the University of Virginia/Padova metabolic simulator using a protocol of two 50 g carbohydrate (CHO) meals and two 15 g CHO snacks.
Results
Simulation analysis shows that the semiautomated AP with TI provides 32% and 16% more time in the controller target zone (80–140 mg/dl) during the 4 h postprandial period, with 39 and 20 mg/dl lower postprandial blood glucose peak on average than the pure feedback AP and the AP with manual feed-forward SC bolus, respectively. No severe hypoglycemia (<50 mg/dl) was observed in any cases.
Conclusions
The semiautomated AP with TI provides maximum time in the clinically accepted region when compared with pure feedback AP and AP with manual feed-forward SC bolus. Furthermore, the semiautomated AP with TI provides a flexible operation (optional TI inhalation) with minimal user interaction, where the controller design can be tailored to specific user needs and abilities to interact with the device.
Keywords: artificial pancreas, inhaled insulin, model predictive control, zone model predictive control
Introduction
Type 1 diabetes mellitus (T1DM) is a metabolic disorder in which pancreatic β cells are destroyed by autoimmune attack and cannot produce a sufficient amount of insulin to regulate blood glucose (BG) concentration. Without proper treatment, people with T1DM may develop neuropathy, nephropathy, retinopathy, and cardiovascular and cerebro-vascular diseases due to chronic hyperglycemia (BG > 180 mg/dl). Also, ketoacidosis caused by severe hyperglycemia may result in a coma or even death. Thus people with T1DM must receive insulin therapy to regulate their BG.1–4
Regulating BG within a clinically accepted region (70–180 mg/dl)5 with either multiple daily insulin injections or a continuous subcutaneous insulin infusion (CSII) pump is a burdensome task. This regimen requires multiple daily BG measurements and estimates of insulin dosages based on meal size, body weight, and other clinical factors. Furthermore, the insulin sensitivity of an individual changes over time. Thus the insulin dosage estimation procedure should be carefully adjusted continually. Otherwise, an overdelivery of insulin may cause hypoglycemia (BG < 70 mg/dl), which may result in seizure, coma, or death.1–4
The effort to develop an artificial pancreas (AP) started in the late 1970s with the Biostator®, which measured BG and delivered insulin and dextrose.6 However, because of its invasiveness and large size, the intravenous (IV) closed-loop system was not tested outside of a hospital setting. Increasing academic and industrial effort has focused on minimally invasive subcutaneous (SC) closed-loop glucose control using a continuous glucose monitor (CGM) and CSII. To date, several studies have reported clinical and in silico results for closed-loop glucose control using a SC CGM and CSII.7–28
Despite the current focus of treatment using the SC route, because of the slow pharmacokinetics and long residence time (pharmacokinetic peak time of 50–60 min and residence time of 6–8 h) of the SC insulin, an AP design using the SC route has a number of limitations (e.g., prolonged postprandial hyperglycemia or late postprandial hypoglycemia) when this design encounters meal challenges.29–31 Recently, pulmonary insulin delivery has received significant attention as a complementary route because of the large surface area of the alveolar region (~100 m2) and permeable membranes. Technosphere® Insulin (TI) is an inhalation powder (Figure 1A) designed for insulin delivery through the pulmonary route, is fast absorbing (pharmacokinetic peak time of 15 min), and has a short residence time (2–3 h). The optimal size range of TI particles for delivery into the alveoli of a lung is 2–3 µm, and the breath-powered DreamboatTM inhaler (Figure 1B) produces TI particles of this optimal size.29,31
Figure 1.
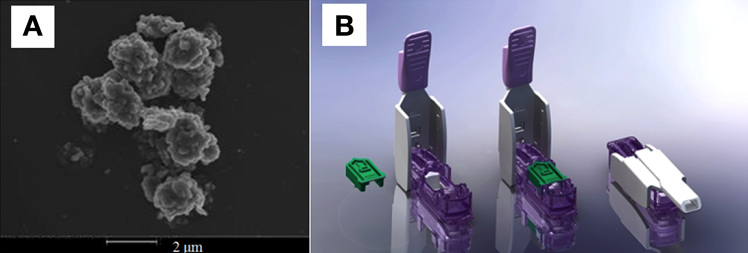
A scanning electron microscope image of a Technosphere particle and (B) the Dreamboat inhaler (courtesy of MannKind Corporation).
In this work, a novel semiautomated AP that uses TI to improve BG regulation at mealtime is presented. The semi-automated AP with TI combines two insulin delivery methods: ultra-rapid-acting TI and CSII controlled by zone model predictive control (zone- MPC).32 To evaluate the potential of the semiautomated AP with TI, an autoregressive with exogenous input (ARX) pharmacokinetic model of TI was developed to simulate TI delivery. The performance and robustness of the semiautomated AP with TI was evaluated on 100 in silico subjects from the U.S. Food and Drug Administration (FDA)-accepted University of Virginia/Padova metabolic simulator. The semiautomated AP with TI was compared with both a pure feedback AP and an AP with manual feed-forward SC bolus treatments.
Methods
Autoregressive with Exogenous Input Model and Least-Square Method
The ARX model assumes that the current value of the time variable (output) is a function of its past values and exogenous inputs as shown in Equation (1):
| (1) |
where y[k], ũ[k], a[i], b[j], W, V, i, and j are the system output signal, input signal, coefficients of input terms, coefficients of output terms, number of input signal terms, number of output signal terms, ith term of the input signal, and jth term of the output signal, respectively.33 The complexity of the ARX model presented in this work (W = 1 and V = 5) was determined based on several factors: the number of data points, the quality of data points, and the desired accuracy of the model. Then, using the fminunc() function in MATLAB (MathWorks, Natick, MA), the coefficients of the equation were determined by the least squares method:
| (2) |
where E(a[i], b[j]), [l], y[l], N, and l are the error of the model, the measured data points from an experiment, the predicted outputs by the ARX model, the number of data points, and the lth term of data points, respectively.33
Semiautomated Artificial Pancreas with Technosphere Insulin
Normal physiological insulin secretion at mealtime consists of two phases: the rapid rising cephalic first phase of insulin secretion and the prolonged second phase of insulin secretion.34 Thus, to reproduce the physiological insulin secretion pattern, an ideal AP needs to capture both phases. As depicted in Figure 2, the semiautomated AP with TI combines two insulin delivery methods (ultra-rapid-acting TI and CSII controlled by zone-MPC) to capture the two insulin secretion phases mentioned earlier.22,32,34 Figure 3 demonstrates the design of the semiautomated AP with TI (manual feed-forward TI action and feedback loop of CGM, CSII, and the control algorithm).
Figure 2.
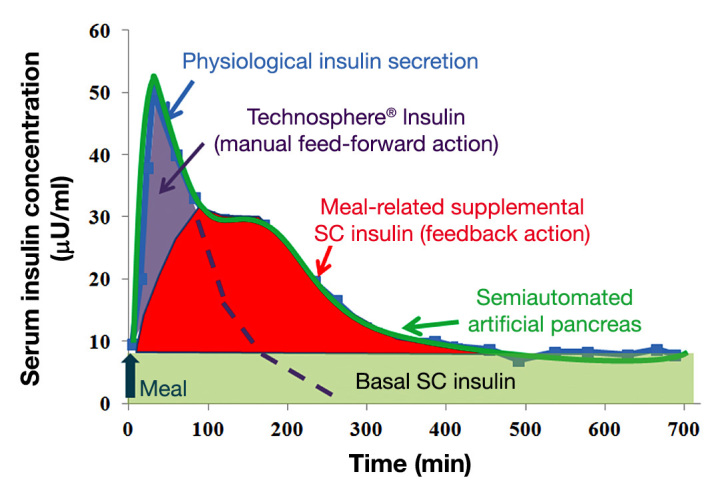
Schematic description of the semiautomated AP with TI. Rapid-acting TI mimics the cephalic and first-phase insulin secretion at mealtime, and zone-MPC-controlled CSII delivers meal-related supplemental insulin and basal insulin. The physiological insulin-secretion profile was modified from a figure in Polonsky and coauthors.34
Figure 3.

Block diagram of the semiautomated AP with TI. Inhalation of TI (manual feed-forward action) blunts the meal response, and feedback closed-loop control (CGM, control algorithm, and CSII) delivers supplemental insulin and basal insulin.
Zone Model Predictive Control
Zone-MPC is a model predictive algorithm that was designed to control predicted output within a suitable range, or zone, of values, rather than to a set point of a single value. As discussed in the work of Grosman and coauthors,32 high-frequency measurement errors in glucose measure-ments and model–subject mismatches in the current AP make the use of a specific set point for BG regulation irrelevant or impractical.32 Also, normoglycemia itself is defined as a zone. Thus defining the control objective as a zone is a natural strategy for the algorithm of an AP.32
The essence of the zone-MPC algorithm is well represented by its cost function. As given in Equation (3), the zone- MPC algorithm that is used in this work defines the upper and lower boundaries as soft constraints, and the optimization coefficient of the cost function switches between zero and one when the predicted output is within or outside of the boundaries, respectively:
| (3) |
where ŷ(k + i|k), u(k + i|k), yub, ylb, P, M, and e are the predicted output, the predicted input, the upper boundary (140 mg/dl), the lower boundary (80 mg/dl), the prediction horizon, the control horizon, and the error, respectively. The error is defined in such a way that the predicted outputs are penalized only when the values are outside of the zone.32 The prediction horizon, P, was set to be nine steps (45 min), because the quality of prediction decreased beyond 45 min. The control horizon, M, and the Q-to-R ratio were tuning parameters of the zone-MPC. Thus the specific values (M of five steps, 25 min, and Q-to-R ratio of 1 to 15) of the parameters were chosen because the values resulted in the best BG regulation, which was illustrated by a fast meal disturbance rejection with minimal hypoglycemia risk. The sampling rate of the algorithm is chosen to be 5 min due to the sampling rate of the CGM device.
The model of glucose/SC insulin interaction that is used in this study is presented by Van Heusden and coauthors.22 The model utilizes a priori knowledge of a subject (i.e., individual correction factor) to account for the intersubject variability of insulin sensitivity and incorporates an adjustable safety factor to improve system robustness due to human errors in the estimation of the correction factor.22 The health monitoring system (HMS) developed by Harvey and coauthors35,36 and Dassau and coauthors37 is implemented in parallel to the control loop to provide a safety layer and further reduce hypoglycemia risk.35–37 It was designed to receive and process CGM data and make a prediction of glucose trends. The HMS automatically sends SMS and MMS (short and multimedia message services) to a predefined contact list to alert the receiver of imminent safety hazards.35–37
List of Experiments
A 24 h protocol including two meals and two snacks (Figure 4) was used to evaluate and compare the semiautomated AP with TI against the pure feedback AP and the AP with manual feed-forward SC bolus treatments. The closed-loop protocol started 2 h after a subject’s admission; dinner [50 g carbohydrate (CHO)] and breakfast (50 g CHO) were administered at 18:30 and 07:00, respectively. Then two 15 g CHO snacks were administered at 10:30 and 13:30. In the experiment of the semiautomated AP with TI treatment, a subject manually inhaled 10 U TI at dinner and breakfast, but no information was given to the closed-loop control algorithm about this event (unmeasured meal and insulin disturbance). In the experiment of the AP with manual feed-forward SC bolus treatment, a subject took a perfect bolus that was calculated based on the individual insulin-to-CHO ratio and the meal size and then informed the control algorithm of the amount of the SC bolus (announced and measured meal disturbance). The three different types of AP designs (degrees of automations) are summarized in Table 1.
Figure 4.
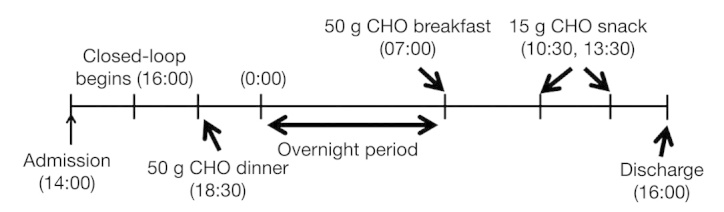
A 24 h protocol consisting of two meals (50 g CHO each), an overnight period, and two snacks (15 g CHO each).
Table 1.
Summary of Artificial Pancreas Designs (Degrees of Automations)
| Meal announcement (an anticipatory action to the meal by the user)a | Meal measurement (control algorithm’s awareness of the anticipatory action) | Comments | |
| Pure feedback AP | No | No | No anticipatory action is taken |
| Semiautomated AP with TI | Yes | No | TI is manually inhaled, but the information is not given to the control algorithm |
| AP with manual feed-forward SC bolus | Yes | Yes | Perfect SC bolus is taken, and the information is given to the control algorithm |
Manual action by the user is required.
Robustness Evaluation
We evaluated the robustness of the AP design by using a single-meal protocol with four scenarios: (A) 30% overdose of TI (70 g CHO meal + 20 U TI), (B) nominal dose of TI (100 g CHO meal + 20 U TI), (C) 30% underdose of TI (130 g CHO meal + 20 U TI), and (D) 50% partial inhalation of TI (100 g CHO meal + 20 U TI, but only 50%, or 10 U, is inhaled). In the protocol, closed-loop starts 2 h after a subject’s admission, and a single meal (70, 100, or 130 g CHO) is served 9 h after the closed-loop starts. At mealtime, a subject inhales 20 U TI, and the control algorithm is not given this information. The simulation was run until 6 h after the meal to observe the full effect of the TI inhalation.
Results
We developed an ARX model that transforms a square pulse inhalation signal into a serum insulin concentration profile based on the pharmacokinetics of TI. We incorporated the developed model into the FDA-accepted University of Virginia/Padova metabolic simulator via the IV port to reproduce the insulin action of TI. The glucose infusion rate (GIR; pharmacodynamics) was measured to evaluate the TI module. The following two subsections describe the evaluation procedures in detail.
Pharmacokinetic Model of Technosphere Insulin
The experimental data of the serum insulin concentration profile after a TI inhalation from the work of Rave and coauthors31 were used to develop an ARX model that reproduces the pharmacokinetics of TI.31 The pharmacokinetics of TI model, given in Equation (4), was developed based on the data for the inhalation of 25 U TI. A fifth-order ARX model was chosen so that the ratio between the number of data points and the order of the model (57 data points and fifth-order, respectively) was close to 10 to 1, where the model reproduced the experimental data accurately. The sampling rate of the model, the unit of the input, and the unit of the output are 5 min, U, and μU/ml, respectively. Additionally, total volume of blood in a body is assumed to be 5000 ml.38
| (4) |
As a validation of the pharmacokinetics of TI model, the predicted serum insulin concentrations of the model after 50 or 100 U TI inhalations were compared with the corresponding experimental data.31 As shown in Figure 5, the model accurately reproduced the experimental data. The correlation coefficient of determination between the model-predicted values and the experimental data, 0.89, was satisfactory, and the model-predicted values resided within a standard deviation (SD) of the corresponding experimental values.
Figure 5.
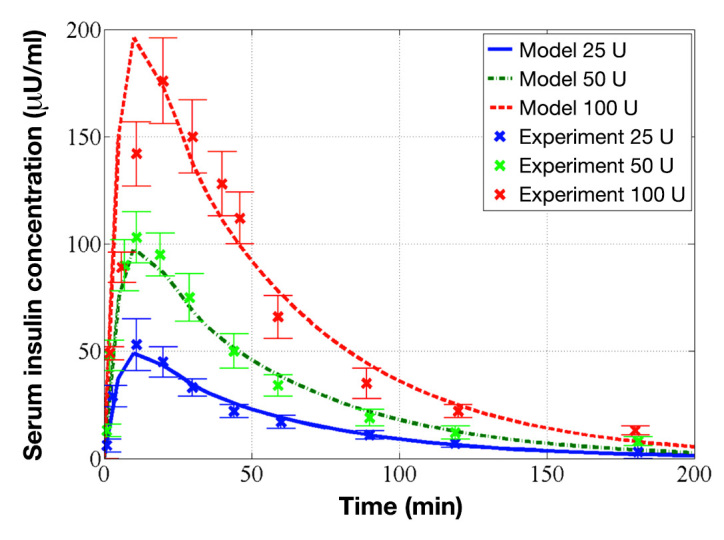
Identified pharmacokinetics of TI model and its evaluation on experimental data. The red dashed, green dashed–dot, and blue solid curves represent the model predictions for 100, 50, and 25 U, respectively, and the red × marks, green × marks, and blue × marks represent the corresponding experimental data of 100, 50, and 25 U from Rave and coauthors, respectively.31
Pharmacodynamics of the Technosphere Insulin Module
The developed pharmacokinetics of the TI model were incorporated into the metabolic simulator via the IV port to reproduce the pharmacodynamics of a TI inhalation. To validate the pharmacodynamics of the TI module (pharmacokinetics of TI model + IV port), the averageGIR of 10 in silico subjects after an inhalation of 30 U TI was obtained by an in silico clamp test and compared with experimental data obtained from MannKind Corporation (Valencia, CA; unpublished data). The procedure of the clamp test is described in the work of Heinemann and Ampudia-Blasco39 and Bequette.40 As shown in Figure 6, the average GIR curve of the in silico subjects faithfully reproduced the general shape of the experimental average GIR curve, and the two averages were well within one SD of each other. The peak times of the average GIR of the in silico subjects and the experimental participants were similar (48 and 40 min, respectively).
Figure 6.
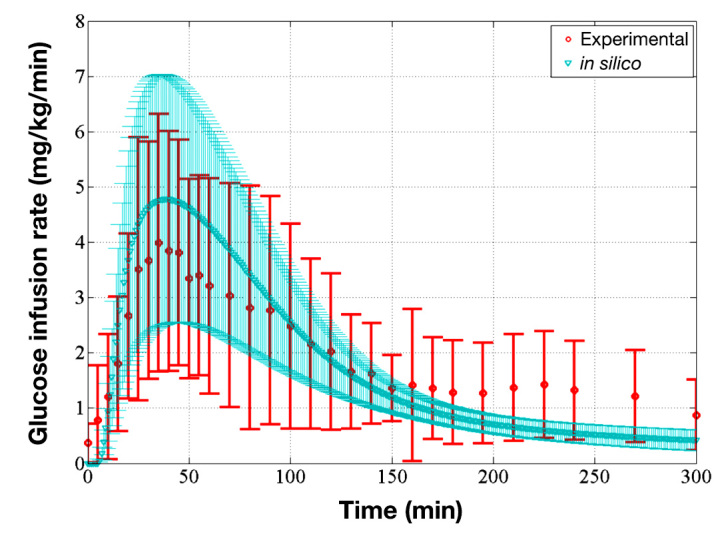
Comparison of average GIR of the in silico subjects and average GIR of the experimental participants, which validates the pharmacodynamics of the TI module. The red circles represent the average GIR of the experimental participants, and the red bars represent one standard deviation away from the average (unpublished data). The blue triangles represent the average GIR of in silico subjects, and the blue-shaded region represents one standard deviation away from the average model.
Evaluation of Semiautomated Artificial Pancreas with Technosphere Insulin
The semiautomated AP with TI that combines pulmonary and SC insulin was evaluated using the metabolic simulator and compared with pure feedback AP and AP with manual feed-forward SC bolus. The average and 1 SD envelope of 100 subjects over time is illustrated in Figure 7. Additionally, average percentages of time in the desired zones (clinically accepted region, 70–180 mg/dl, or controller target zone, 80–140 mg/dl) in the various periods (total duration, overnight, and 4 h postprandial) are listed in Table 2. The average percentages of time, taverage, were calculated as follows:
Figure 7.

Summary of BG trace and insulin delivery of 100 in silico subjects in all three cases. Left panels: Average and SD envelope of BG trace in (A) the pure feedback AP (orange dashed–dot curve and shaded region), (B) semiautomated AP with TI (blue solid curve and shaded region), or (C) AP with manual feed-forward SC bolus (black dashed curve and shaded region) cases. The sizes of the meals and snacks are also indicated (brown bars). Right panels: Average and SD envelope of insulin delivered via CSII pump in (A) pure feedback AP (orange dashed–dot curve and shaded region), (B) semiautomated AP with TI (blue solid curve and shaded region), or (C) AP with manual feed-forward SC bolus (black dashed curve and shaded region) cases. Also, the average sizes of SC manual boluses (brown bars) and the TI inhalation dosages (blue bars) are represented.
Table 2.
Percentages of Time in the Clinically Accepted Blood Glucose Region (70–180 mg/dl) and Time in the Controller Target Zone (80–140 mg/dl)
| Total (24 h) | 4 h postprandial | Overnight (00:00–07:00) | |
| 70–180 mg/dl | |||
| Semiautomated AP with TI | 96% | 87% | 99% |
| Pure feedback AP | 76% | 52% | 94% |
| AP with manual feed-forward SC bolus | 98% | 81% | 99% |
| 80–140 mg/dl | |||
| Semiautomated AP with TI | 67% | 44% | 94% |
| Pure feedback AP | 39% | 14% | 82% |
| AP with manual feed-forward SC bolus | 66% | 28% | 92% |
| (5) |
where tindividual and n are the individual’s percentage of time in a desired zone during a period and the number of subjects, 100.
Comparing average BG profiles from Figure 7, it is evident that, among the three treatment options, the inhalation of 10 U TI blunted postprandial BG elevation most successfully. Compared with the subjects from the pure feedback AP treatment, the subjects from the semiautomated AP with TI treatment experienced 32% more time in the controller target zone in the 4 h postprandial period (dinner and breakfast, not snacks) and a 39 mg/dl lower postprandial BG rise (Table 2). Also, compared with the subjects from the AP with manual feed-forward SC bolus treatment, the subjects from the semiautomated AP with TI treatment experienced 16% more time in the controller target zone in the 4 h postprandial period and a 20 mg/dl lower postprandial BG rise. The high blood glucose index (HBGI; Table 3) was also considerably lower in the case with semiautomated AP with TI (0.61) compared with that of the pure feedback AP (1.78) and that of the AP with manual feed-forward SC bolus (1.02). Furthermore, low blood glucose index (LBGI) from the semiautomated AP with TI treatment (0.32, LBGI smaller than 2.5 is considered low hypoglycemia risk41) indicated that the TI inhalation does not impose additional hypoglycemia risk on the subjects. During the semiautomated AP with TI treatment, 12 subjects experienced mild hypoglycemia (50 mg/dl < BG < 70 mg/dl), where, normally, they would not be given a supplemental dose of TI for 50 g CHO meal in clinical settings. Technosphere insulin is given as supplemental insulin to the AP to blunt the meal response. It should be noted that one dose of TI is equivalent to ~4 U of SC rapid-acting insulin analog, hence TI should not be given to individuals who require minimal meal correction based on their insulin-to-CHO ratio. Only four subjects experienced mild hypoglycemia when the same cohort was simulated without the use of TI.
Table 3.
Summary Results of Experiments
| Postprandial BG peak (mg/dl) |
HBGI | LBGI | Number of subjects experiencing mild hypoglycemia event (50 mg/dl < BG < 70 mg/dl) |
Number of subjects experiencing severe hypoglycemia event (BG < 50 mg/dl) |
|
| Semiautomated AP with TI | 143 | 0.61 | 0.32 | 12 | 0 |
| Pure feedback AP | 181 | 1.78 | 0.21 | 4 | 0 |
| AP with manual feed-forward SC bolus | 163 | 1.02 | 0.69 | 8 | 0 |
To demonstrate the differences in the closed-loop control actions of three AP designs, Figure 8 illustrates a representative individual. After meals, the pure feedback AP did not bring the BG back into the clinically accepted region within 3–4 h, because of the slow SC absorption rate. The perfect SC bolus at mealtime assisted closed-loop performance by lowering the maximum BG (162 mg/dl for dinner and 157 mg/dl for breakfast), but the BG still stayed above the controller target zone for an extended amount of time (1–3 h). The TI inhalation at mealtime lowered the maximum BG (142 mg/dl for dinner and 131 mg/dl for breakfast) and maintained the BG within the desired zone without imposing an additional hypoglycemia risk.
Figure 8.

Continuous glucose monitor trace and insulin delivery of a representative subject in all three cases. Top panel: CGM trace of an in silico subject for the pure feedback AP (orange dash–dot curve), the semiautomated AP with TI (blue solid curve), or the AP with manual feed-forward SC bolus (black dashed curve). Sizes of the meals are also indicated (brown bars). Bottom panel: Insulin delivered via CSII pump in the case of the pure feedback AP (orange dashed–dot curve), the semiautomated AP with TI (blue solid curve), or the AP with manual feed-forward SC bolus (black dashed curve). Also, the average size of SC manual bolus (brown bars) and the TI inhalation dosage (blue bars) are represented.
Robustness Analysis
Table 4 (summary of robustness evaluation) shows that, as the size of the meal decreased, the HBGI significantly decreased (3.75, 2.36, and 1.59 for experiments C, B, and A, respectively), but the LBGI remained small for all meal sizes (0.13, 0.21, and 0.34 for experiments C, B, and A, respectively). No severe hypoglycemia (BG < 50 mg/dl) event was observed in the nominal dose (experiment B) and the 30% underdose of TI (experiment C) cases, and only two subjects experienced such an event in the 30% overdose of TI (experiment A) case. Also, 50% partial inhalation of TI (experiment D) resulted in good performance (HBGI = 2.95) without imposing an additional hypoglycemia risk (LBGI = 0.10).
Table 4.
Summary of Robustness Evaluation
| Scenario A: 30% overdose of TI (70 g CHO and 20 U TI) | Scenario B: Nominal dose of TI (100 g CHO and 20 U TI) | Scenario C: 30% underdose of TI (130 g CHO and 20 U TI) | Scenario D: 50% partial inhalation of TI (100 g CHO and 50% partial inhalation of 20 U TI) | |
| HBGI | 1.59 | 2.36 | 3.75 | 2.95 |
| LBGI | 0.34 | 0.21 | 0.13 | 0.10 |
| Average maximum BG (mg/dl) | 162 ± 53 | 199 ± 51 | 222 ± 64 | 211 ± 50 |
| Number of subjects experiencing mild hypoglycemia event (50 mg/dl < BG < 70 mg/dl) |
15 | 4 | 2 | 1 |
| Number of subjects experiencing severe hypoglycemia event (BG < 50 mg/dl) |
2 | 0 | 0 | 0 |
Discussion
Establishing normoglycemia without interrupting the regular daily routine of an individual with T1DM is a challenging task.1–4 A pure feedback AP based on SC insulin requires minimal user interaction, but postprandial hyperglycemia is nearly unavoidable using the pure feedback AP without a meal announcement with ingestion of a large meal because of the slow action of SC insulin. Alternatively, an AP with a perfect estimation of the SC bolus can nearly achieve normoglycemia, but it requires meticulous calculation. Thus an AP design that can blunt a meal response with minimal user interaction may achieve superior BG regulation. The semiautomated AP with TI was designed so that it can anticipate a meal response with TI inhalation and manage BG within the normoglycemia region by zone-MPC-controlled CSII. Based on in silico evaluation results following the 24 h protocol, the semiautomated AP with TI showed better performance (i.e., lowest postprandial BG peaks and longest time in the clinically accepted BG region) than either the AP with perfect SC bolus or the pure feedback AP. Also, the robustness analysis showed that TI inhalation does not impose significant risk of hypoglycemia to users.
Conclusion
The semiautomated AP with TI has flexibility in its operation due to an optional TI inhalation and provides proper BG regulation for different users in different situations. This novel design of the AP provides superior performance over other AP designs, such as those with fully automated or manual SC bolus for meals. Therefore, a semiautomated AP with TI will reduce the likelihood of long- or short-term complications related to T1DM and improve the quality of life of people with T1DM.
Acknowledgments
MannKind Corporation provided Technosphere pharmacokinetics and pharmacodynamics data.
Glossary
- (AP)
artificial pancreas
- (ARX)
autoregressive with exogenous input
- (BG)
blood glucose concentration
- (CGM)
continuous glucose monitor
- (CHO)
carbohydrate
- (CSII)
continuous subcutaneous insulin infusion
- (FDA)
Food and Drug Administration
- (GIR)
glucose infusion rate
- (HBGI)
high blood glucose index
- (HMS)
health monitoring system
- (IV)
intravenous
- (LBGI)
low blood glucose index
- (MPC)
model predictive control
- (PID)
proportional-integral-derivative
- (SC)
subcutaneous
- (SD)
standard deviation
- (T1DM)
type 1 diabetes mellitus
- (TI)
Technosphere Insulin
Funding
This work was supported by the Juvenile Diabetes Research Foundation Grant #17-2010-765.
Disclosures
Howard Zisser and Lois Jovanovič have received research support from and are consultants to MannKind Corporation
References
- 1.Centers for Disease Control and Prevention. Atlanta: U.S. Department of Health and Human Services, Centers for Disease Control and Prevention; 2011. National diabetes fact sheet: national estimates and general information on diabetes and prediabetes in the United States. 2011. http://www.cdc.gov/diabetes/pubs/pdf/ndfs_2011.pdf. [Google Scholar]
- 2.The Diabetes Control and Complications Trial Research Group. The effect of intensive treatment of diabetes on the development and progression of long-term complications in insulin-dependent diabetes mellitus. N Engl J Med. 1993;329(14):977–86. doi: 10.1056/NEJM199309303291401. [DOI] [PubMed] [Google Scholar]
- 3.Skyler JS. 3rd ed. Philadelphia: Current Medicine Group; 2005. Atlas of diabetes. [Google Scholar]
- 4.The DCCT Research Group. Epidemiology of severe hypoglycemia in the diabetes control and complications trial. Am J Med. 1991;90(4):450–9. [PubMed] [Google Scholar]
- 5.Kovatchev BP, Gonder-Frederick LA, Cox DJ, Clarke WL. Evaluating the accuracy of continuous glucose-monitoring sensors: continuous glucose-error grid analysis illustrated by TheraSense Freestyle Navigator data. Diabetes Care. 2004;27(8):1922–8. doi: 10.2337/diacare.27.8.1922. [DOI] [PubMed] [Google Scholar]
- 6.Fogt EJ, Dodd LM, Jenning EM, Clemens AH. Development and evaluation of a glucose analyzer for a glucose controlled insulin infusion system (Biostator) Clin Chem. 1978;24(8):1366–72. [PubMed] [Google Scholar]
- 7.Wang Y, Dassau E, Doyle FJ., III Closed-loop control of artificial pancreatic Beta-cell in type 1 diabetes mellitus using model predictive iterative learning control. IEEE Trans Biomed Eng. 2010;57(2):211–9. doi: 10.1109/TBME.2009.2024409. [DOI] [PubMed] [Google Scholar]
- 8.Amrein K, Ellmerer M, Hovorka R, Kachel N, Parcz D, Korsatko S, Smolle K, Perl S, Bock G, Doll W, Kohler G, Pieber TR, Plank J. Hospital glucose control: safe and reliable glycemic control using enhanced model predictive control algorithm in medical intensive care unit patients. Diabetes Technol Ther. 2010;12(5):405–12. doi: 10.1089/dia.2009.0147. [DOI] [PubMed] [Google Scholar]
- 9.Zisser H, Dassau E, Bevier W, Harvey RA, Jovanovič L, Doyle FJ., III . Philadelphia, PA: 2012. Jun 08-12, Clinical evaluation of a fully-automated artificial pancreas using zone-model predictive control with health monitoring system. American Diabetes Association 72nd Scientific Sessions. [Google Scholar]
- 10.Atlas E, Nimri R, Miller S, Grunberg EA, Phillip M. MD-logic artificial pancreas system: a pilot study in adults with type 1 diabetes. Diabetes Care. 2010;33(5):1072–6. doi: 10.2337/dc09-1830. [DOI] [PMC free article] [PubMed] [Google Scholar]
- 11.Kovatchev B, Cobelli C, Renard E, Anderson S, Breton M, Patek S, Clarke W, Bruttomesso D, Maran A, Costa S, Avogaro A, Dalla Man C, Facchinetti A, Magni L, De Nicolao G, Place J, Farret A. Multinational study of subcutaneous model-predictive closed-loop control in type 1 diabetes mellitus: summary of the results. J Diabetes Sci Technol. 2010;4(6):1374–81. doi: 10.1177/193229681000400611. [DOI] [PMC free article] [PubMed] [Google Scholar]
- 12.Hovorka R, Allen JM, Elleri D, Chassin LJ, Harris J, Xing D, Kollman C, Hovorka T, Larsen AM, Nodale M, De Palma A, Wilinska ME, Acerini CL, Dunger DB. Manual closed-loop insulin delivery in children and adolescents with type 1 diabetes: a phase 2 randomised crossover trial. Lancet. 2010;375(9716):743–51. doi: 10.1016/S0140-6736(09)61998-X. [DOI] [PubMed] [Google Scholar]
- 13.Weinzimer SA, Steil GM, Swan KL, Dziura J, Kurtz N, Tamborlane WV. Fully automated closed-loop insulin delivery versus semiautomated hybrid control in pediatric patients with type 1 diabetes using an artificial pancreas. Diabetes Care. 2008;31(5):934–9. doi: 10.2337/dc07-1967. [DOI] [PubMed] [Google Scholar]
- 14.Hovorka R, Chassin LJ, Wilinska ME, Canonico V, Akwi JA, Federici MO, Massi-Benedetti M, Hutzli I, Zaugg C, Kaufmann H, Both M, Vering T, Schaller HC, Schaupp L, Bodenlenz M, Pieber TR. Closing the loop: the ADICOL experience. Diabetes Technol Ther. 2004;6(3):307–18. doi: 10.1089/152091504774197990. [DOI] [PubMed] [Google Scholar]
- 15.Clarke WL, Anderson S, Breton M, Patek S, Kashmer L, Kovatchev B. Closed-loop artificial pancreas using subcutaneous glucose sensing and insulin delivery and a model predictive control algorithm: the Virginia experience. J Diabetes Sci Technol. 2009;3(5):1031–8. doi: 10.1177/193229680900300506. [DOI] [PMC free article] [PubMed] [Google Scholar]
- 16.Marchetti G, Barolo M, Jovanovič L, Zisser H, Seborg DE. An improved PID switching control strategy for type 1 diabetes. IEEE Trans Biomed Eng. 2008;55(3):857–65. doi: 10.1109/TBME.2008.915665. [DOI] [PubMed] [Google Scholar]
- 17.Parker RS, Doyle FJ, III, Peppas NA. A model-based algorithm for blood glucose control in type 1 diabetic patients. IEEE Trans Biomed Eng. 1999;46(2):148–57. doi: 10.1109/10.740877. [DOI] [PubMed] [Google Scholar]
- 18.Hovorka R, Canonico V, Chassin LJ, Haueter U, Massi-Benedetti M, Orsini Federici M, Pieber TR, Schaller HC, Schaupp L, Vering T, Wilinska ME. Nonlinear model predictive control of glucose concentration in subjects with type 1 diabetes. Physiol Meas. 2004;25(4):905–20. doi: 10.1088/0967-3334/25/4/010. [DOI] [PubMed] [Google Scholar]
- 19.Zisser H, Dassau E, Bevier W, Harvey RA, Percival M, Grosman B, Seborg DE, Jovanovič L, Doyle FJ., III . San Diego, CA: 2011. Jun 24-26, Initial evaluation of a fully automated artificial pancreas. American Diabetes Association 71st Scientific Sessions. [Google Scholar]
- 20.El-Khatib FH, Russell SJ, Nathan DM, Sutherlin RG, Damiano ER. A bihormonal closed-loop artificial pancreas for type 1 diabetes. Sci Transl Med. 2010;2(27):27ra27. doi: 10.1126/scitranslmed.3000619. [DOI] [PMC free article] [PubMed] [Google Scholar]
- 21.Grosman B, Dassau E, Zisser H, Jovanovič L, Doyle FJ., III . Milano, Italy: 2011. Aug-Sep. Multi-zone-MPC: a progressive control algorithm for the artificial pancreas. Proceedings of the International Federation of Automatic Control World Congress. [Google Scholar]
- 22.Van Heusden K, Dassau E, Zisser HC, Seborg DE, Doyle FJ., III Control-relevant models for glucose control using a priori patient characteristics. IEEE Trans Biomed Eng. 2012;59(7):1839–49. doi: 10.1109/TBME.2011.2176939. [DOI] [PubMed] [Google Scholar]
- 23.Breton M, Farret A, Bruttomesso D, Anderson S, Magni L, Patek S, Dalla Man C, Place J, Demartini S, Del Favero S, Toffanin C, Hughes-Karvetski C, Dassau E, Zisser H, Doyle FJ, III, De Nicolao G, Avogaro A, Cobelli C, Renard E, Kovatchev B, International Artificial Pancreas Study Group Fully integrated artificial pancreas in type 1 diabetes: modular closed-loop glucose control maintains near normoglycemia. Diabetes. 2012;61(9):2230–7. doi: 10.2337/db11-1445. [DOI] [PMC free article] [PubMed] [Google Scholar]
- 24.Elleri D, Allen JM, Nodale M, Wilinska ME, Acerini CL, Dunger DB, Hovorka R. Suspended insulin infusion during overnight closed-loop glucose control in children and adolescents with type 1 diabetes. Diabet Med. 2010;27(4):480–4. doi: 10.1111/j.1464-5491.2010.02964.x. [DOI] [PubMed] [Google Scholar]
- 25.Hovorka R, Kumareswaran K, Harris J, Allen JM, Elleri D, Xing D, Kollman C, Nodale M, Murphy HR, Dunger DB, Amiel SA, Heller SR, Wilinska ME, Evans ML. Overnight closed loop insulin delivery (artificial pancreas) in adults with type 1 diabetes: crossover randomised controlled studies. BMJ. 2011;342:d1855. doi: 10.1136/bmj.d1855. [DOI] [PMC free article] [PubMed] [Google Scholar]
- 26.Murphy HR, Kumareswaran K, Elleri D, Allen JM, Caldwell K, Biagioni M, Simmons D, Dunger DB, Nodale M, Wilinska ME, Amiel SA, Hovorka R. Safety and efficacy of 24-h closed-loop insulin delivery in well-controlled pregnant women with type 1 diabetes: a randomized crossover case series. Diabetes Care. 2011;34(12):2527–9. doi: 10.2337/dc11-1430. [DOI] [PMC free article] [PubMed] [Google Scholar]
- 27.Patek SD, Magni L, Dassau E, Karvetski C, Toffanin C, De Nicolao G, Del Favero S, Breton M, Man CD, Renard E, Zisser H, Doyle Iii FJ, Cobelli C, Kovatchev BP. Modular closed-loop control of diabetes. IEEE Trans Biomed Eng. 2012;59(11):2986–99. doi: 10.1109/TBME.2012.2192930. [DOI] [PMC free article] [PubMed] [Google Scholar]
- 28.Cobelli C, Renard E, Kovatchev BP, Keith-Hynes P, Ben Brahim N, Place J, Del Favero S, Breton M, Farret A, Bruttomesso D, Dassau E, Zisser H, Doyle FJ, III, Patek SD, Avogaro A. Pilot studies of wearable outpatient artificial pancreas in type 1 diabetes. Diabetes Care. 2012;35(9):e65–7. doi: 10.2337/dc12-0660. [DOI] [PMC free article] [PubMed] [Google Scholar]
- 29.Angelo R, Rousseau K, Grant M, Leone-Bay A, Richardson P. Technosphere insulin: defining the role of Technosphere particles at the cellular level. J Diabetes Sci Technol. 2009;3(3):545–54. doi: 10.1177/193229680900300320. [DOI] [PMC free article] [PubMed] [Google Scholar]
- 30.Plank J, Wutte A, Brunner G, Siebenhofer A, Semlitsch B, Sommer R, Hirschberger S, Pieber TR. A direct comparison of insulin aspart and insulin lispro in patients with type 1 diabetes. Diabetes Care. 2002;25(11):2053–7. doi: 10.2337/diacare.25.11.2053. [DOI] [PubMed] [Google Scholar]
- 31.Rave K, Potocka E, Heinemann L, Heise T, Boss AH, Marino M, Costello D, Chen R. Pharmacokinetics and linear exposure of AFRESA compared with the subcutaneous injection of regular human insulin. Diabetes Obes Metab. 2009;11(7):715–20. doi: 10.1111/j.1463-1326.2009.01039.x. [DOI] [PubMed] [Google Scholar]
- 32.Grosman B, Dassau E, Zisser HC, Jovanovic L, Doyle FJ., III Zone model predictive control: a strategy to minimize hyper- and hypoglycemic events. J Diabetes Sci Technol. 2010;4(4):961–75. doi: 10.1177/193229681000400428. [DOI] [PMC free article] [PubMed] [Google Scholar]
- 33.Ljung L. 2nd ed. Upper Saddle River: Prentice Hall; 1999. System identification theory for the user. [Google Scholar]
- 34.Polonsky KS, Given BD, Van Cauter E. Twenty-four-hour profiles and pulsatile patterns of insulin secretion in normal and obese subjects. J Clin Invest. 1988;81(2):442–8. doi: 10.1172/JCI113339. [DOI] [PMC free article] [PubMed] [Google Scholar]
- 35.Harvey RA, Dassau E, Zisser H, Seborg DE, Jovanovič L, Doyle FJ., III Design of the health monitoring system for the artificial pancreas: low glucose prediction module. J Diabetes Sci Technol. 2012;6(6):1345–54. doi: 10.1177/193229681200600613. [DOI] [PMC free article] [PubMed] [Google Scholar]
- 36.Harvey RA, Dassau E, Zisser H, Bevier W, Seborg DE, Jovanovič L, Doyle FJ., III . San Diego, CA: 2011. Jun 24-26, Analysis of a hypoglycemia prediction algorithm on an extensive library of ambulatory data. American Diabetes Association 71st Scientific Sessions. [Google Scholar]
- 37.Dassau E, Jovanovic L, Doyle FJ, III, Zisser HC. Enhanced 911/global position system wizard: a telemedicine application for the prevention of severe hypoglycemia--monitor, alert, and locate. J Diabetes Sci Technol. 2009;3(6):1501–6. doi: 10.1177/193229680900300632. [DOI] [PMC free article] [PubMed] [Google Scholar]
- 38.Manzone TA, Dam HQ, Soltis D, Sagar VV. Blood volume analysis: a new technique and new clinical interest reinvigorate a classic study. J Nucl Med Technol. 2007;35(2):55–63. doi: 10.2967/jnmt.106.035972. [DOI] [PubMed] [Google Scholar]
- 39.Heinemann L, Ampudia-Blasco FJ. Glucose clamps with the Biostator: a critical reappraisal. Horm Metab Res. 1994;26(12):579–83. doi: 10.1055/s-2007-1001763. [DOI] [PubMed] [Google Scholar]
- 40.Bequette BW. Glucose clamp algorithms and insulin time-action profiles. J Diabetes Sci Technol. 2009;3(5):1005–13. doi: 10.1177/193229680900300503. [DOI] [PMC free article] [PubMed] [Google Scholar]
- 41.Kovatchev BP, Cox DJ, Gonder-Frederick LA, Young-Hyman D, Schlundt D, Clarke W. Assessment of risk for severe hypoglycemia among adults with IDDM: validation of the low blood glucose index. Diabetes Care. 1998;21(11):1870–5. doi: 10.2337/diacare.21.11.1870. [DOI] [PubMed] [Google Scholar]