Abstract
A europium (III) DOTA-tetraamide complex was designed as a MRI sensor of singlet oxygen (1O2). The water soluble, thermodynamically stable complex reacts rapidly with 1O2 to form an endoperoxide derivative that results in an ∼3 ppm shift in the position of the Eu(III)-bound water chemical exchange saturation transfer (CEST) peak. The potential of using this probe to detect accumulation of the endoperoxide derivative in biological media by ratiometric CEST imaging was demonstrated.
Singlet oxygen (1O2), the lowest excited electronic state of molecular oxygen, is a highly unstable reactive oxygen species (ROS) that plays a significant role in many chemical and biological processes including cell signaling transduction and in host defense against intruding microorganisms.1, 2 Singlet oxygen can also oxidize a variety of biological molecules including proteins, DNA and lipids resulting in inhibition of normal cell functions related to cancer, cardiovascular diseases and the aging process.3-5 Moreover, artificial photochemical generation of 1O2 is thought to be the primary species involved in destruction of malignant cells or tissues during photodynamic therapy (PDT).6, 7 However, some aspects of PDT remain controversial partly due to the lack of a reliable detection method for 1O2 in vivo.
Various methods for detection of 1O2 have been reported. 1O2 phosphorescence can be observed at 1270 nm8, 9 but the phosphorescence efficiency is low and unsuitable for monitoring 1O2 under physiological conditions because the 1O2 lifetime is very short.10 Consequently, other methods have been developed with improved sensitivity including electron spin resonance (ESR),11 absorbance,12 fluorescence 13, 14 and chemiluminescence (CL).15 Unfortunately, these methods are not widely applicable in vivo.
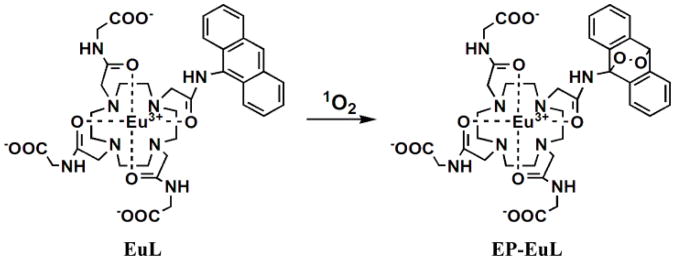
Magnetic resonance imaging (MRI) is one of the most widely used, noninvasive diagnostic imaging tools in clinical medicine today. Exogenous contrast agents derived from paramagnetic metal complexes are often used to shorten the relaxation time of water protons to enhance tissue contrast in MRI. Over the past decade, a new type of MRI agent based on chemical exchange saturation transfer (CEST) offers an option to conventional Gd3+-based T1 agents as a platform for creating MR responsive sensors.16, 17 It has been demonstrated that lanthanide complexes with various 1,4,7,10,-tetraazacyclo dodecane-1,4,7,10-tetraacetic acid (DOTA) tetraamide derivatives are quite versatile for creating responsive CEST agents. Eu3+ complexes with various DOTA-tetraamide ligands display an adequately slow water exchange rate to meet slow-to-intermediate exchange condition (kex ≤ Δω) required for CEST. Moreover, the Eu3+-water exchange peak is paramagnetically shifted well downfield of the bulk water resonance making selective activation of this exchange peak relatively convenient by MRI. Numerous studies have shown that the water CEST signal in various EuDOTA-tetraamide complexes is extremely sensitive to the chemical features of the coordinating amide side arms.17, 18 Given these prior observations, we envisioned a new type of complex, EuL (Scheme 1), that might be used as CEST probe for 1O2, wherein a 9-anthryl group is used as a specific reactive center for 1O2.13 The advantages of using a non-equilibrium probe design such as this for detection of short-lived, low concentration species such as 1O2 was recently demonstrated by Liu, et al,19 in a similar paraCEST system designed to detect NO. Our hypothesis in this work was that oxidation of the anthryl moiety to the irreversible, stable endoperoxide by reaction with 1O2 would convert sufficient EuL to EP-EuL over time to allow detection by CEST imaging.
Scheme 1.
Reaction of EuL with 1O2.
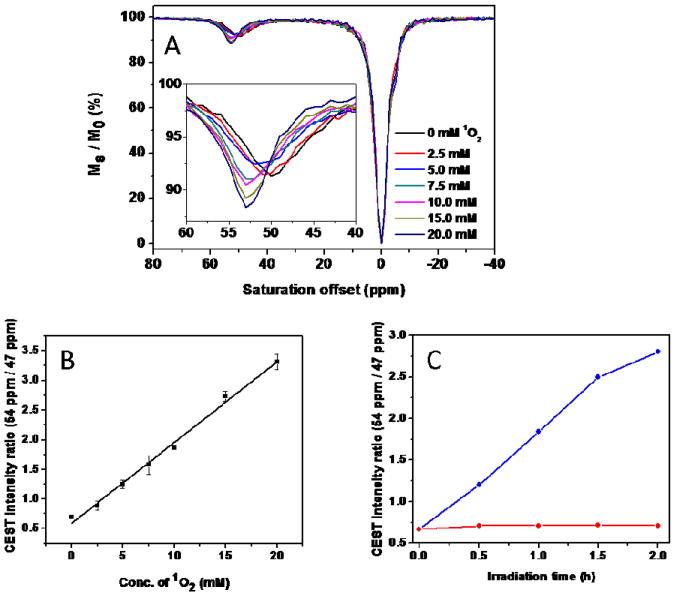
The ligand was synthesized in five-steps as outlined in Scheme S1 (supporting information). The corresponding endoperoxide was prepared by reacting EuL with chemically generated 1O2 using MoO42−/H2O2.20 Production of EP-EuL was confirmed by UV-VIS, 1H NMR, HPLC and mass spectra (Figure S1-S3). The absorption spectrum of EuL displayed two bands between 350–400 nm characterstic of the 9-anthryl moiety which disappeared after the formation of EP-EuL. The 1H NMR spectra of EuL and EP-EuL in D2O showed multiple resonances between 25-30 ppm characteristic of the four H4 macrocyclic protons in Eu3+ complexes that exist in solution in a square-antiprism (SAP) coordination geometry.21 The CEST signal of EuL showed a typical Eu3+-water exchange peak near 50 ppm, again characteristic of a SAP isomer, that shifted to 53 ppm upon formation EP-EuL (Figure 1A). The bound water lifetimes (τM) of EuL and EP-EuL were determined by fitting the experimental CEST spectra to the Bloch equations modified for exchange.22 This fitting procedure gave values of τM = 90 μs for EuL and 137 μs for EP-EuL at 298K, consistent with the sharper water exchange peak and slower water exchange rate in EP-EuL with more electron-withdrawing anthryl endoperoxide functionality.18 The ∼3 ppm frequency difference between the water exchange peaks in the complexes offered the possibility of imaging singlet oxygen as it accumulates (EuL → EP-EuL) using ratiometric methods. The CEST ratio of water intensities after presaturation at 54 vs 47 ppm was linear with 1O2 concentration over a wide range (Figure 1B). Compared with intensity-based measurements, ratiometric detection provides a built-in correction for environmental effects and increases the selectivity and sensitivity of the measurement. Although the bound water lifetimes in EuL and EP-EuL were considerably shorter as expected at 310K (30 μs for EuL and 35 μs for EP-EuL), the ratio of CEST intensities vs 1O2 concentration remained linear at the physiological temperature (figure S5).
Figure 1.
(A) CEST spectra of EuL before and after reaction with various concentrations of 1O2 generated from MoO42−/H2O2 recorded at 9.4T and 298 K. Insert: enlarged partial view of the CEST spectra. [Eu3+] = 5 mM, B1 = 9.4 μT, and sat. time = 4 s. (B) Calibration curve for 1O2 detection derived from the ratio of water intensities after presaturation at 54 vs 47 ppm. (C) The changes observed in the CEST intensity ratio (54/47) for samples of 5 mM EuL irradiated in the presence (blue) or absence (red) of 1 mM TMPyP.
Experiments were also peformed to detect singlet oxygen being produced by the irradiation of the water-soluble cationic porphyrin, TMPyP, an efficient 1O2 photosensitizer often used in the context of photodynamic therapy.7 As seen in Figure 1C, the CEST ratio (54/47) increased linearly with irradiation time up to 2 hours only in samples containing the photosensitizer. On the basis of calibration curve shown in Figure 1B, one can conclude that ∼80 percent of EuL was converted to EP-EuL after 2 hours of light irradiation.
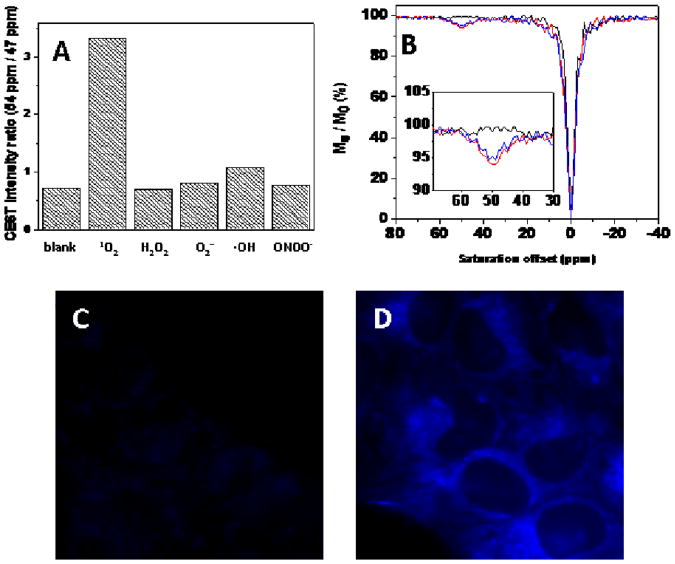
To investigate the reaction specificity of EuL with 1O2, the probe was exposed to a variety of other reactive oxygen species in aqueous buffer. No significant change in CEST signal was observed after exposure of EuL to ONOO−, H2O2, •OH or O2−• (Figure 2A). Furthermore, in the presence of excess azide, a quencher of 1O2,14 the CEST signal of EuL was also unchanged. These results indicate that EuL is highly specific for 1O2. The reaction rate of EuL with 1O2 in an aqueous buffer was determined by use of an established method (Figure S6). 14 The reaction rate constant of EuL with 1O2 was 4.9 × 10⁸ M−1 s−1, similar to the reaction rate constant of derivatives of anthrancene with 1O2.13 As an initial test of stablility, 5 mM EuL was mixed with 25 mM EDTA in Tris-HCl buffer, pH 7 and the sample was stirred for 4 hours at 298K. NMR analysis of the resulting mixture yielded a conditional stability constant of ∼1020 for EuL by using the method described by Werts, et al.23 The CEST signal of EuL was pH dependent below 4 and above pH 8 but relatively constant near physiological pH values (Figure S7). These combined results indicate that EuL may prove useful as a MRI sensor of 1O2 in many chemical and biological environments.
Figure 2.
(A) Comparisons of CEST ratios (54/47) for 5 mM EuL after reaction with different reactive oxygen species: 1O2 (produced by reacting 40 mM H2O2 with 50 mM Na2MoO4); H2O2 (40 mM H2O2); •OH (produced by reacting 40 mM H2O2 with 40 mM FeCl2); O2−• (40 mM KO2); ONOO− (40 mM NaONOO). (B) CEST spectra of the lysate of HeLa cells incubated in EuL-free saline (black line), loaded with 15 mM EuL (red line) or co-loaded with 15 mM EuL and 2 mM TMPyP, then irradiated by a 150W tungsten lamp (blue line). Insert: enlarged partial view of the CEST spectra. Fluorescence images of HeLa cells incubated without (C) or with 5 mM EuL (D) in physiological saline for 1 hr at 37°C (Objective: Plan-fluor 63×; excitation filter: 350 ± 50 nm bandpass; emission filter: 460 nm ± 50 nm bandpass; exposure time: 0.5s).
As an initial test for probe toxicity, HeLa cells grown in tissue culture plates were incubated with 15 mM EuL in physiological saline for 1 hr in a 95/5% air/CO2 chamber at 37°C, washed with PBS (5×) and harvested by treatment with trypsin. Cell viability, defined as the ratio of viable cells to total number of cells, was determined by trypan blue staining using a Neubauer hemacytometer. The cells showed no evidence of necrosis and > 97% of the cells were viable. Given that EuL is highly fluorescent as a result of strong emission from the anthryl group (385-455 nm, Figure S8), cell uptake of EuL was further examined by fluorescence microscopy. HeLa cells grown in glass cell culture dishes were incubated with 5 mM EuL in MEM for 1 h at 37°C in a 95% O2/ 5% CO2 chamber then washed five times with PBS and examined using a fluorescence microscope. As shown in Figures 2C and 2D, EuL appears to permeate the cell membrane and distribute throughout the cytoplasm. In separate experiments, HeLa cells cultured in a 75 cm3 culture flask were loaded with 15 mM EuL for 1 hr at 37°C in 95% O2/5% CO2, washed 7 times with saline, lysed by scraping and sonication, and transferred to a NMR tube for CEST. The lysate of EuL-loaded HeLa cells displayed an obvious CEST signal at 50 ppm with similar features as seen previously for EuL in aqueous buffer (Figure 2B). The amount of EuL per cell as measured by inductively coupled plasma - optical emission spectroscopy (ICP-OES) was 7.5±1.6 × 10⁻¹⁴ mol. If one assumes a cell volume of ∼4.2 × 103 μm3, the intracellular concentration of EuL could be estimated at ∼17 mM. This indicates that EuL is highly cell permeable and likely distributes into cells by pinocytosis or macropinocytosis24 although given the high concentration of agent presented to cells, passive transport could also be partially involved.
Given that 1O2 is widely regarded as the primary effector of tissue damage during PDT,6,7 quantification of singlet oxygen during treatment may be important for proper dosimetry.25 The intent of the present work is to investigate whether 1O2 generated upon irradiation of a sensitizer deposited in living cells can simulate PDT in vitro. To test this, HeLa cells cultured in a 75 cm3 culture flask were co-loaded with 15 mM EuL and 2 mM TMPyP and the flask was irradiated from a distance of 10 cm using a 150W tungsten lamp for 30 min. Longer irradiation times were not possible due to cell heating. After irradiation, the cells were washed 7 times, lysed by scraping and sonication, and analyzed by CEST spectroscopy. No significant difference could be detected between the CEST signals (Fig. 2B) of EuL in irradiated versus non-irradiated cells. This indicates that the amount of EP-EuL produced during this 30 min period of irradiation was too small to detect by CEST spectroscopy. TMPyP has been reported to localize largely in the nucleus14 while EuL appears to be localized largely in cytoplasm so any 1O2 produced by TMPyP in this experiment was likely quenched by water and intracellular 1O2 scavengers (histidine and tryptophan)26 such that only a few 1O2 molecules may have come in direct contact with EuL. For increased conversion of the intracellular probe to endoperoxide, a more efficient photosensitizer and longer irradiation times may be necessary. Nevertheless, the data suggest that EuL is taken up by cells so may prove useful for monitoring production of intracellular 1O2 during prolonged PDT treatment.
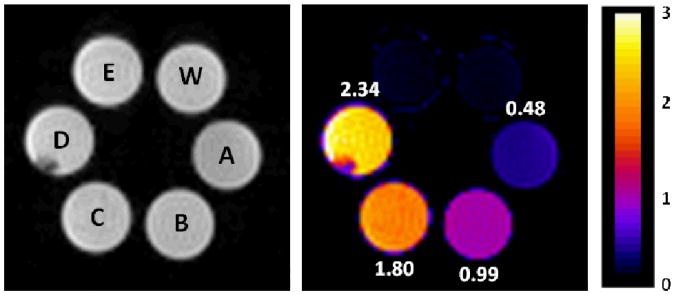
Finally, to demonstrate that this chemical reaction can be imaged by MRI, CEST images of a phantom prepared from four EuL samples exposed to different concentrations of 1O2 (plus a control sample lacking EuL and the lysate of EuL-deposited HeLa cells) were collected by using two different presaturation frequencies, 54 and 47 ppm. The ratio of the water intensity in these two images defines the CEST image. As shown in the images of Figure 3, the samples containing either water alone (sample labeled W) or the lysate of EuL-deposited HeLa cells (sample labeled E) showed no CEST signal while the CEST ratio in images of the remaining four samples varied from 0.48 (10 mM EuL without exposure to 1O2) to 2.34 (10 mM EuL exposed to 30 mM 1O2). This shows that CEST imaging can be used to quantify 1O2 as long as the concentration of EuL is sufficiently high to generate a CEST signal. The concentration of europium in sample E was later found to be only 0.54 mM, well below the CEST detection limit.
Figure 3.
Images of phantoms containing water alone (W), 10 mM EuL exposed to different concentrations of singlet oxygen (A: 0 mM 1O2, B: 10 mM 1O2, C: 20 mM 1O2, D: 30 mM 1O2) or E: a cell lysate derived from EuL-deposited HeLa cells. The images were recorded at 9.4T and 298 K. (a) Proton density images, (b) ratiometric CEST images after activation at 55 versus 48 ppm.
In conclusion, we have demonstrated the potential of a europium(III)-based PARACEST probe for detection of singlet oxygen (1O2) by ratiometric CEST imaging. The probe has several favorable features including high chemical specificity for 1O2, kinetic and thermodynamic stability, rapid reaction kinetics with 1O2, water solubility and a signal that is independent of pH over the physiological range. These combined features indicate that EuL could be useful for MRI detection of 1O2 in many chemical and biological environments. The major limitation of this probe currently is the amount needed for detection by CEST imaging. There are multiple approaches ond might take to improve the sensitivity of this reagent. First, one could replace the carboxyl groups on the glycine substituents with phosphonate ester groups to lengthen the bound water lifetime and thereby increase CEST sensitivity.27 Second, one could replace the anthracene group on EuL with 10-methyl-9-anthracene, a derivative has been shown to react ∼10-fold faster14 with 1O2. Such replacement should allow greater accumulation of the corresponding EP-EuL endoperoxide derivative over any given period of time and hence improve the prospects of detecting the end-product. A third approach would be to generate low molecular weight polymer28 of EuL which could result in greater cell uptake of the agent. Finally, newer pulse sequences such as FLEX29 that do not require RF pre-saturation of the bound water signal may ultimately provide a mechanism to enhance the sensitivity of PARACEST agents such as this. Given these potential enhancements, the probe platform reported here may ultimately prove useful for detection of 1O2 generated in cells during photodynamic therapy.
Supplementary Material
Acknowledgments
The authors acknowledge partial financial support for this work from the National Institutes of Health (CA-115531, EB-02584, and EB-00482) and the Robert A. Welch Foundation (AT-584).
Footnotes
Electronic Supplementary Information (ESI) available: [Synthetic procedure, experimental detail, UV-VIS spectra, 1H NMR Spectra, HPLC chromatograms, fluorescence spectra, CEST spectra as a function of applied B1, and CEST fitting data]. See DOI: 10.1039/b000000x/
References
- 1.Klotz LO, Briviba K, Sies H. Methods Enzymol. 2000;319:130–143. doi: 10.1016/s0076-6879(00)19015-9. [DOI] [PubMed] [Google Scholar]
- 2.Nishinaka Y, Arai T, Adachi S, Takaori-Kondo A, Yamashita K. Biochem Biophys Res Commun. 2011;413:75–79. doi: 10.1016/j.bbrc.2011.08.052. [DOI] [PubMed] [Google Scholar]
- 3.Stief TW. Med Hypotheses. 2003;60:567–572. doi: 10.1016/S0306-9877(03)00026-4. [DOI] [PMC free article] [PubMed] [Google Scholar]
- 4.Davies M. J Biochem Biophys Res Commun. 2003;305:761–770. doi: 10.1016/s0006-291x(03)00817-9. [DOI] [PubMed] [Google Scholar]
- 5.Langie SAS, Cameron KM, Waldron KJ, Fletcher KPR, von Zglinicki T, Mathers JC. Mutagenesis. 2011;26:461–471. doi: 10.1093/mutage/ger005. [DOI] [PubMed] [Google Scholar]
- 6.Weishaupt KR, Gomer CJ, Dougherty TJ. Cancer Res. 1976;36:2326–2329. [PubMed] [Google Scholar]
- 7.Bonnett R. Chem Soc Rev. 1995;24:19–33. [Google Scholar]
- 8.Kuimova MK, Yahioglu G, Ogilby PR. J Am Chem Soc. 2009;131:332–340. doi: 10.1021/ja807484b. [DOI] [PubMed] [Google Scholar]
- 9.Niedre M, Patterson MS, Wilson BC. Photochem Photobiol. 2002;75:382–391. doi: 10.1562/0031-8655(2002)075<0382:DNILDO>2.0.CO;2. [DOI] [PubMed] [Google Scholar]
- 10.Schweitzer C, Schmidt R. Chem Rev. 2003;103:1685–1757. doi: 10.1021/cr010371d. [DOI] [PubMed] [Google Scholar]
- 11.Jung MY, Choi DS. J Agric Food Chem. 2010;58:11888–11895. doi: 10.1021/jf101587c. [DOI] [PubMed] [Google Scholar]
- 12.Steinbeck MJ, Khan AU, Karnovsky MJ. J Biol Chem. 1992;267:13425–13433. [PubMed] [Google Scholar]
- 13.Tanaka K, Miura T, Umezawa N, Urano Y, Kikuchi K, Higuchi T, Nagano T. J Am Chem Soc. 2001;123:2530–2536. doi: 10.1021/ja0035708. [DOI] [PubMed] [Google Scholar]
- 14.Song B, Wang GL, Tan MQ, Yuan JL. J Am Chem Soc. 2006;128:13442–13450. doi: 10.1021/ja062990f. [DOI] [PubMed] [Google Scholar]
- 15.Li XH, Zhang GX, Ma HM, Zhang DQ, Li J, Zhu DB. J Am Chem Soc. 2004;126:11543–11548. doi: 10.1021/ja0481530. [DOI] [PubMed] [Google Scholar]
- 16.Ward KM, Aletras AH, Balaban RS. J Magn Reson. 2000;143:79–87. doi: 10.1006/jmre.1999.1956. [DOI] [PubMed] [Google Scholar]
- 17.Viswanathan S, Kovacs Z, Green KN, Ratnakar SJ, Sherry AD. Chem Rev. 2010;110:2960–3018. doi: 10.1021/cr900284a. [DOI] [PMC free article] [PubMed] [Google Scholar]
- 18.Ratnakar SJ, Woods M, Lubag AJM, Kovacs Z, Sherry AD. J Am Chem Soc. 2008;130:6–7. doi: 10.1021/ja076325y. [DOI] [PMC free article] [PubMed] [Google Scholar]
- 19.Liu G, Li Y, Pagel MD. Magn Reson Med. 2007;58:1249–1256. doi: 10.1002/mrm.21428. [DOI] [PubMed] [Google Scholar]
- 20.Aubry JM, Cazin B. Inorg Chem. 1988;27:2013–2014. [Google Scholar]
- 21.Zhang SR, Winter P, Wu KC, Sherry AD. J Am Chem Soc. 2001;123:1517–1518. doi: 10.1021/ja005820q. [DOI] [PubMed] [Google Scholar]
- 22.Woessner DE, Zhang SR, Merritt ME, Sherry AD. Magn Reson Med. 2005;53:790–799. doi: 10.1002/mrm.20408. [DOI] [PubMed] [Google Scholar]
- 23.Werts MHV, Verhoeven JW, Hofstraat JW. J Chem Soc -Perkin Trans. 2000;2:433–439. [Google Scholar]
- 24.New EJ, Congreve A, Parker D. Chem Sci. 2010;1:111–118. [Google Scholar]
- 25.Jarvi MT, Niedre MJ, Patterson MS, Wilson BC. Photochem Photobiol. 2011;87:223–234. doi: 10.1111/j.1751-1097.2010.00851.x. [DOI] [PubMed] [Google Scholar]
- 26.Wei CY, Song B, Yuan JL, Feng ZC, Jia GQ, Li C. J Photochem Photobiol A-Chem. 2007;189:39–45. [Google Scholar]
- 27.Rojas-Quijano FA, Benyó ET, Tircsó G, Kálmán FK, Baranyai Z, Aime S, Sherry AD, Kovács Z. Chem Eur J. 2009;15:13188–13200. doi: 10.1002/chem.200901095. [DOI] [PMC free article] [PubMed] [Google Scholar]
- 28.Wu YK, Zhou YF, Ouari O, Woods M, Zhao PY, Soesbe TC, Kiefer GE, Sherry AD. J Am Chem Soc. 2008;130:13854–13855. doi: 10.1021/ja805775u. [DOI] [PMC free article] [PubMed] [Google Scholar]
- 29.Lin CY, Yadav NN, Friedman JI, Ratnakar J, Sherry AD, van Zijl PCM. Magn Reson Med. 2012;67:906–911. doi: 10.1002/mrm.24161. [DOI] [PMC free article] [PubMed] [Google Scholar]
Associated Data
This section collects any data citations, data availability statements, or supplementary materials included in this article.


