Abstract
Objective
3-iodothyronamine (T1AM), an analog of thyroid hormone, is a recently discovered fast-acting endogenous metabolite. High single dose treatments of T1AM have produced rapid short-term effects, including a reduction of body temperature, bradycardia, and hyperglycemia in mice.
Design and Methods
The present study monitored the effect of daily low doses of T1AM (10mg/Kg) for eight-days on weight loss and metabolism in spontaneously overweight mice. The experiments were repeated twice (n=4). Nuclear magnetic resonance (NMR) spectroscopy of plasma and real-time analysis of exhaled 13CO2 in breath by cavity ringdown spectroscopy (CRDS) were used to detect T1M-induced lipolysis.
Results
CRDS detected increased lipolysis in breath shortly after T1AM administration that was associated with a significant weight loss but independent of food consumption. NMR spectroscopy revealed alterations in key metabolites in serum: valine, glycine, and 3-hydroxybutyrate, suggesting that the subchronic effects of T1AM include both lipolysis and protein breakdown. After discontinuation of T1AM treatment, mice regained only 1.8% of the lost weight in the following two weeks, indicating lasting effects of T1AM on weight maintenance.
Conclusions
CRDS in combination with NMR and 13C-metabolic tracing constitute a powerful method of investigation in obesity studies for identifying in vivo biochemical pathway shifts and unanticipated debilitating side effects.
Introduction
3-Iodothyronamine (T1AM) is thought to be an endogenous derivative of thyroid hormone discovered in 2004 (1). To date, the physiological effects of endogenous T1AM remain elusive, although there is increasing interest in its physiological function and pharmaceutical potential due to the role it plays in lipid and glucose metabolism (2–4). Research shows that T1AM action is mediated through non-genomic signaling (5), binding to G-protein coupled receptors such as trace amines associated receptors type 1 (TAAR-1) (6) and Alpha-2A adrenergic receptors (2). Time-course studies indicate that T1AM has a fast action and causes significant changes in body temperature, activity level and glucose metabolism (1, 4, 7). On the basis of these findings, we hypothesize that T1AM is involved in rapid regulation of lipid metabolism that is central to its metabolic functions.
Reports on measurements of endogenous T1AM concentrations remain conflicting (8–10), which is likely due to the differences in measuring unbound versus total (bound and unbound) T1AM (11). Pharmacological studies of T1AM administration (on the order of nmol/kg body weight) show that T1AM causes symptoms consistent with a hypermetabolic phase, such as increased activity and food consumption (12). However, the majority of T1AM research has used a high dose (50mg/kg body weight) that induces a severe hypometabolic state, suggesting that T1AM works in opposition to thyroid hormone. Symptoms of this hypometabolic state include increased lipid utilization resulting in a decrease in body fat, as well as decreased body temperature, chronotropy, inotropy, and physical activity (1–3, 6, 13, 14).
High doses of T1AM (i.e. 50mg/kg body weight) could have potential applications in emergency medicine because it protects against ischemic injury following stroke (15) or in space travel because it induces profound hypothermia and torpor-like symptoms (7). However, the pharmacological potential of multiple lower doses of T1AM to regulate metabolism, has not yet been explored. Previous studies have noted no observable adverse effects up to two months following a single administration of 50 mg/kg body weight T1AM (1), indicating that long-lasting adverse side effects following the discontinuation of treatment are unlikely.
In this study, we focused on investigating the effects of chronic treatment of T1AM at a lower pharmaceutical dose on lipid metabolism in a spontaneously obese mouse model by multianalytical techniques. T1AM was administered to mice daily at a dose of 10mg/kg body weight for 8 days, while breath stable isotope ratios were monitored continuously by Cavity Ring Down spectroscopy (CRDS) and plasma samples were collected and analyzed by Nuclear Magnetic Resonance (NMR)-based metabolomics to determine the efficacy of the treatment to induce weight loss and screen for possible unexpected side effects. Untargeted NMR-based metabolomics is a powerful tool to allow general screening of potential metabolic effects of T1AM treatment while a targeted method uses 13C-metabolic labeling to specifically trace endogenous vs. exogenous metabolites contributing to the treatment. Our results show that using CRDS in combination with NMR and 13C-metabolic labeling and tracing can provide a powerful analytical tool for identifying in vivo T1AM associated changes in energy substrate utilization.
Materials and Methods
Reagents
Purified crystalline 3-iodothyronamine was produced as previously described (1). [U-13C]-glucose was from Sigma-Aldrich Corp. (St Louis, MO, USA). 0.9% saline was from Hospira Corp. (Lake Forest, IL, USA).
Experimental procedures
All animal procedures were approved by University of Wisconsin, College of Letters and Science, Animal Care and Use Committee (Madison, WI, USA). Spontaneously obese female CD-1 mice from the F2 generation of mice bred in-house (originally obtained from Harlan, Indianapolis, IN) were used for this study. Mice were at least 1 year of age at the time of the study and weighed between 40–67g. All animals were housed in standard polycarbonate shoebox cages except while in the metabolic chamber and had ad libitum access to feed (AIN-93G Harlan Teklad, Madison, WI, USA) and water except during glucose tolerance tests. Animals were maintained on a 12-hour light/dark cycle. Mice were randomly assigned to treatments of either 10mg/kg/day T1AM (n=4) or sham (n=3) per each eight-day treatment time interval. Body mass and feed consumption was assessed daily at either 21:00hrs or 8:00hrs. To test reproducibility of chronic low dose T1AM treatment, the experiment was repeated for a second group of animals, sham (n=4) and T1AM treated animals (n=4) seven instead of eight days with 6–7 months old mice whole weights were 30–40 g mice. The breath and blood collected as described below. In the first study, animals had access to food during breath collection and blood samples were collected in non-fasting condition. In the second study animals were fasted 4 hour prior to blood collection.
Preparation of T1AM
A stock solution of T1AM (56mg in 112NL of DMSO carrier) was dissolved in 33.6mL of medical grade 0.9% saline, which was then aliquoted into volumes for single injections at final 10mg/kg body weight. A vehicle solution was made of 112NL DMSO carrier in 33.6mL 0.9% saline solution for injecting sham animals. All T1AM and vehicle solutions were stored at −80°C until use.
Preparation of glucose solution
2g of [U-13C]-glucose in 6mL medical grade 0.9% saline and individually aliquoted and were stored at −80°C until injection time.
Breath sample collection
Single animals were placed in a flow through custom-made 1230cm3 metabolic chamber as previously described (16, 17). The chamber contained aspen bedding and free access to food and water. Animals were acclimated to the chamber one week prior to the study to reduce stress and associated weight loss. Furthermore, animals were placed in the chamber for two hours prior to injection to capture a steady baseline δ13C value prior to injection with T1AM or saline. All animals were then injected at 12:00hr daily from day 0–7 intraperitoneally with either 10mg/kg T1AM or vehicle (total injection volume in mL was 0.06 times body weight in grams). Immediately after injection the animals were returned to the chamber and breath delta values measured for four more hours. Then they were returned to their home cage. This process was repeated for each animal separately and the treatment was done each day at the same time for a period of one week per animal. All data were collected at the same time of day to account for diurnal variation that is known to affect δ13C values in mice (16). Isotopic CO2 was measured from exhaust air using cavity ring-down spectrometer (CRDS) (Picarro Inc., Sunnyvale, CA) (16, 18, 19).
Plasma sample collection
Baseline reference plasma was collected 7 days prior to the start of injections (day −7) and then on day 0, day 7, and day 21 (followed two weeks after last day of T1AM treatment). All plasma samples were collected at 16:00hr (2-hours after injection with T1AM). For all blood collections animals were anesthetized with 2.5% isoflurane and blood was collected from the retro orbital venous plexus with heparinized capillary tubes. Plasma was then separated by refrigerated centrifugation at 1,000g for 10 min at 4°C and stored at −80°C until preparation for NMR data collection.
Analysis of long-term effects of T1AM on energy substrate utilization via [U-13C]-glucose
On day 21 of the experiment mice were fasted two hours prior to intraperitoneal injection of 20g/kg of [U-13C]-glucose. Blood was collected 2-hours later at maximum metabolic response (17). Plasma samples were prepared and stored as described above.
Preparation of plasma samples for NMR
Frozen plasma samples were allowed to thaw on ice. Ice-cold methanol (2:1, v/v) precipitation was performed to remove proteins as previously described (17). The supernatant was then dried in a speed vacuum overnight. The dried supernatant was redissolved in 20mM phosphate buffer containing 1mM 4,4-dimethyl-4-silapentane-1-sulfonic acid (DSS) and 0.1mM sodium fluoride (NaF) and the pH was adjusted to 7.4 +/− 0.05.
Collection of NMR spectra
All one-dimensional (1D) 1H-NMR spectra were collected at 25 °C on a 600 MHz Varian VNMRS spectrometer equipped with a cryogenic probe (17). Each 1D spectrum was accumulated for 1028 scans, with an acquisition time of ~400ms (4,096 complex points) and a 3 second repetition delay for a total collection time of ~2 hours (17). 1D data were then analyzed using Chenomx NMR suite (Chenomx Inc., Edmonton, Alberta, Canada) and Mestranova (Mestrelab Research, Santiago de Compostela, Spain) software to identify relative concentrations of metabolites of interest. In order to obtain one-dimensional (1D) spectra that contain only signals from 13C-bound protons, two different 1D spectra were collected as interleaved scans: one specific to 12C and the other isotopically non-specific (12C+13C) as described previously (17). Each 1D spectrum, 12C and 12C+13C, was accumulated for 1028 scans, with an acquisition time of ~400ms (4,096 complex points) and a 3 second repetition delay for a total collection time of ~2 hours. 1D subtracted spectra were then analyzed as described above.
Statistical Analysis
Despite the small sample size (n=4), normality was confirmed by 95% of the data fitting within +/− two standard deviations of the mean. Two-tailed Student’s t-test was performed on breath delta values from 0–80 minutes after T1AM injection each day for the T1AM and the sham treated groups. Body weight, feed consumption and NMR metabolite data were analyzed with two-tailed Student’s t-Tests. Differences were considered significant with p<0.05 unless otherwise stated.
Results
Body Weight
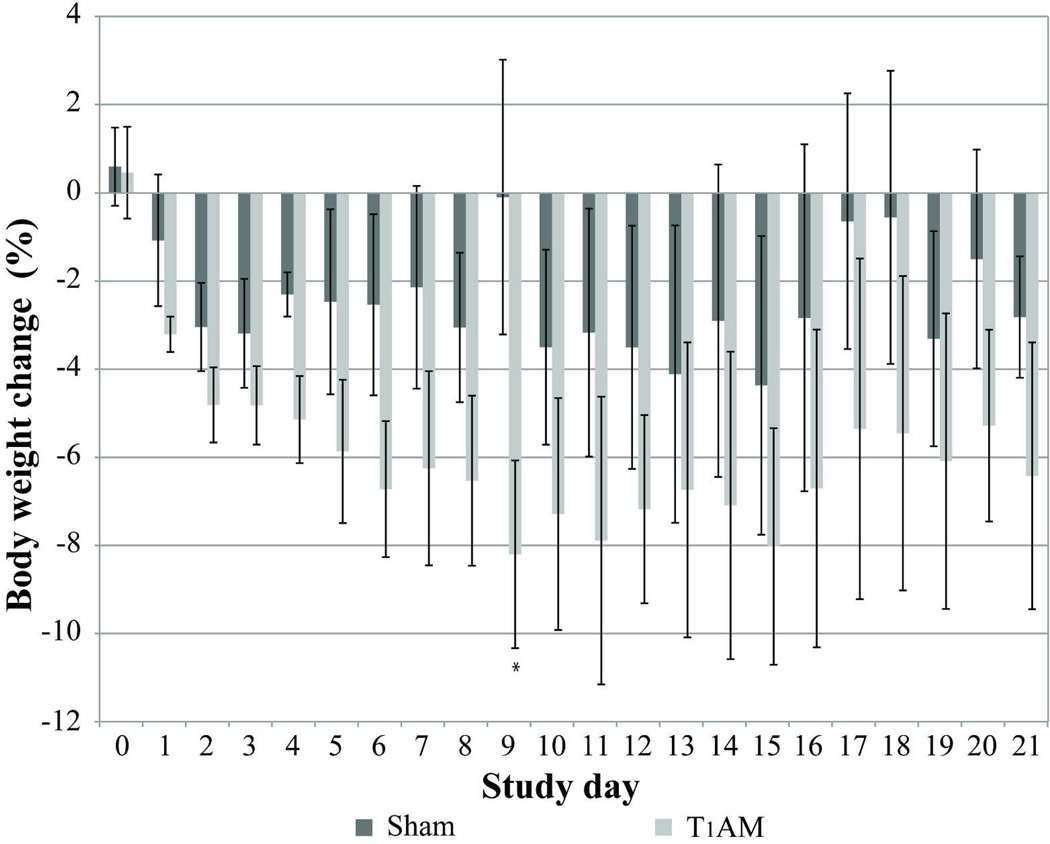
Exogenous T1AM administration was associated with a body weight loss of 8.2% of initial body weight by day 9 (p=0.038) (Figure 1). On the other hand, sham mice lost only 0.1% of their initial body weight by day 9. After T1AM withdrawal, mice regained only 1.8% of initial weight in the following 2 weeks. The chronic treatment with 10 mg/kg T1AM administration was repeated for a second time, which resulted a similar trend with a total weight loss of 8.6% of initial body weight by day 7 (data not shown).
Figure 1. Comparison of weight loss in T1AM treated and control mice.
Decrease in weight is shown as a % of body weight in T1AM treated mice (light gray bars) and sham treated mice (dark gray bars) over 21 day study period. Error bars reflect the standard error of the mean (SEM). Statistical significance (p < 0.05) compared to the vehicle treated group indicated by asterisk.
Food intake
Weight loss was not associated with any change in food intake. No difference in food intake was observed at any time during the study between T1AM and sham treated animals. There were insignificant fluctuations in the amount of food consumed at different points in the study, which was consistent for both T1AM and sham treated animals. Pre-injection food consumption averaged 3.91g/d+/−0.17 for sham and 3.30g/d +/−0.45 for T1AM (p=0.32). Food consumption during treatment decreased slightly, (sham=3.36g/d+/−0.11; T1AM=3.12g/d+/−0.47; p=0.47). Post treatment food consumption increased slightly for both groups (sham=4.13g/d+/−0.02; T1AM=4.18g/d+/−0.14; p=0.76).
Real-time breath analysis
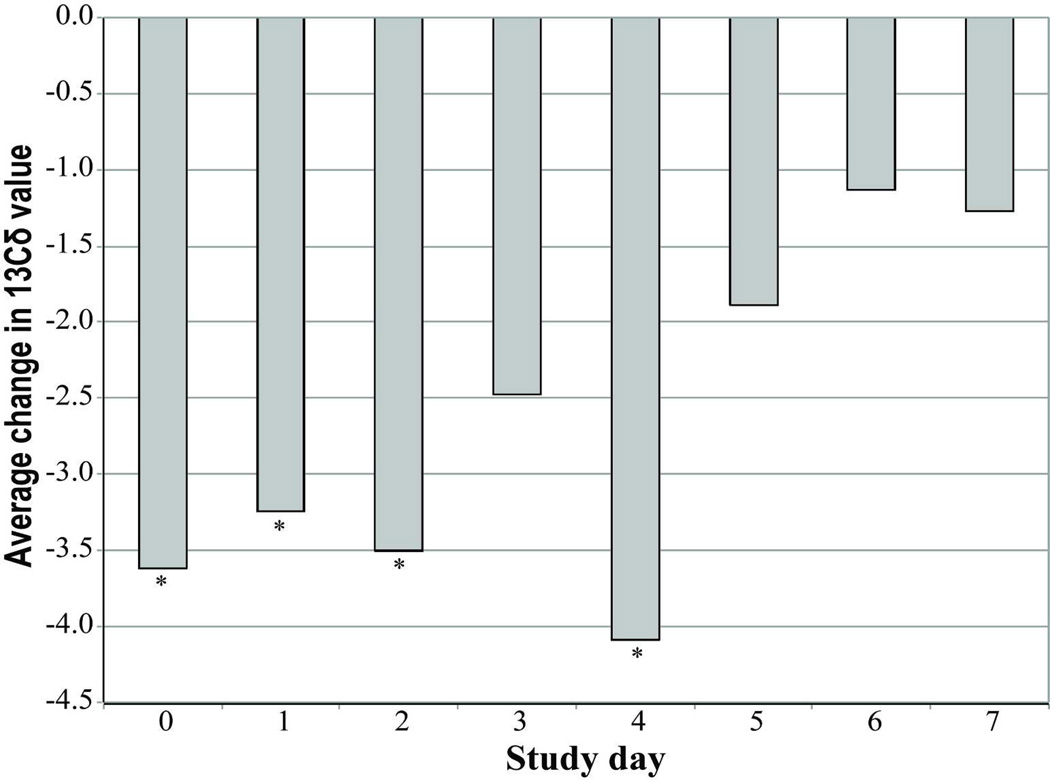
Upon switching to stored fat as a fuel source, the effect on breath δ13C values become more negative (16, 19, 20). Thus, to follow the effect of T1AM on lipid break down we measured real-time stable isotope fractionation in breath using CRDS reported as δ13C values (19). We determined the baseline real time breath δ13C values for 120 minutes prior to any treatment. The first 30 minutes allowed animals to become acclimated to the metabolic chamber. However, the breath delta values showed a steady decline shortly after T1AM injection with a minimum δ13C value at about 80 minutes post injection as compared to the control group that did not show a decline. Figure 2 shows the average daily difference between T1AM and sham injected mice for the δ13C value 80 minutes post injection. The δ13C value was significantly lower (~3.6‰) in T1AM treated mice from day 0–4 with (p < 0.05) (Figure 2). However, later in the treatment (day 5–7) the T1AM treatment effect on lipolysis was diminished (δ13C value ~2‰).
Figure 2. Exhaled breath analysis measured by CRDS reveals lipid breakdown.
Daily stable isotope breath analyses of T1AM treated animals (n=4) are reported as the average daily δ13C values. The minimum average values are at 80 minutes (δ13C80min) post injection for each treatment day. Statistical significance with p < 0.05 are indicated by asterisks.
NMR plasma analysis
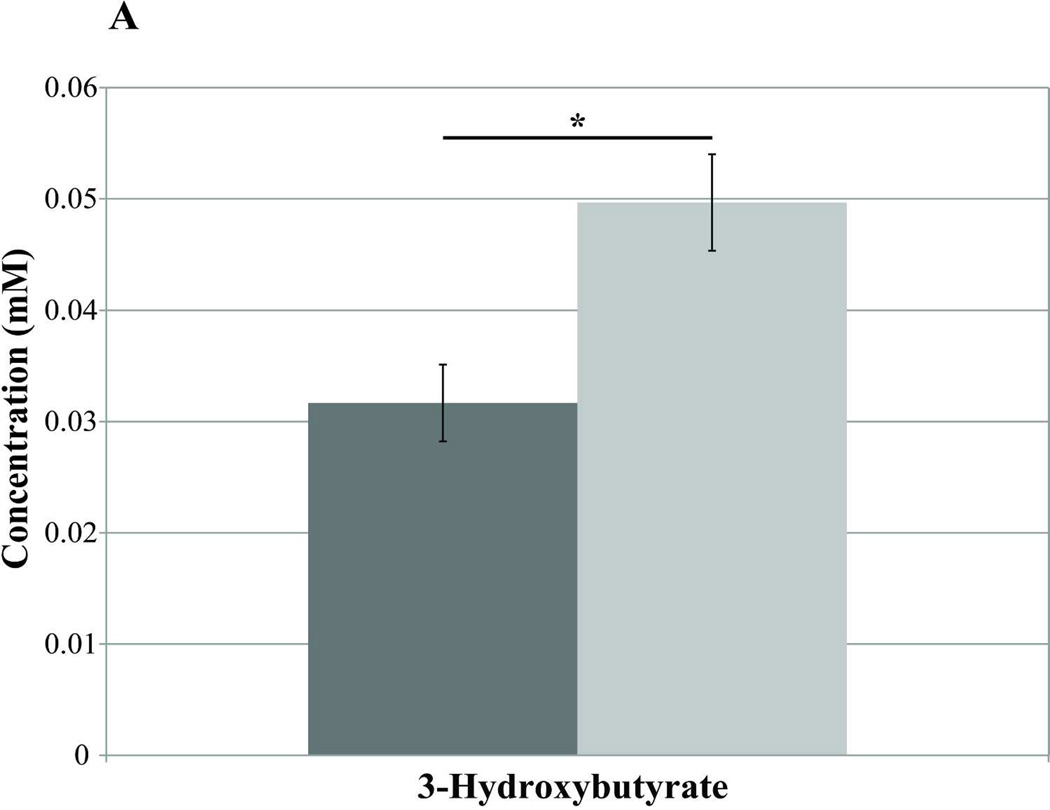
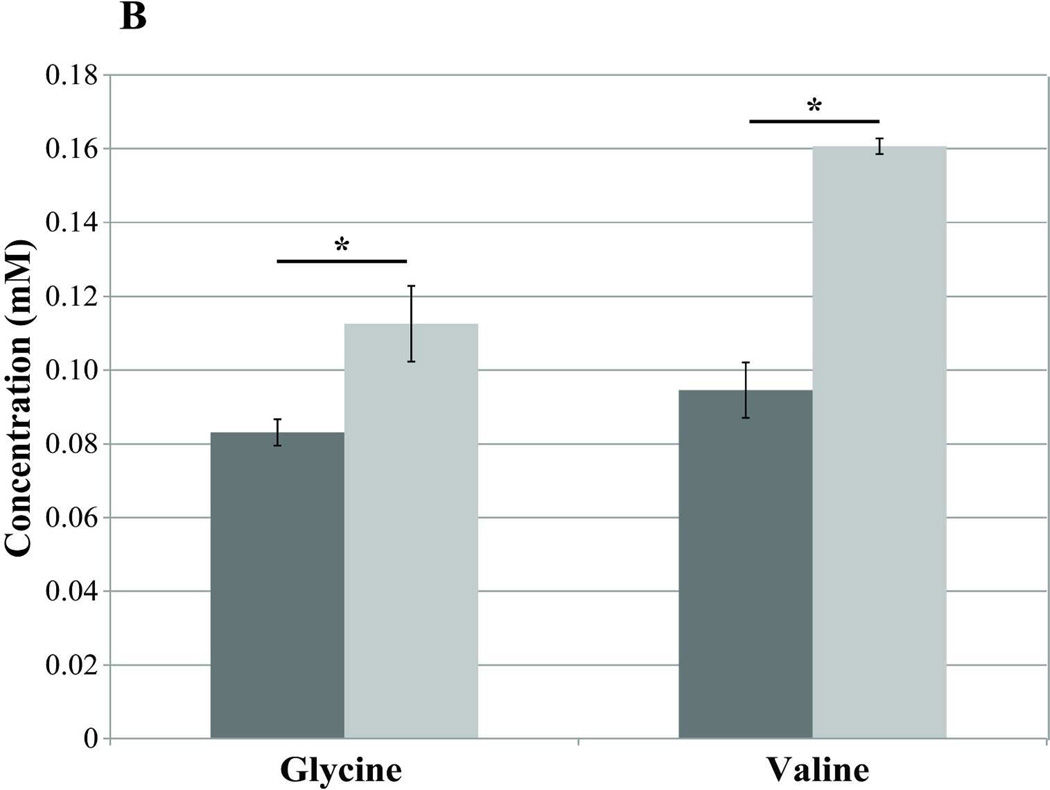
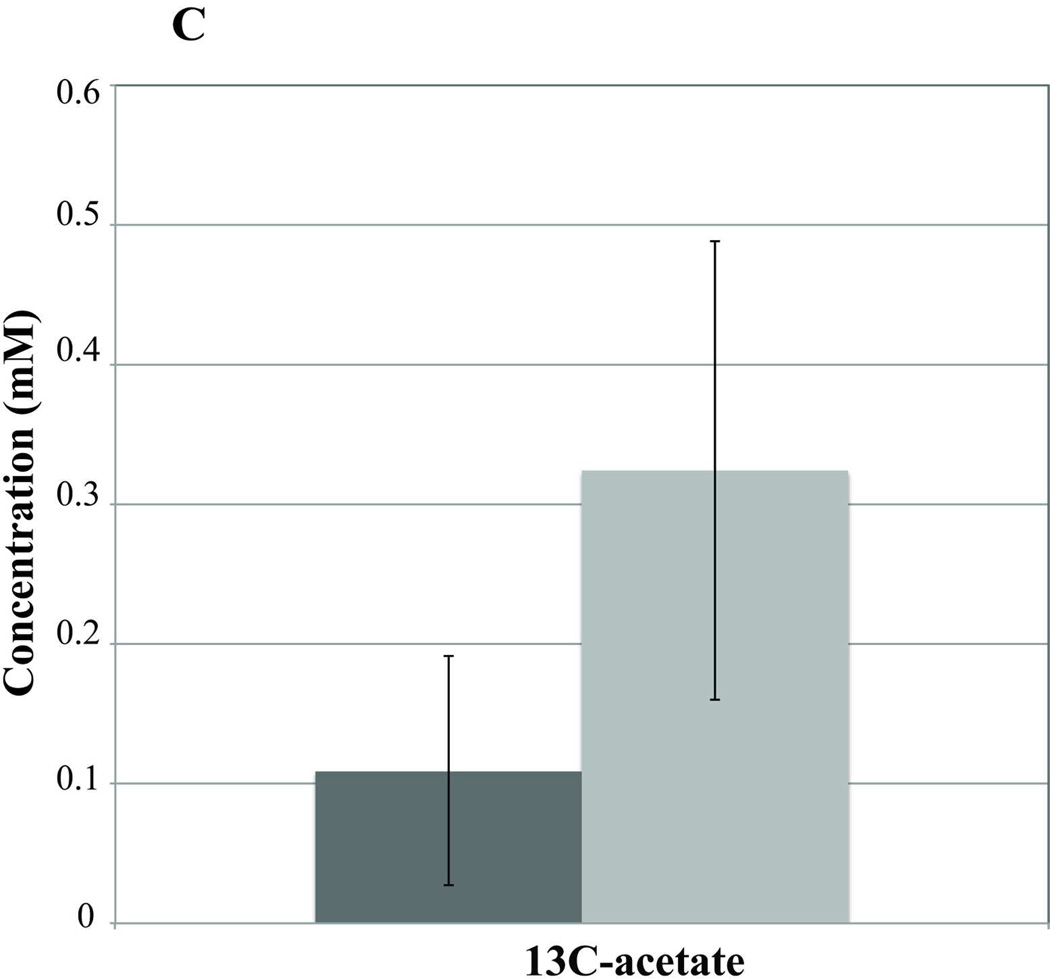
Blood samples taken on day −7 (pre-T1AM injection) and day 0 (the first 2 hrs post-T1AM injection) revealed no differences in plasma metabolites between T1AM (n=7) and sham (n=8) animals either in the fasted or the non-fasted conditions (data not shown). However, after 8 days of T1AM treatment plasma 3-hydroxybutyrate, a lipid breakdown intermediate, was significantly higher in non-fasted T1AM treated animals compared to sham animals (n=4) (p=0.031) (Figure 3A), indicating increased lipolysis in the non-fasting regime. Similarly, under fasted condition 3-hydroxybutyrate was still significantly higher in the T1AM treated group as compared to the sham group (n=4) (p=0.03). Blood samples collected on day 21, after a uniformly labeled 13C-glucose challenge, revealed increases in unlabeled (12C) glycine (1.35× controls, p=0.05) and valine (1.70× controls, p=0.001) in T1AM treated mice (Figure 3B). Interestingly, 13C labeled acetate was 2.95 times higher in the T1AM animals compared to the sham group (Figure 3C) under the non-fasting condition and still remained higher in the T1AM treated mice even in the fasted condition (p=0.286). The increased level in 13C-acetate is consistent with the lower weight gain at day 21 seen in the T1AM treated animals (1.8% weight regained by day 21).
Figure 3. Analysis of plasma by NMR-based metabolomics reveals an increase in the lipid oxidation and protein break down in non-fasting condition.
A) A significant increase in 3-hydroxybutyrate at day 7 of T1AM treatment. The concentration of 3-hydroxybutyrate is shown as light gray bars for T1AM treated mice (n=3) and dark gray bars for control mice (n=4) (p= 0.03).
B) Increases in the plasma amino acids glycine (glucogenic) and valine (branched and ketogenic/glucogenic) in post T1AM treatment regime. Plasma samples were collected in the following two weeks after discontinuation of T1AM treatment and were two hours post [U-13C]-glucose injection. The concentration of glycine (p=0.05) and valine (p=0.001) is shown as light gray bars for T1AM treated mice and dark gray bars for sham mice. T1AM associated increases in both of these amino acids indicate a shift in energy metabolism following glucose administration.
C) Increase in the plasma acetate concentration (lipid intermediate) at day 7 of T1AM post treatment. Light gray bars are for T1AM treated mice and dark gray bars represent control mice. Error bars represent the SEM. Statistical significance (p < 0.05) compared to the sham treated group are indicated by asterisks.
Discussion
This study investigated subchronic effects of T1AM treatment at a low pharmaceutical dose on lipid metabolism using three complementary technologies (CRDS, NMR-based metabolomics and 13C-isotope tracing). We administered 10mg/kg/day of T1AM for 8 days as a potential method for inducing weight loss. We followed the effect of T1AM for two additional weeks to evaluate long-lasting consequences of T1AM on weight gain and to assess the effectiveness of T1AM in maintaining a new reduced weight level and its side effects. Based on the combination of these analytical methods, we were able to show that chronic T1AM exposure induced a rapid increase in lipid mobilization, followed by a shift in macronutrient substrate oxidation from lipids to proteins in the last days of treatment.
T1AM treated mice showed continued reduction in body weight compared to sham animals, without reduction in food intake. Although daily reduction in body weight in T1AM treated mice did not reach statistical significance during the 8 days of treatment, weight loss was significantly greater than in sham mice at day 9 (−8.2 %; p=0.038 for the first study, and −8.6%; p<0.05 in the second study). Importantly, after T1AM withdrawal, the mice that were allowed ad libitum access to food, regained only a small part of the lost weight (1.8% of initial weight regained) in the following 2 weeks vs. sham mice.
Dhillo et al (2009) reported decreased levels of activity in mice at a high dose of T1AM, and no change in activity at a low dose of T1AM (12), consistent with our observations that the weight loss seen in our study is not due to increased activity. The results from this study suggest that T1AM, alone is capable of promoting weight loss, and may show increased efficacy for weight maintenance at a pharmaceutical level, if proteolysis is controlled. A recent study showed that changes in food consumption post T1AM administration follow a biphasic dose dependent response (21). The biphasic responses associated with T1AM may explain no changes on food consumption in our study, while other studies have shown various effects depending on the dose and route of administration (12, 21).
A single high dose injection of T1AM was shown to play a role in regulating glucose and lipid metabolism (2–4, 21). Specifically, T1AM induced a shift in energy metabolism from carbohydrates to lipids, which resulted in decreased fat mass (3). Our study provides the first evidence that T1AM at a subchronic, lower pharmacological dose administration, plays a role in increased lipid oxidation. We measured T1AM associated changes in energy substrate utilization by monitoring carbon stable isotope ratio (13CO2/12CO2, or δ13C value) in exhaled breath. CRDS can be used continuously for assessing lipid oxidation in real-time and non-invasively (16, 20). The results from breath analysis corroborate existing studies linking T1AM induced weight loss to increased lipolysis.
Our results showed that two hours before treatment, the baseline δ13C values were similar in both sham and T1AM treatment groups. Therefore, the depression in δ13C values following T1AM administration indicates that the differences in observed δ13C values between the two groups are attributed to the effect of T1AM shifting substrate utilization to lipids and increasing rate of expired 12CO2 release in breath. Because of the isotope effect of pyruvate dehydrogenase during synthesis, lipids were enriched in the lighter isotope 12C; thus during lipolysis more 12CO2 is generated resulting in a more negative δ13C value (18–20). The day 0 breath data indicated a rapid drop in δ13C value that reached the minimum within the first 80 minutes after T1AM injection (Figure 2). This time frame is consistent with other rapid effects of T1AM reported in the literature (1, 3), and is indicative of its rapid lipid oxidation. Thus, breath δ13C value can be used as a sensitive marker for early detection of lipolysis.
During the early days of T1AM treatment (day 0–4; day 0 being the first day of treatment), there is a significant decrease (−3.6 to −4.1) in the δ13C80min value in the T1AM treated animals (Figure 2) consistent with results from microarray studies showing increased lipase gene expression in chronic T1AM treatment in rats (M. Righi, personal communication).
Later in the treatment (day 5–7), the change in δ13C80min value only decreased by 1–2 units in T1AM treated vs. sham animals (Figure 2). These results suggest a prolonged action of T1AM on lipolysis. The continued weight loss through day 9 in the T1AM treated animals (Figure 1) is consistent with the breath data.
Non-targeted NMR metabolomics data confirmed the increase in lipid utilization. On the last day of treatment, T1AM treated mice showed a significant elevation in the plasma level of the ketone body, 3-hydroxybutyrate (Figure 3A), providing further evidence that T1AM is directly affecting lipid utilization through day 7 of treatment. Even though, Braulke et al. (3) demonstrated development of ketonuria in rodents treated with a single injection of T1AM at 50 mg/kg, our study is the first to report that low dose chronic T1AM treatment causes a significant increase in plasma ketone bodies.
We followed the longer-term effect T1AM, after two weeks discontinuation, by 13C-isotope tracing and NMR spectroscopy. Mice were challenged with [U-13C]-glucose to evaluate lipid synthesis vs. lipolysis in the post weight loss regime. Two hours after 13C-U-labeled glucose administration, both plasma 12C-glycine and 12C-valine were found to be elevated (Figure 3B), while the rate of 13C-glucose consumption was similar in T1AM-treated vs. sham animals. The 13C-U-glucose injection resulted in no statistically significant labeled (13C) metabolites, indicating that the elevated levels of 12C-valine and 12C-glycine found are indeed a product of endogenous protein catabolism. The increase in these amino acids further supports the breath data that showed a lesser decreased 13δ values indicating a shift in macronutrient substrate oxidation from lipids to carbohydrates or proteins in day 5–7 of treatment. The rise in unlabeled amino acids thus may reflect a temporary metabolic shift resulting from the need of the body to use amino acids as precursors for energy production (pyruvate in the case of glycine and Krebs cycle intermediates, such as succinyl-CoA, in the case of valine). These longer-term changes in metabolites levels in exogenously T1AM treated animals suggest that T1AM may have substantially longer-term effects on energy metabolism than previously thought, with increased endogenous protein catabolism when administered subchronically. The plasma samples following the 13C-U-glucose injection also showed an increase in 13C-acetate, which was ~3 times higher than in sham treated animals. Even though the 13C-acetate levels did not reach statistical significance the results are consistent with a decrease in lipid synthesis in T1AM treated animals that still persists two weeks post termination of T1AM treatment. While this study begins to decode longer-term effects of T1AM on metabolism, additional studies with mildly feed restricted mice are needed to examine the effects of T1AM treatment for periods longer than 8 days. The breath δ13C80min value indicates that the biological response to exogenous T1AM over an 8-day period is dynamic based on the fluctuations in energy substrate utilization. Our finding that prolonged use of T1AM affects protein catabolism is consistent with prior studies showing reduced inotropism and diminished muscle contraction strength with high doses of T1AM (1). However, to date protein catabolism has not been reported following an acute administration of T1AM. The discovery that protein catabolism induction can occur after chronic application of T1AM at low concentration is important and demonstrates the power of combined analyses for anti-obesity drug evaluations to identify unexpected side effects.
ACKNOWLEDGEMENTS
We thank Dr. Louis Aronne for his insightful advice and Dermot Haughey for participation in NMR data analysis. This work was supported in part by funds from the following: the Rodale Foundation; the Farmers Advocating for Organics (FAFO) fund to W.P.P.; grants R01 DC009018 from NIH; the Wisconsin Institute of Discovery Grant (WID-135A039) to F.M.A.P.
This study made use of the National Magnetic Resonance Facility at Madison, which is supported by NIH grants P41RR02301 (BRTP/ NCRR) and P41GM66326 (NIGMS). Additional equipment was purchased with funds from the University of Wisconsin, the NIH (RR02781, RR08438), the NSF (DMB-8415048, OIA-9977486, BIR-9214394), and the USDA.
Footnotes
Author Disclosures: The authors declare competing financial interests. Authors F.M.A.P., D.E.B., M.T., and W.P.P. are cofounders of Isomark LLC.
References
- 1.Scanlan TS, Suchland KL, Hart ME, et al. 3-Iodothyronamine is an endogenous and rapid-acting derivative of thyroid hormone. Nature medicine. 2004;10:638–642. doi: 10.1038/nm1051. [DOI] [PubMed] [Google Scholar]
- 2.Regard JB, Kataoka H, Cano DA, et al. Probing cell type-specific functions of Gi in vivo identifies GPCR regulators of insulin secretion. The Journal of clinical investigation. 2007;117:4034–4043. doi: 10.1172/JCI32994. [DOI] [PMC free article] [PubMed] [Google Scholar]
- 3.Braulke LJ, Klingenspor M, DeBarber A, et al. 3-Iodothyronamine: a novel hormone controlling the balance between glucose and lipid utilisation. Journal of comparative physiology B, Biochemical, systemic, and environmental physiology. 2008;178:167–177. doi: 10.1007/s00360-007-0208-x. [DOI] [PubMed] [Google Scholar]
- 4.Klieverik LP, Foppen E, Ackermans MT, et al. Central effects of thyronamines on glucose metabolism in rats. The Journal of endocrinology. 2009;201:377–386. doi: 10.1677/JOE-09-0043. [DOI] [PubMed] [Google Scholar]
- 5.Axelband F, Dias J, Ferrao FM, Einicker-Lamas M. Nongenomic signaling pathways triggered by thyroid hormones and their metabolite 3-iodothyronamine on the cardiovascular system. Journal of cellular physiology. 2011;226:21–28. doi: 10.1002/jcp.22325. [DOI] [PubMed] [Google Scholar]
- 6.Chiellini G, Frascarelli S, Ghelardoni S, et al. Cardiac effects of 3-iodothyronamine: a new aminergic system modulating cardiac function. FASEB journal : official publication of the Federation of American Societies for Experimental Biology. 2007;21:1597–1608. doi: 10.1096/fj.06-7474com. [DOI] [PubMed] [Google Scholar]
- 7.Ju H, So H, Ha K, et al. Sustained torpidity following multi-dose administration of 3-iodothyronamine in mice. Journal of cellular physiology. 2010;226:853–858. doi: 10.1002/jcp.22573. [DOI] [PubMed] [Google Scholar]
- 8.Saba A, Chiellini G, Frascarelli S, et al. Tissue distribution and cardiac metabolism of 3-iodothyronamine. Endocrinology. 2010;151:5063–5073. doi: 10.1210/en.2010-0491. [DOI] [PubMed] [Google Scholar]
- 9.Ackermans MT, Klieverik LP, Ringeling P, Endert E, Kalsbeek A, Fliers E. An online solid-phase extraction-liquid chromatography-tandem mass spectrometry method to study the presence of thyronamines in plasma and tissue and their putative conversion from 13C6-thyroxine. The Journal of endocrinology. 2010;206:327–334. doi: 10.1677/JOE-10-0060. [DOI] [PubMed] [Google Scholar]
- 10.Hoefig CS, Kohrle J, Brabant G, et al. Evidence for extrathyroidal formation of 3-iodothyronamine in humans as provided by a novel monoclonal antibody-based chemiluminescent serum immunoassay. The Journal of clinical endocrinology and metabolism. 2011;96:1864–1872. doi: 10.1210/jc.2010-2680. [DOI] [PubMed] [Google Scholar]
- 11.Scanlan TS. Endogenous 3-iodothyronamine (T1AM): more than we bargained for. The Journal of clinical endocrinology and metabolism. 2011;96:1674–1676. doi: 10.1210/jc.2011-0688. [DOI] [PubMed] [Google Scholar]
- 12.Dhillo WS, Bewick GA, White NE, et al. The thyroid hormone derivative 3-iodothyronamine increases food intake in rodents. Diabetes, obesity & metabolism. 2009;11:251–260. doi: 10.1111/j.1463-1326.2008.00935.x. [DOI] [PubMed] [Google Scholar]
- 13.Zucchi R, Chiellini G, Scanlan TS, Grandy DK. Trace amine-associated receptors and their ligands. British journal of pharmacology. 2006;149:967–978. doi: 10.1038/sj.bjp.0706948. [DOI] [PMC free article] [PubMed] [Google Scholar]
- 14.Frascarelli S, Ghelardoni S, Chiellini G, et al. Cardiac effects of trace amines: pharmacological characterization of trace amine-associated receptors. European journal of pharmacology. 2008;587:231–236. doi: 10.1016/j.ejphar.2008.03.055. [DOI] [PubMed] [Google Scholar]
- 15.Doyle KP, Suchland KL, Ciesielski TM, et al. Novel thyroxine derivatives, thyronamine and 3-iodothyronamine, induce transient hypothermia and marked neuroprotection against stroke injury. Stroke; a journal of cerebral circulation. 2007;38:2569–2576. doi: 10.1161/STROKEAHA.106.480277. [DOI] [PubMed] [Google Scholar]
- 16.Butz DE, Cook ME, Eghbalnia HR, Assadi-Porter F, Porter WP. Changes in the natural abundance of 13CO2/12CO2 in breath due to lipopolysacchride-induced acute phase response. Rapid communications in mass spectrometry : RCM. 2009;23:3729–3735. doi: 10.1002/rcm.4310. [DOI] [PMC free article] [PubMed] [Google Scholar]
- 17.Haviland JA, Tonelli M, Haughey DT, Porter WP, Assadi-Porter FM. Novel diagnostics of metabolic dysfunction in breath and plasma by selective isotope assisted labeling (SIAL) Metabolism. 2012;8:1162–1170. doi: 10.1016/j.metabol.2011.12.010. [DOI] [PMC free article] [PubMed] [Google Scholar]
- 18.DeNiro MJ, Epstein S. Mechanism of carbon isotope fractionation associated with lipid synthesis. Science. 1977;197:261–263. doi: 10.1126/science.327543. [DOI] [PubMed] [Google Scholar]
- 19.Schoeller DA, Brown C, Nakamura K, et al. Influence of metabolic fuel on the 13C/12C ratio of breath CO2. Biomedical mass spectrometry. 1984;11:557–561. doi: 10.1002/bms.1200111103. [DOI] [PubMed] [Google Scholar]
- 20.Hatch KA, Pinshow B, Speakman JR. The Analysis of 13C/12C Ratios in Exhaled CO2: Its Advantages and Potential Application to Field Research to Infer Diet, Changes in Diet Over Time, and Substrate Metabolism in Birds. Integrative and comparative biology. 2002;42:21–33. doi: 10.1093/icb/42.1.21. [DOI] [PubMed] [Google Scholar]
- 21.Manni ME, De Siena G, Saba A, et al. 3-iodothyronamine: a modulator of the hypothalamus-pancreas-thyroid axes in mouse. British journal of pharmacology. 2012 doi: 10.1111/j.1476-5381.2011.01823.x. [DOI] [PMC free article] [PubMed] [Google Scholar]
- 22.Scanlan TS. Minireview: 3-Iodothyronamine (T1AM): a new player on the thyroid endocrine team? Endocrinology. 2009;150:1108–1111. doi: 10.1210/en.2008-1596. [DOI] [PMC free article] [PubMed] [Google Scholar]
- 23.Ianculescu AG, Scanlan TS. 3-Iodothyronamine (T(1)AM): a new chapter of thyroid hormone endocrinology? Molecular bioSystems. 2010;6:1338–1344. doi: 10.1039/b926583j. [DOI] [PubMed] [Google Scholar]
- 24.Ianculescu AG, Friesema EC, Visser TJ, Giacomini KM, Scanlan TS. Transport of thyroid hormones is selectively inhibited by 3-iodothyronamine. Molecular bioSystems. 2010;6:1403–1410. doi: 10.1039/b926588k. [DOI] [PMC free article] [PubMed] [Google Scholar]


