

Abstract
The enzyme that acylates ghrelin was recently identified in mice as the fourth member of the membrane-bound O-acyltransferases superfamily (MBOAT4) and named ghrelin-O-acyltransferase (GOAT). Only one report showed GOAT mRNA expression in ghrelin-expressing cells of the mouse stomach. We investigated the distribution of GOAT protein in peripheral tissues and co-expression with endocrine markers in the gastric mucosa using a custom-made anti-GOAT antibody. Tissues were collected from male Sprague-Dawley rats and C57BL/6 mice. Western blot revealed two immunoreactive bands in rat and mouse gastric corpus mucosal proteins, a 50 kDa band corresponding to the GOAT protein and a 100 kDa band likely corresponding to a dimer. Western blot also detected GOAT in the plasma and levels were strongly increased after 24-h fasting in mice and slightly in rats. GOAT-immunoreactive cells were located in the gastric corpus mucosa and the anterior pituitary gland, whereas other peripheral tissues of rats and mice examined were negative. In mice, GOAT-immunoreactive cells were mainly distributed throughout the middle portion of the oxyntic glands, whereas in rats they were localized mainly in the lower portion of the glands. Double labeling showed that 95±1% of GOAT-immunoreactive cells in mice co-labeled with ghrelin, whereas in rats only 56±4% of GOAT-positive cells showed co-expression of ghrelin. The remainder of the GOAT-immunopositive cells in rats co-expressed histidine decarboxylase (44±3%). No co-localization was observed with somatostatin in rats or mice. These data suggest species differences between rats and mice in gastric GOAT expression perhaps resulting in a different role of the MBOAT4 enzyme in the rat stomach. Detection of GOAT in the plasma raises the possibility that ghrelin octanoylation may occur in the circulation and the fasting-induced increase in GOAT may contribute to the increase of acylated ghrelin after fasting.
Keywords: GOAT enzyme, gastric mucosa, immunostaining, mouse, rat
Introduction
The discovery of ghrelin as the first endogenous ligand of the growth hormone secretagogue receptor 1a (GHS-R1a) and the only peripherally produced and centrally acting peptide hormone known to increase food intake [1] has attracted much attention for the last 10 years. Ghrelin is found in the X/A-like cell, an endocrine cell type located in the middle and lower portions of the oxyntic glands of the stomach that accounts for up to 20–30% of all gastric endocrine cells, representing the second largest gastric endocrine cell population [2; 3]. The 28 amino acid peptide ghrelin is uniquely modified by octanoyl esterification of a serine residue at position three of the peptide chain. This modification is essential for ghrelin’s binding to the GHS-R1a and thus for its food intake stimulating effect [1]. For years the enzyme responsible for this modification has remained unknown. Recently, two independent groups established that the fourth member of the membrane bound O-acyl transferase family attaches the medium-chain fatty acid octanoate to ghrelin in mice [4] and humans [5] and named it ghrelin-O-acyltransferase (GOAT). GOAT is conserved across vertebrates and amino acid sequence alignment of human, mouse and rat GOAT proteins shows amino acid identity of 74.5% and similarity of 98.4%. GOAT was established to be the only acyl transferase required for the acylation of ghrelin since there is complete absence of acylated ghrelin in the circulation in GOAT gene knockout mice [5]. Although GOAT gene expression has been detected in human and mouse stomach tissue [4; 5; 6], only one report showed GOAT mRNA expression in ghrelin-expressing cells of the mouse stomach by in situ hybridization of GOAT mRNA combined with immunohistochemistry for ghrelin [6]. The localization of the GOAT protein to a specific cell type has so far been hampered by the lack of a specific antibody. Therefore, we generated a polyclonal anti-GOAT antibody against the amino acids 273–286 of the rat MBOAT4 protein using the sequence (SEAGQRPGEERYVP) predicted to be in a large loop structure before transmembrane segment 5 (extracellular epitope). We established the specificity of the antibody by Western blot analysis of rat and mouse gastric mucosal protein homogenates. We also investigated the expression of GOAT protein in peripheral tissues of rat and mouse by immunohistochemistry. To characterize the GOAT-producing cell in the rat and mouse gastric oxyntic mucosa, we performed double immunostaining for GOAT and ghrelin, histidine decarboxylase (HDC) or somatostatin followed by confocal microscopy. Regulation of GOAT protein levels in the plasma of rats and mice under different metabolic conditions was investigated using semi-quantitative Western blots of total plasma protein.
Materials and Methods
Animals
Adult male Sprague-Dawley rats (Harlan, San Diego, CA, body weight: 280–350 g) and male C57BL/6 mice (6–8 weeks of age, Harlan Laboratories) were housed in groups of 3 animals/cage under conditions of controlled illumination (12:12 h light/dark cycle, lights on/off: 6 am/6 pm), humidity (60%), and temperature (22 ± 2 ºC). Animals were fed with a standard rodent diet (Prolab RMH 2500; LabDiet, PMI Nutrition, Brentwood, MO) and tap water ad libitum. Animal care and experimental procedures followed institutional ethical guidelines and conformed to the requirements of the federal authority for animal research conduct (Animal Protocol No. 11084-03, 05-058-02).
At 9 am ad libitum fed rats and mice (n=3/species) were euthanized by CO2 anesthesia followed by cervical dislocation. Stomach, intestine, pancreas, liver, kidney, spleen, heart, skeletal muscle, lung, white adipose tissue and pituitary gland were quickly removed. The tissue was fixed in aqueous Bouin’s fixative (5% acetic acid, 9% formaldehyde, 0.9% picric acid) for 2 h, then rinsed 3x in 50% ethanol to remove fixative residues. Thereafter, tissue was processed following standard procedures and embedded in paraffin.
Antibody production
The anti-GOAT polyclonal antibody was raised against amino acids 273–286 (SEAGQRPGEERYVP) of rat MBOAT4. Immunization, generation of antisera and titer testing against the immunogenic peptide were done by GenScript Corporation (Piscataway, NJ).
Gel electrophoresis and Western blot analysis
Crude protein fractions of gastric corpus mucosa and plasma were prepared from ad libitum fed as well as 24 h fasted rats and mice. Body weight was monitored before and after the 24 h fasting period. Animals (n=3/species and condition) were euthanized at 9 am by CO2 anesthesia followed by cervical dislocation, blood (1 ml in rats and 0.5 ml in mice) was withdrawn by cardiac puncture and collected in EDTA-pre-rinsed syringes and transferred in tubes containing phenylmethylsulphonyl fluoride (PMSF, 1mM). Thereafter, blood samples were immediately centrifuged at 4 °C. The supernatant was collected and stored at −80 °C. Stomachs were immediately opened and rinsed, the corpus mucosa was scraped off and homogenized (Dounce, Wheaton, Millville, NY) on ice in chilled PBS supplemented with one tablet of protease inhibitor cocktail (Roche Applied Science, Indianapolis, IN) and PMSF (1mM). Crude protein was obtained by centrifugation of the homogenates in the Sorvall centrifuge at 12,000 g for 20 min at 4 °C to remove cell debris and nuclei. Final protein concentrations for stomach mucosa and plasma were determined using a BCA protein assay according to the manufacturer (Pierce Biotechnology, Rockford, IL).
Gel samples were prepared by mixing protein samples with gel sample buffer [4% SDS, 0.05% bromphenol blue (wt/vol), 20% glycerol, 1% > mercaptoethanol (vol/vol) in 0.1 Tris buffer, pH 6.8]. Samples were boiled for 1 min before gel electrophoresis and 20 μg of protein per lane were loaded on a 4–12% > SDS-polyacrylamide gel (NuPage; Invitrogen, Carlsbad, CA) and run in 2-(N-morpholino)ethanesulfonic acid buffer. After SDS-PAGE, proteins were transferred by electrophoresis to nitrocellulose membranes (BioPlot-NC; Costar, Cambridge, MA) for 6 h at 4 °C. Membranes were washed in distilled water and stained in Ponceau-S in 3% > trichloroacetic acid solution, and an image was taken. Membranes were washed twice with Tris-buffered saline (TBS; 10 mM Tris, 150 mM NaCl, and 0.05% Tween, vol/vol) and incubated in TBS containing 5% (wt/vol) nonfat milk (Carnation, Nestl , Glendale, CA). After 30 min, the membranes were incubated in anti-GOAT polyclonal antibody (GenScript) solution diluted 1:500 in TBS. After 1 h, membranes were washed three times with TBS and incubated with the secondary antibody solution (anti-rabbit IgG conjugated to alkaline phosphatase; Promega, Madison, WI) diluted 1:2000 in TBS. After 1 h, membranes were washed three times before color development in alkaline phosphatase buffer [100 mM Tris, 100 mM NaCl, and 5 mM MgCl2 (pH 9.5)] containing 0.3% nitroblue tetrazolium solution (vol/vol) and 0.15% 5-bromo-4-chloro-3-indolyl-l-phosphate solution (vol/vol) according to the manufacturer’s instructions (Promega) for 5–10 min. The Western blot (four squares of 352 pixels each/lane) was analyzed using Scion Image 4.0.3 (Scion Corp., Frederick, MD).
Immunohistochemical and fluorescent staining and microscopy
Five μm sections of mouse and rat tissues were cut using a microtome, de-paraffinized and re-hydrated with graded xylene-alcohol series and washed with phosphate buffered saline (PBS) three times for 15 min before immunostaining. Endogenous peroxidase was inactivated by 0.3% hydrogen peroxide in PBS for 30 min and unspecific binding was reduced by pre-treatment with 3% normal goat serum. Sections were incubated overnight at 4ºC in anti-GOAT polyclonal antibody (GenScript) at a titer of 1:200 in rat sections and 1:500 in mouse sections, then in biotinylated goat anti-rabbit IgG (1:1000, Jackson ImmunoResearch, NJ) for 1 h at room temperature followed by incubation with avidin-biotin-peroxidase complex (ABC, Vector, Vermont, CA) for 1 h at room temperature. Sections were developed with 3,3’-diaminobenzidine tetrahydrochloride hydrate and hydrogen peroxide (Sigma Chemical Co, St. Louis, MO) for 10 min and frequently checked on the microscope. Each step of incubation was followed by a 3 × 5 min washing step in PBS. Sections were mounted on Fisher SuperFrost Plus slides, air-dried for 24 h and completely dehydrated through a gradient of ethanol and xylene. Slides were studied using light microscopy.
The same protocol was applied for immunostaining after pre-absorption of the GOAT antibody. GOAT (500 μg) was incubated with 1ml rabbit anti-GOAT 1:200 in 0.3% Triton X in PBS for 2 h at room temperature followed by 22 h at 4 ºC. The solution was centrifuged for 15 min at 14,000 rpm and the supernatant was used for staining as described above.
For immunofluorescent double-staining five μm sections were pretreated with hydrogen peroxide and normal goat serum as described above and then sections were incubated overnight at 4 ºC in anti-GOAT antibody (1:50, Genscript) together with either guinea-pig anti-histidine decarboxylase (HDC, 1:1000, Eurodiagnostics, Sweden), mouse anti-ghrelin serum (1:2000, Eli Lilly Research Laboratories, Indianapolis, IN) or mouse anti-somatostatin (1:500, SST CURE S6; UCLA Digestive Diseases Research Center, Los Angeles, CA). Tetramethyl rhodamine iso-thiocyanate (TRITC) conjugated goat anti-rabbit IgG (1:1000, Jackson ImmunoResearch Laboratories, West Grove, PA), together with either fluorescein iso-thiocyanate (FITC)-labeled anti-mouse (1:500, Jackson ImmunoResearch Laboratories) or FITC-labeled anti-guinea-pig (1:100, Jackson ImmunoResearch Laboratories) antibodies were added for 2 h at room temperature. Each step of incubation was followed by a 3 × 5 min washing in PBS. Counterstaining was performed using 4’,6-diamidino-2-phenylindole (DAPI) 1:1000 for 5 min. The slides were mounted with antifade mounting medium (Vector Laboratory Inc., Burlingame, CA) and visualized by confocal microscopy (Zeiss, LSM 510, Germany). The slides were analyzed with both low power view using a 20x objective, or high power view (hpf) using a 100x objective. Five hpf were analyzed for co-expression of GOAT with other markers in the gastric mucosa and the mean ± sem was calculated.
Statistical analysis
Data are expressed as mean ± sem and were analyzed by one-way ANOVA followed by Tukey post hoc test. P < 0.05 was considered significant.
Results
Characterization of the GOAT antibody by Western blot analysis
The antibody used in this study was raised against a peptide of amino acids 273–286 (SEAGQRPGEERYVP) of rat GOAT protein (435 amino acids), which was identified as highly likely to be immunogenic. A Western blot of crude rat and mouse gastric mucosal proteins stained with this anti-GOAT antibody using the alkaline phosphatase detection method showed a ~50 kDa band which corresponds to the expected molecular weight of the GOAT monomer (Fig. 1A). A second band at ~100 kDa was observed most likely representing an SDS stable homodimer (Fig 1A). The immunoreactive bands were identical in rat (lane 2) and mouse (lane 3) crude gastric mucosal proteins indicating similar protein specificity for MBOAT4 in both rodent species (Fig. 1A).
Fig. 1.
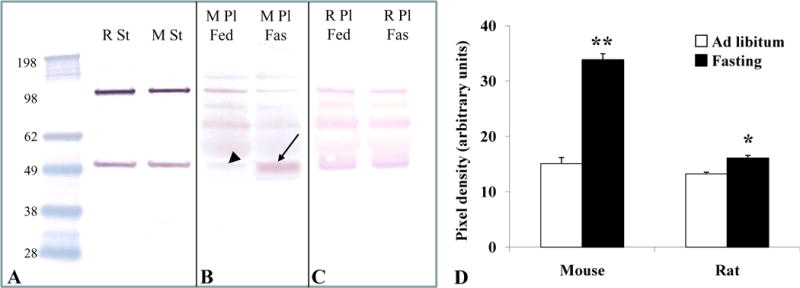
Western blot for GOAT in rat and mouse. Lane 1 contains the molecular weight standards. Lane 2 contains rat gastric mucosal protein and lane 3 contains mouse gastric mucosal protein (A). The blot shows two bands at ~50 and ~100 kDa (A). The presence of the 100 kDa band suggests a SDS-stable dimer formation of the native molecular weight of the GOAT (50 kDa, A). Fasting for 24 h resulted in a stronger band for GOAT at 50kDa in mouse plasma (lane 5, arrow, B) compared to ad libitum feeding conditions (lane 4, arrowhead, B) indicating increased plasma levels of GOAT. Differences were less pronounced between plasma obtained from ad libitum fed (lane 6, C) and 24 h fasted rats (lane 7, C). Semi-quantitative analysis showed an increase of GOAT protein in the plasma by 124% in mice and by 22% in rats after 24 h fasting compared to ad libitum feeding conditions (D). p < 0.01 and p < 0.001 vs. ad libitum feeding. Abbreviations: Fas, 24 h fasted; Fed, ad libitum fed; M, mouse; Pl, plasma; R, rat; St, stomach.
GOAT protein is up-regulated after 24 h fasting in mice and rats
Similar to crude rat and mouse gastric mucosal proteins, Western blot of total plasma proteins from ad libitum fed mice and rats using the anti-GOAT antibody showed the presence of the 50 kDa and 100 kDa band indicating that full length GOAT is released into the circulation (Figs. 1B and 1C). Semi-quantitative analysis revealed that in 24 h fasted mice the monomer increased in concentration (+124%, p < 0.001; Figs. 1B and 1D), while the probable homodimer decreased. Similarly, fasting for 24 h resulted in an increase of GOAT in the plasma of rats (p < 0.01; Figs. 1C and 1D), although less pronounced (+22%). After 24 h fasting, there was a significant difference between body weight loss in mice (mean ± sem: −12.6 ± 0.9 % of body weight) versus rats (−9.4 ± 0.4 % of body weight, p < 0.05; data not shown).
GOAT immunohistochemistry in the rat and mouse gastric corpus mucosa
In rats and mice, the overall distribution of GOAT protein throughout the body appeared to be similar. GOAT-immunoreactivity was detected in the gastric corpus (Figs. 2A+B) and anterior pituitary gland (Fig. 2C), while there was no immunohistochemical staining observed in the pancreas including endocrine islets, liver, kidney, spleen, heart, skeletal muscle, lung, and white adipose tissue (data not shown). As expected, in mouse gastric corpus, the distribution of GOAT-positive cells was consistent with the distribution of ghrelin-containing X/A-like cells mainly in the middle of the oxyntic glands (Fig. 2A). However, there was a different distribution of GOAT-positive cells in the rat gastric corpus (Fig. 2B). In addition to immunopositive cells in the middle of the oxyntic glands (Fig. 2B, lower area of image), there was a high concentration of GOAT-immunoreactive cells at the base of the glands (Fig. 2B, upper area of image). After pre-absorption of the GOAT antibody with GOAT immunogenic peptide no immunostaining was detected in rat (Fig. 2D) and mouse stomach tissue (data not shown).
Fig. 2.
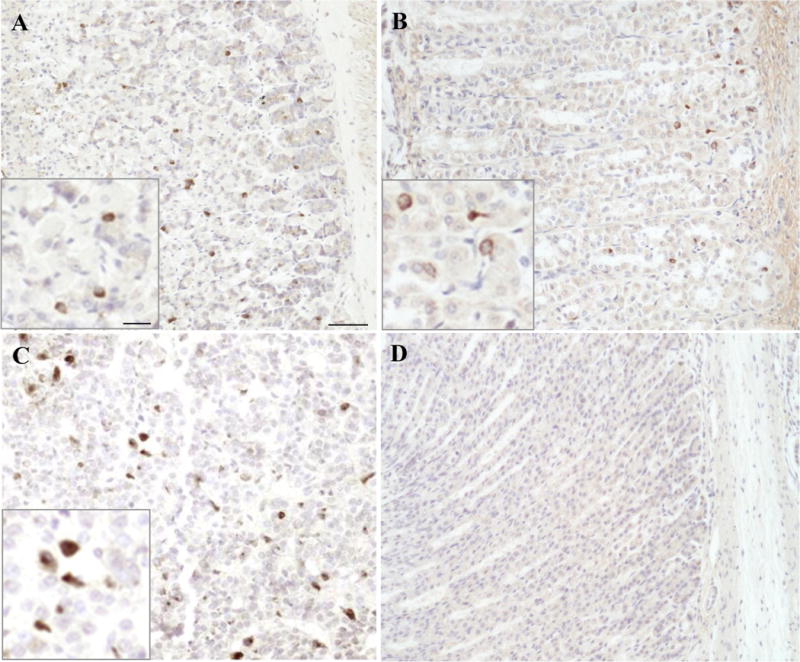
GOAT-immunoreactive cells in the rat and mouse gastric oxyntic mucosa. The anti-GOAT antibody was used for immunohistochemical staining using the DAB method on Bouin’s fixed sections of rat and mouse gastric oxyntic mucosa. The image shows immunohistochemical staining for GOAT in the gastric oxyntic mucosa of mouse in the mid portion (A) and predominantly at the base of the glands in rat (B). GOAT-immunoreactive cells were also observed in the rat pituitary gland (C), whereas no signals were detected in the rat gastric oxyntic mucosa following pre-absorption of the anti-GOAT antibody with GOAT immunogenic peptide (D). The inserts show higher magnifications of the labeled cells. The scale bar in (A) represents 50 μm and 25 μm in the insert.
GOAT immunofluorescent double labeling with ghrelin, histidine decarboxylase and somatostatin
Dual immunofluorescent labeling of mouse gastric oxyntic mucosal sections showed that the vast majority (95 ± 1%) of GOAT-immunoreactive cells co-labeled with ghrelin (Fig. 3A). In the rat gastric oxyntic mucosa, GOAT-positive cells at the middle of the glands (56 ± 4% of all GOAT-immunoreactive cells) showed co-expression of ghrelin (Figs. 3B and 4A). The remainder of GOAT-positive cells (44 ± 3%) present at the base of the glands co-expressed histidine decarboxylase (HDC, Figs. 3C and 4B). This indicates that in the rat both, ghrelin-expressing X/A-like cells and HDC-expressing ECL cells co-express GOAT. No double labeling was observed for GOAT and somatostatin in the rat or mouse gastric oxyntic mucosa (data not shown).
Fig. 3.
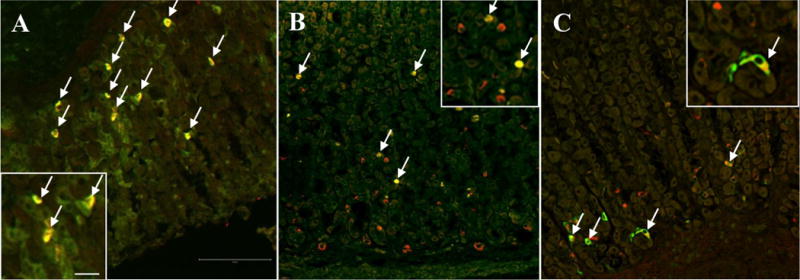
Confocal microscopy of doubly labeled oxyntic mucosal sections of mouse and rat. The majority of GOAT-immunoreactive cells (red, A) are located in the mid portion of the mouse oxyntic glands and co-localize with ghrelin (green, arrows, A). In the rat gastric mucosa (B and C), GOAT-immunoreactive cells (red, B) are located at the mid and the base of the oxyntic glands, whereas ghrelin-positive cells (green, B) are mainly seen at the mid portion of the glands. Those cells co-express GOAT and ghrelin (arrows, B). Many of the GOAT-positive cells (red, C) at the base of the glands also express HDC (green, arrows, C). The inserts show higher magnification of double labeled cells. The scale bar in (A) represents 100 μm and 25 μm in the insert.
Fig. 4.
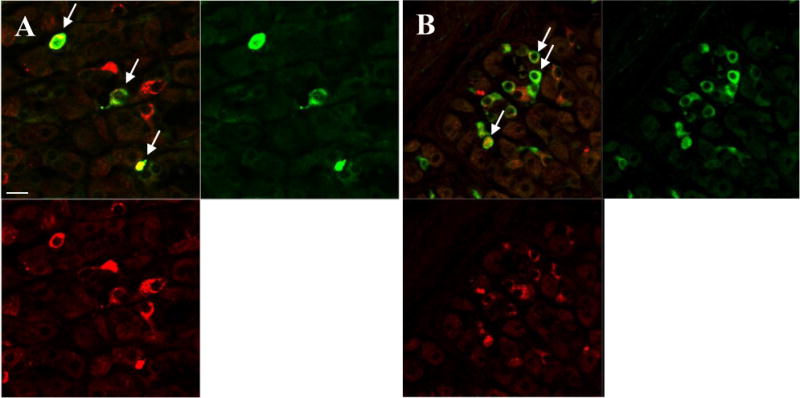
High resolution confocal microscopy of a doubly labeled rat oxyntic mucosal section with anti-GOAT (red) together with anti-ghrelin or anti-HDC antibodies (green). Only half of the GOAT-immunoreactive cells at the mid portion of the glands co-express ghrelin (arrows, A). At the base, approximately half of the GOAT-positive cells co-localize with HDC, a marker for ECL cells (arrows, B). The scale bar represents 10 μm.
Discussion
This is the first report of immunohistochemical characterization of GOAT protein expression and distribution in rat and mouse peripheral tissues. The polyclonal antibody, raised against a 14 amino acid sequence of rat GOAT, labels two immunoreactive bands of GOAT protein corresponding to a monomeric and probably a SDS-stable homodimeric form in total crude cellular protein from gastric oxyntic mucosa of both rat and mouse stomach. In addition, full length monomeric and dimeric GOAT protein is detected in the plasma protein fraction in both mice and rats, indicating that GOAT is released into the circulation.
In mice gastric corpus, GOAT-immunoreactive endocrine cells were mainly localized in the middle of the oxyntic glands. This distribution is consistent with ghrelin-expressing X/A-like cells [7]. Indeed, in this species, almost all GOAT-immunoreactive cells (95%) were also positive for ghrelin, as detected by confocal microscopy of ghrelin and GOAT co-stained sections. In contrast, in the rat gastric corpus, many of the GOAT-immunoreactive cells were also found at the base of the oxyntic glands, a distribution consistent with ECL cells. As shown by confocal microscopy of ghrelin or HDC and GOAT co-labeled sections, only 56% of GOAT-expressing cells co-expressed ghrelin, whereas 44% of GOAT-immunoreactive cells found predominantly at the base of the oxyntic glands co-expressed HDC, a marker enzyme of ECL cells. This result suggests that in the rat, ghrelin may be acylated not only within the X/A-like cell but also at the surface of GOAT-expressing ECL cells. Alternatively, although the acyl transferase MBOAT4 was renamed GOAT due to its specificity and high affinity in ghrelin acylation, it may have additional functions in rat ECL cells. This warrants further investigation.
We found that in mice and slightly in rats, monomeric GOAT protein concentration in the plasma was higher after 24 h fasting, which may result in increased ghrelin acylation. This may augment ghrelin’s orexigenic effect in addition to the fasting-induced increase in gastric ghrelin mRNA expression, decrease in ghrelin peptide content in X/A-like cells, and increase in plasma ghrelin levels, which has been shown in both mice and rats [8; 9]. The difference in the percentage of GOAT increase (+124% in mice versus +22% in rats) could be explained by a possibly different function of MBOAT4/GOAT in rats but also by the difference in severity of the metabolic stressor as perceived by mice and rats since mice lost significantly more body weight compared to rats during the fasting period of 24 h. This stronger response may contribute to the different regulation of GOAT expression observed in the present study.
In summary, the anatomic localization and regulation of GOAT varies in mice and rats. Whereas it is mainly co-localized with ghrelin-producing X/A-like cells in mice, it also co-localizes with HDC-producing ECL cells in rats suggesting additional functions for MBOAT4/GOAT in rats. Of importance, the first demonstration of the circulating GOAT protein could point towards an extracellular acylation of ghrelin. The increase of circulating GOAT could cause an increased capacity of ghrelin acylation in response to fasting. Since the acyl group has been found to be essential for the interaction with the GHS-R1a and the stimulation of food intake [10], the regulation of ghrelin acylation is of utmost importance and warrants further investigations not only in rodents but also in humans.
Acknowledgments
This work was supported by the VA Research Career Scientist Award, Department of Veterans Affairs Merit Award (Y.T.), NIHDK 33061 (Y.T.), Center grant DK-41301 (Animal Core, Y.T.), NIHDK 058333 (G.S.), NIHDK 053642 (G.S.), German Research Foundation grant STE 1765/1-1 (A.S.) and grant GO 1718/1-1 (M.G.).
Footnotes
Publisher's Disclaimer: This is a PDF file of an unedited manuscript that has been accepted for publication. As a service to our customers we are providing this early version of the manuscript. The manuscript will undergo copyediting, typesetting, and review of the resulting proof before it is published in its final citable form. Please note that during the production process errors may be discovered which could affect the content, and all legal disclaimers that apply to the journal pertain.
References
- 1.Kojima M, Hosoda H, Date Y, et al. Ghrelin is a growth-hormone-releasing acylated peptide from stomach. Nature. 1999;402:656–60. doi: 10.1038/45230. [DOI] [PubMed] [Google Scholar]
- 2.Bordi C, D’Adda T, Azzoni C, Ferraro G. Classification of gastric endocrine cells at the light and electron microscopical levels. Microsc Res Tech. 2000;48:258–71. doi: 10.1002/(SICI)1097-0029(20000301)48:5<258::AID-JEMT3>3.0.CO;2-Q. [DOI] [PubMed] [Google Scholar]
- 3.Rindi G, Torsello A, Locatelli V, Solcia E. Ghrelin expression and actions: a novel peptide for an old cell type of the diffuse endocrine system. Exp Biol Med (Maywood) 2004;229:1007–16. doi: 10.1177/153537020422901004. [DOI] [PubMed] [Google Scholar]
- 4.Yang J, Brown MS, Liang G, Grishin NV, Goldstein JL. Identification of the acyltransferase that octanoylates ghrelin, an appetite-stimulating peptide hormone. Cell. 2008;132:387–96. doi: 10.1016/j.cell.2008.01.017. [DOI] [PubMed] [Google Scholar]
- 5.Gutierrez JA, Solenberg PJ, Perkins DR, et al. Ghrelin octanoylation mediated by an orphan lipid transferase. Proc Natl Acad Sci U S A. 2008;105:6320–5. doi: 10.1073/pnas.0800708105. [DOI] [PMC free article] [PubMed] [Google Scholar]
- 6.Sakata I, Yang J, Lee CE, et al. Colocalization of ghrelin O-acyltransferase and ghrelin in gastric mucosal cells. Am J Physiol Endocrinol Metab. 2009;297:E134–41. doi: 10.1152/ajpendo.90859.2008. [DOI] [PMC free article] [PubMed] [Google Scholar]
- 7.Stengel A, Goebel M, Yakubov I, et al. Identification and characterization of nesfatin-1 immunoreactivity in endocrine cell types of the rat gastric oxyntic mucosa. Endocrinology. 2009;150:232–8. doi: 10.1210/en.2008-0747. [DOI] [PMC free article] [PubMed] [Google Scholar]
- 8.Toshinai K, Mondal MS, Nakazato M, et al. Upregulation of Ghrelin expression in the stomach upon fasting, insulin-induced hypoglycemia, and leptin administration. Biochem Biophys Res Commun. 2001;281:1220–5. doi: 10.1006/bbrc.2001.4518. [DOI] [PubMed] [Google Scholar]
- 9.Kim MS, Yoon CY, Park KH, et al. Changes in ghrelin and ghrelin receptor expression according to feeding status. Neuroreport. 2003;14:1317–20. doi: 10.1097/01.wnr.0000078703.79393.d2. [DOI] [PubMed] [Google Scholar]
- 10.Kojima M, Kangawa K. Ghrelin: structure and function. Physiol Rev. 2005;85:495–522. doi: 10.1152/physrev.00012.2004. [DOI] [PubMed] [Google Scholar]