Abstract
Objectives: To clarify whether ultrasound findings of skin and subcutaneous tissue represent the severity of lymphedema.
Materials and Methods: Thirty-five patients with secondary lower extremity lymphedema caused by intrapelvic lymph node dissection during cancer surgery, who first visited our clinic between April 2009 and March 2012, were studied retrospectively. At their first visit, skin thickness, subcutaneous tissue thickness, and subcutaneous echogenicity were assessed at 8 points on the thigh and leg of both legs using an 11-MHz ultrasound transducer. These findings correlated with the International Society of Lymphology (ISL) clinical stage.
Results: Skin thickness, subcutaneous tissue thickness, and subcutaneous echogenicity all showed significant positive correlation with the ISL stage. However, measuring skin and subcutaneous tissue thicknesses was not feasible in 29%–71% of scanning points in stage III legs because of poor delineation of boundaries at the dermo-hypodermal junction and the upper boundary of the muscular fascia. However, subcutaneous echogenicity was assessable at all scanning points and was linearly correlated with ISL stage.
Conclusion: Evaluating subcutaneous echogenicity is feasible even with low-resolution ultrasound and reflects the ISL stage. These findings may thus be valuable to objectively represent the severity of extremity lymphedema.
Keywords: ultrasound, skin, subcutaneous tissue, lymphedema
Introduction
The clinical severity of lymphedema in an extremity is generally graded according to the International Society of Lymphology (ISL) stage.1) Because the ISL stage mainly consists of findings achieved by physical examinations and represents the most severely affected leg part, it is subjective and does not reflect the distribution and mode of progression of the disease. Accordingly, developing more objective measures may be useful to delineate the disease status more clearly. The characteristic skin and subcutaneous tissue changes in extremities with chronic lymphedema are caused by changes in the extracellular matrix, such as connective tissue hypertrophy, fat accumulation resulting from both fat hypertrophy and an increased number of adipocytes, and interstitial protein-rich fluid accumulation.2) The observation of these changes in various parts of the extremity may further elucidate the severity and extent of disease. Ultrasound (US) can be one of the best tools for this purpose. In contrast to computed tomography (CT) or magnetic resonance imaging (MRI), US is readily available in many clinics and is also noninvasive and quite inexpensive. Although particular ultrasonographic findings have not been established to confirm the diagnosis of lymphedema, features typically found in limbs with lymphedema—such as increased thickness of the skin and subcutaneous tissue,3) unclear delineation at the dermo-hypodermal junction,4) and diffuse subcutaneous fibrosclerosis observed as increased echogenicity of the fat layer5)—have been reported.
In the current study, we retrospectively reviewed these ultrasound findings in legs with secondary lymphedema, and observed their correlation with ISL clinical stage, to determine whether these findings represent disease progression.
Patients and Methods
In this retrospective study, we investigated patients who met the following inclusion criteria:
First visit to the clinic between April 2009 and March 2012
Newly diagnosed with secondary leg lymphedema
Lymphedema was due to intra-pelvic lymph node dissection during cancer surgery
Diagnosis was confirmed by lymphangioscintigraphy (LAS)
Venous insufficiency was excluded by venous duplex ultrasound
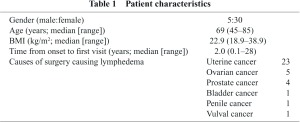
Thirty-five patients (i.e., seventy lower extremities) met the above requirements and were included in the study. Characteristics of patients are summarized in Table 1. For LAS, each patient was given an intradermal injection of 111 MBq of 99mTc suspended in 0.1 mL of human serum albumin (99mTc-HAS) into the first interdigital web. The diagnosis of abnormal LAS was made according to the criteria introduced by Szuba, et al.6) and Burnand, et al.7) The clinical stage of lymphedema was assigned from the Consensus Document of ISL.1) In the current study, legs without apparent symptoms were all regarded as Stage 0 because all patients who underwent intrapelvic lymph node dissection were considered to have impaired lymph transport.
Ultrasound
At the time of the first visit for each patient, the skin and subcutaneous tissue were scanned using an ultrasound system (GE Healthcare, Little Chalfont, Buckinghamshire, UK) with an 8–12 MHz transducer. The points of scanning were the following:
Upper medial thigh (UMT): Middle upper half of the thigh, immediately anterior to the great saphenous vein.
Upper lateral thigh (ULT): Middle upper half of the thigh, lateral aspect of the quadriceps femoris muscle.
Lower medial thigh (LMT): Middle lower half of the thigh, immediately anterior to the great saphenous vein.
Lower lateral thigh (LLT): Middle lower half of the thigh, lateral aspect of the quadriceps femoris muscle.
Upper medial leg (UML): Middle upper half of the leg, immediately anterior to the great saphenous vein.
Upper lateral leg (ULL): Middle upper half of the leg, lateral aspect of the tibialis anterior muscle.
Lower medial leg (LML): Middle lower half of the leg, immediately posterior to the great saphenous vein.
Lower lateral leg (LLL): Middle lower half of the leg, lateral aspect of the tibialis anterior muscle.
The probe was placed longitudinally on the leg. Field size and gain were adjusted as necessary to optimize image quality and boundary definition.
The typical US skin image depicts the following layers: an epidermal entrance echo, the dermal layer, and the low-echogenic or non-echogenic subcutaneous tissue. An epidermal entrance echo is a highly reflective echo that originates from the uppermost portions of the epidermis because of the changes in impedance from the coupling medium to the stratum corium. The dermis is less echogenic than the epidermal entrance echo and contains many different echoes of various intensities. This is the result of reflection of the ultrasound waves from the interface between collagen fibers and the surrounding intercellular matrix and the cells. The subcutaneous, low-echogenic layer contains horizontal or obliquely oriented echogenic lines caused by connective tissue bundles that represent fat lobules and connective tissue septa. The muscular fascia, which is the lower boundary of subcutaneous tissue, can be clearly identified in the normal state.8)
Skin and subcutaneous tissue thickness
When the dermo-hypodermal junction was clearly identified, the full skin thickness (epidermis and dermis) from the anterior echogenic border of the epidermis to the posterior echogenic border of the dermis was measured in B-mode. Subcutaneous tissue thickness was measured as the distance between the posterior echogenic border of the dermis and the anterior echogenic border of the muscular fascia. When the dermo-hypodermal junction or the muscular fascia was not clearly identified, measurements were not performed, and it was classified as a “blurred border.”
Subcutaneous echogenicity
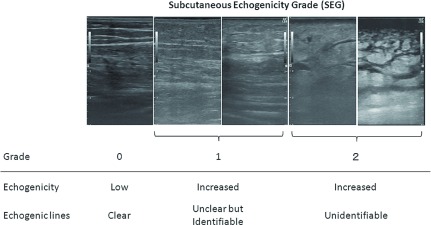
At each scan point, the subcutaneous echogenicity was evaluated. Full thickness subcutaneous hyperechogenicity of any degree was defined as “increased echogenicity.” In the current study, a mild increase of echogenicity limited to the area above the muscular fascia was not regarded as “increased echogenicity.” The subcutaneous echogenicity grade (SEG) was defined as follows (Fig. 1):
Fig. 1.
Definition of subcutaneous echogenicity grade (SEG).
Grade 0: No increase in echogenicity in the subcutaneous layer. Namely, the subcutaneous fat layer is observed as black.
Grade 1: Diffuse increase in echogenicity, but identifiable horizontal or obliquely oriented echogenic lines caused by connective tissue bundles.
Grade 2: Diffuse increase in echogenicity. Echogenic lines are not identifiable
Since the echogenicity is relative evaluation and is easily changed by controlling encoder of B-mode gain, this is first adjusted using normal subcutaneous fat in the other part of the body to be observed as black.
Statistical Analysis
Results are expressed as means standard deviation or counts, unless otherwise indicated. Spearman’s rank correlation was used to test the relationships between ISL stage and skin and subcutaneous tissue thickness or SEG. The Mann-Whitney U-test was used to compare skin and subcutaneous tissue thickness and SEG to determine the significance of differences among ISL stages at each scan point. The Kruskal-Wallis test was used to determine the significance of the differences in SEG between the scan points at each clinical stage, and the Mann-Whitney U-test was used for multiple comparisons. These analyses were not performed for skin and subcutaneous tissue thickness because the parameters differed at different sites along the extremity, when they were measured using high-frequency ultrasound.4) Statistical analyses were performed using Dr. SPSS II software (IBM, Armonk, New York, USA). A P value of less than .05 was considered significant.
Results
Correlation with ISL stage
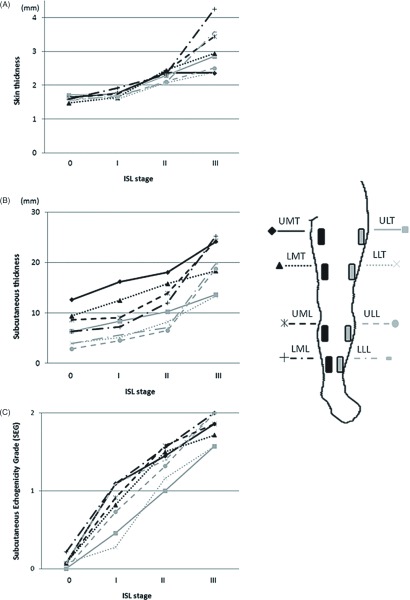
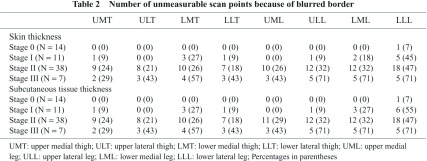
The skin thickness at 8 scan points according to ISL stage is presented in Fig. 2A. At each scan point, there was a significant positive correlation between skin thickness and ISL stage. No increase in skin thickness was observed between Stage 0 and Stage I at any of the scan points. Between Stages I and II, skin thicknesses in the thigh lesions (except for ULT; i.e., UMT, LMT, and LLT) increased significantly. However, between Stages II and III, skin thickness in the leg lesion (except for ULL; i.e., UML, LML, and LLL) increased. Delineations of the boundary at the dermo-hypodermal junction were poorer for lower scan points and higher ISL stages (Table 2). Particularly in ISL Stage III, the measurement of skin thickness was not feasible for 29% to 71% of the scan points.
Fig. 2.
(A) Relationship between skin thickness and the International Society of Lymphology (ISL) stage; (B) Relationship between subcutaneous tissue thickness and ISL stage; (C) Relationship between subcutaneous echogenicity grade (SEG) and ISL stage. UMT: upper medial thigh; ULT: upper lateral thigh; LMT: lower medial thigh; LLT: lower lateral thigh; UML: upper medial leg; ULL: upper lateral leg; LML: lower medial leg; LLL: lower lateral leg
The changes in subcutaneous tissue thickness according to ISL stage at the 8 scan points is depicted in Fig. 2B. At each point, there was a significant positive correlation between subcutaneous tissue thickness and ISL stage. Significant increases in subcutaneous tissue thickness in all thigh lesions (UMT, ULT, LMT, and LLT) were observed between Stage 0 and Stage I. These increases in the subcutaneous tissues in thigh lesions were accompanied by little or no echo-free space (EFS); i.e., these changes were not accompanied by severe edema. Significant increases in subcutaneous tissue thickness were not observed between Stages I and II but were observed in the entire leg, except for the lateral thigh (UMT, LMT, UML, ULL, LML, and LLL) between Stages II and III. These increases in subcutaneous tissue thicknesses were accompanied by a significant amount of EFS (evident edema). As with the skin, the delineation of boundaries at the dermo-hypodermal junction and upper boundary of muscular fascia were poorer for lower scan points and higher ISL stages (Table 2). In ISL Stage III, measurement of subcutaneous tissue thickness was, therefore, not feasible at 29% to 71% of scan points.
The changes in SEG at 8 scan points with respect to ISL stage is depicted in Fig. 2C. At each point, there was a significant positive correlation between SEG and ISL stage. As we were comparing changes in skin and subcutaneous tissue thickness, the SEG at each scan point changed in a more linear manner with respect to the progression in ISL stage. In all leg lesions, SEG increased between Stages 0 and I and Stages I and II. Between Stages II and III, SEG did not increase in the lower thigh (LMT, LLT) and UML but increased significantly at the other scan points. For ISL Stages I and II, SEG was lower in the lateral thigh (ULT and LLT). This was also observed in Stage III, although this was not significant. In contrast to skin and the subcutaneous tissue, this finding was properly assessed at all scan points.
Diagnostic Value
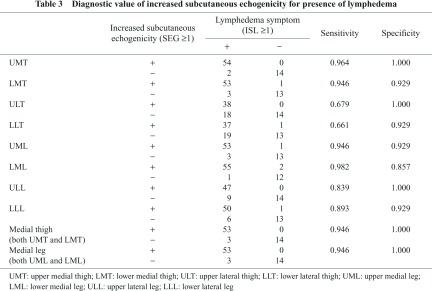
In Table 3, the presence of increased SEG (≥1) was correlated with the presence of lymphedema in the extremity. In UM) and LML, the sensitivity of this finding was greater than 95%. In UMT, ULT, and ULL, the specificity of this finding was greater than 95%. When this finding is assessed in a wider area, i.e., the entire medial thigh (UMT + LMT) or entire medial leg (UML + LML), the specificity was 100%.
Discussion
There were 4 major findings in the current study. First, skin thickness, subcutaneous tissue thickness, and subcutaneous echogenicity were all positively correlated with ISL stage. Second, measurements of skin and subcutaneous tissue thicknesses were not feasible at a large number of scan points because of poor delineation particularly in the legs with severe symptoms. Third, subcutaneous echogenicity could be consistently assessed and was linearly correlated with ISL stage. Fourth, lymphedema could be diagnosed or excluded using this finding, particularly when this finding is assessed in broader areas of the leg.
Skin Thickness
Increased skin thickness in the extremity with lymphedema has been reported in previous studies.3,4,9,10) Morphologically, as lymphedema progresses, the dermis becomes thicker, cones of tissue extend both toward the surface and into the subcutaneous tissue because of the increased number of fibers.2) The skin may be further thickened by an increase in the subepidermal low-echogenic band as a result of edema.11) Mellor, et al. reported a significant increase in skin and subcutis thickness in the upper arm with lymphedema compared with those in the contralateral normal arm.3) They also demonstrated that skin thickness correlated positively with subcutaneous tissue thickness and arm circumference in the ipsilateral arm using 7- and 20-MHz ultrasound. Naouri, et al. reported increased dermal thickness in legs with lymphedema compared with normal legs.4) This difference was not observed when legs with lipedema were compared with normal legs. In the current study, skin thickness increased with progressive ISL stages. Particularly in Stage III, the skin thickness in the medial leg and the lower lateral leg were markedly increased.
Measurement of skin thickness involved some challenges. The first questionable issue was the accuracy of the value. The thickness of the epidermal entrance echo does not correlate with the thickness of the epidermis.8) Special transducers such as 50–100-MHz transducers may be necessary to study the epidermal layer. Although there appeared to be a clear delineation of the skin, the accuracy of skin thickness measurements using a low resolution of 20 MHz or less was suboptimal. A second difficulty was the low rate of successful measurements. As demonstrated in this study, the measurement could not be performed at a large number of scan points because of poor delineation of the dermo-hypodermal junction. Blurring of this border inevitably occurred as lymphedema progressed, and; therefore, this low rate could not be improved by the use of high-resolution ultrasound. A third problem was the reproducibility of the measurements; this delicate measurement could not be repeatedly performed at exactly the same point or at an identical point of the right and left extremities. Considering these issues, skin thickness—particularly measured using low resolution ultrasound—may not be a good parameter to determine the status of the disease.
Subcutaneous Tissue Thickness
In contrast to the skin, the widely available 7–12-MHz transducers are adequate for examining subcutaneous tissues. Increased thickness of subcutaneous fat in limbs with lymphedema is also reported in limbs with lymphedema.3) In the current study, a significant positive correlation was observed between the subcutaneous tissue thickness and ISL stage. Interestingly, the increase in subcutaneous tissue thickness in the thigh that was seen in early stages was not accompanied by significant edema, but the increases in the medial thigh and the leg at later stages was complicated by marked increases in echo-free space (i.e., edema). Significant increases in subcutaneous thicknesses were not observed between Stages I and II, but this was possibly the result of large fluctuations in the amount of edema.
Measurements of subcutaneous tissue thickness also involve difficulties. As for the skin, the measurement could not be performed at several scan points because of poor delineation of the dermo-hypodermal junction or the muscular fascia. Blurring of these borders is caused by the increase in fiber content that inevitably occurs in the course of disease progression. Moreover, the value itself has no diagnostic importance because the subcutaneous tissue thickness is largely different depending on the scanning point, as well as the amount of edema, fat, and other factors. It is impractical to constantly align the dermo-hypodermal junction and the muscular fascia in parallel and to perform the measurement repeatedly at exactly the same point. Therefore, the subcutaneous tissue thickness again may not be an appropriate parameter to determine the status of the disease.
Subcutaneous Echogenicity
Increased echogenicity of the fat with blurring of the interface between the subcutaneous fat and the skin was previously reported in extremity lymphedema,4,5) but this is not a finding specific to lymphedema because is seen in various inflammatory conditions such as cellulitis.12) The histological characteristics of the extracellular matrix in chronic lymphedema are similar to those of chronic inflammation.2) Therefore, the application of typical US findings in the inflammation, such as increased echogenicity of the subcutaneous fat, to evaluate extremity lymphedema would be appropriate. The finding is readily obtained even with low-resolution ultrasound, and this can be observed in any part of the extremity in any condition, which is most practical for most physicians.
In the present study, SEG showed good correlation with the ISL stage at all scan points in the lower extremity. These changes were relatively linear compared with the changes in skin and subcutaneous tissue thickness. SEG increased significantly between Stages 0 and I in most parts of the leg, as well as between Stages I and II. In Stages I and II, SEG was lower in lateral thigh lesions possibly because lymph congestion originates from the ventromedial bundle in secondary leg lymphedema and protein-rich interstitial fluid accumulates from around this bundle and in the lower leg by gravity. Medial and lower parts of the extremity are affected first, and the lateral thigh lesion is relatively preserved from skin and subcutaneous inflammation until a later stage. Particularly in the early stage of the disease, the increase in subcutaneous echogenicity was accompanied by increased subcutaneous tissue thickness in the medial thigh lesion, but this was not the case in the medial leg lesion. Similar cases are often encountered in the clinic, in which patients complain that their symptoms began in the inner thigh lesion, but the inner leg lesion is already affected when the lesion is assessed using ultrasound. In secondary lymphedema, the lymphatic system has been reported to deteriorate from the proximal side to its distal portion due to surgery or irradiation for the oncological treatment.13,14) Therefore, the manifestation of lymphedema may not simply be related to the lymphatic damage but also related to the other factors such as gravity. This aspect needs to be elucidated in future studies.
Subcutaneous echogenicity and its distribution have been shown to greatly contribute to the diagnosis of lymphedema. As described above, increased echogenicity itself is a non-specific demonstration of inflammation. Considering the characteristic distribution (affected medial thigh and leg and unaffected lateral thigh, particularly in earlier stages), and given a patient’s past history of cancer treatment, the diagnosis of secondary lymphedema may become more likely. More importantly, because the increased subcutaneous echogenicity can be observed from an early stage, the absence of this finding in any part of the leg may be a strong reason to exclude the presence of lymphedema.
The finding of increased subcutaneous echogenicity also has potential pitfalls. First, our SEG is not supported by any pathological basis but was simply defined by empirical facts and, therefore, it might not hold validity. In the present study, a mild increase of echogenicity limited to the area above the muscular fascia was excluded; however, this might be an early presentation of lymphedema. At present, there is no means by which this can be clarified. Second, SEG cannot be used to exclude the effect of fat accumulation. Abnormal fat accumulation is seen in extremities with lymphedema.2) However, obesity itself impedes lymphatic flow, which leads to the collection of protein-rich extra-cellular fluid in the subcutaneous tissue and subsequent fibrosis mimicking lymphedema.15) Fat layers in obese subjects often show increased echogenicity, which is often difficult to differentiate from that observed in patients with lymphedema. Extremely obese people, with a body mass index >59 have been reported to present with true lymphedema without any particular cause.16) Presently, there is no means to clearly differentiate normal fat accumulation from pathological fat accumulation. Last, SEG cannot exclude effects of possible presence of functional venous insufficiency caused by lymphedema.17) Patients with lower extremity lymphedema show impaired ambulation. This affects venous pump function and in severe cases, can lead to chronic venous insufficiency, which also causes inflammation and edema. Because there is no particular measure to diagnose this functional venous insufficiency at present, we cannot differentiate the impact of this factor.
Conclusion
In the present study, we demonstrated 3 typical ultrasound findings in extremities with lymphedema, namely, increased skin thickness, increased subcutaneous tissue thickness, and increased subcutaneous echogenicity. All 3 findings correlated well with the ISL stage. However, from a practical point of view, subcutaneous echogenicity is considered the most valuable finding because it may be successfully assessed in any part of the extremity at any stage, and it is linearly correlated with ISL stage when expressed as subcutaneous echogenicity grade. This finding may thus have great diagnostic value.
Acknowledgement
The authors gratefully thank Dr Takako Hamamoto (Tokyo Vascular Clinic, Tokyo, Japan) for her suggestions and encouragements.
Disclosure Statement
There are no conflicts of interest to declare.
References
- 2009 Consensus Document of the International Society of Lymphology. The diagnosis and treatment of peripheral lymphedema. Lymphology 2009; 42: 51-60. [PubMed] [Google Scholar]
- Földi M, Földi E. Földi’s Textbook of Lymphology for physicians and lymphedema therapists, 3rd edition Amsterdam, Elsevier, 2011. [Google Scholar]
- Mellor RH, Bush NL, Stanton AW, et al. Dual-frequency ultrasound examination of skin and subcutis thickness in breast cancer-related lymphedema. Breast J 2004; 10: 496-503. [DOI] [PubMed] [Google Scholar]
- Naouri M, Samimi M, Atlan M, et al. High-resolution cutaneous ultrasonography to differentiate lipoedema from lymphoedema. Br J Dermatol 2010; 163: 296-301. [DOI] [PubMed] [Google Scholar]
- Balzarini A, Milella M, Civelli E, et al. Ultrasonography of arm edema after axillary dissection for breast cancer: A preliminary study. Lymphology 2001; 34: 152-5. [PubMed] [Google Scholar]
- Szuba A, Shin WS, Strauss HW, et al. The third circulation: Radionuclide lymphoscintigraphy in the evaluation of lymphedema. J Nucl Med 2003; 44: 43-57. [PubMed] [Google Scholar]
- Burnand KM, Glass DM, Mortimer PS, et al. Lymphatic dysfunction in the apparently clinically normal contralateral limbs of patients with unilateral lower limb swelling. Clin Nucl Med 2012; 37: 9-13. [DOI] [PubMed] [Google Scholar]
- Jemec GBE, Gniadecka M, Ulrich J. Ultrasound in dermatology. Part I. High frequency ultrasound. Eur J Dermatol 2000; 10: 492-7. [PubMed] [Google Scholar]
- Doldi SB, Lattuada E, Zappa MA, et al. Ultrasonography of extremity lymphedema. Lymphology 1992; 25: 129-33. [PubMed] [Google Scholar]
- van der Veen P, Vermeiren K, Von Kemp K, et al. A key to understanding postoperative lymphoedema: A study on the evolution and consistency of oedema of the arm using ultrasound imaging. Breast 2001; 10: 225-30. [DOI] [PubMed] [Google Scholar]
- Gniadecka M. Localization of dermal edema in lipodermatosclerosis, lymphedema, and cardiac insufficiency. High-frequency ultrasound examination of intradermal echogenicity. J Am Acad Dermatol 1996; 35: 37-41. [DOI] [PubMed] [Google Scholar]
- Fornage BD. Sonography of the skin and subcutaneous tissues. Radiol Med 1993; 85(5 Suppl 1): 149-55. [PubMed] [Google Scholar]
- Koshima I, Kawada S, Moriguchi T, et al. Ultrastructural observations of lymphatic vessels in lymphedema in human extremities. Plast Reconstr Surg 1996; 97: 397-405; discussion 406-7. [DOI] [PubMed] [Google Scholar]
- Yamamoto T, Narushima M, Doi K, et al. Characteristic indocyanine green lymphography findings in lower extremity lymphedema: The generation of a novel lymphedema severity staging system using dermal backflow patterns. Plast Reconstr Surg 2011; 127: 1979-86. [DOI] [PubMed] [Google Scholar]
- Yosipovitch G, DeVore A, Dawn A. Obesity and the skin: Skin physiology and skin manifestations of obesity. J Am Acad Dermatol 2007; 56: 901-16; quiz 917-20. [DOI] [PubMed] [Google Scholar]
- Greene AK, Grant FD, Slavin SA. Lower-extremity lymphedema and elevated body-mass index. N Engl J Med 2012; 366: 2136-7. [DOI] [PubMed] [Google Scholar]
- Suehiro K, Furutani A, Morikage N, et al. Routine diagnostic venous ultrasound and LAS for leg edema of unknown cause. Ann Vasc Dis 2010; 3: 222-7. [DOI] [PMC free article] [PubMed] [Google Scholar]


