Abstract
The analysis of natural images with independent component analysis (ICA) yields localized bandpass Gabor-type filters similar to receptive fields of simple cells in visual cortex. We applied ICA on a subset of patches called position-centered patches, selected for forming a translation-invariant representation of small patches. The resulting filters were qualitatively different in two respects. One novel feature was the emergence of filters we call double-Gabor filters. In contrast to Gabor functions that are modulated in one direction, double-Gabor filters are sinusoidally modulated in two orthogonal directions. In addition the filters were more extended in space and frequency compared to standard ICA filters and better matched the distribution in experimental recordings from neurons in primary visual cortex. We further found a dual role for double-Gabor filters as edge and texture detectors, which could have engineering applications.
1 Introduction
Neurons in the early visual areas may reduce redundancy in natural images by generating neural responses that are statistically independent (Barlow, 1961; Simoncelli & Olshausen, 2001). Consistent with this principle, independent component analysis (ICA) of natural images (Jutten & Hérault, 1991; Comon, 1994; Bell & Sejnowski, 1995, 1997; Hyvarinen, Karhunen, & Oja, 2001) yields localized bandpass filters that match qualitatively with the properties of simple cells in V1 (Olshausen & Field, 1996, 1997). Therefore one possible function of simple cells in V1 is to reduce the redundancy of natural images. Higher in the hierarchy of visual processing, neurons respond more and more invariantly to translation, rotation, and scaling, while responding to more complex features of inputs.
Here we focus on translation. Our goal is find a translation-invariant representation of the inputs, and the filters that capture their translation-invariant features. We apply ICA on a subset of patches, forming a translation-invariant representation of small patches. This is formulated by defining the equivalence class of translation—a set obtained by translating a patch by all possible translations. We call these patches position-centered because the intensity-weighted sum of pixel locations is at the center of the patch. Patches that are not in the same equivalence class cannot be mapped to each other by any translation. The position-centered patches are too small to represent objects and are more tuned to texture features.
Our main result is the emergence of a new class of filters that we call double-Gabor filters, characterized by their signature modulation in two directions, in addition to Gabor filters, which are much more extended in both space and spatial frequency compared to the standard ICA results, close to the distribution found in populations of V1 cells.
2 Position-Centered Patches
Our patch selection is based on defining an equivalence class of translation for an image patch, a set obtained by jointly translating the pixels in the patch by all possible translations. Different elements in this set would correspond to different translation vectors. The basic idea is to pick a representative patch in the equivalence class and perform ICA on the ensemble of those representative patches. The learning algorithm thus picks up the translation-invariant features of the inputs. The translation of patches is done on a torus, that is, modulo the image patch sizes. Therefore, the pixel (R1, R2), where Ri is the coordinate along the direction i, translated by T = (T1, T2), is moved to . Here, a1 and a2 are the patch size along the two directions. As an example, some elements of the equivalence class of translation for a cartoon patch are shown in Figure 1.
Figure 1.
The equivalence class of translation for a cartoon patch. The position-centered representative patch is shown on the left.
The next step is to define a measure for an image patch that would characterize where most of the intensity in the patch is located. This measure would give us a systematic way to pick the representative image patch from the equivalence class of translation. The simplest measure that takes into account the intensity of an image patch for all pixels is given by
| (2.1) |
where ℐ(R) is the intensity of the image patch at location R. We call ℛ the center of intensity, named after the center of mass in physics.
We take R = 0 to be the center of the patch. ℛ = 0 patches are therefore called position-centered. Of course, for a finite patch, ℛ = 0 is highly unlikely. We therefore relax the definition of a position-centered patch to |ℛ| < ε, where ε is some small number in units of a pixel.
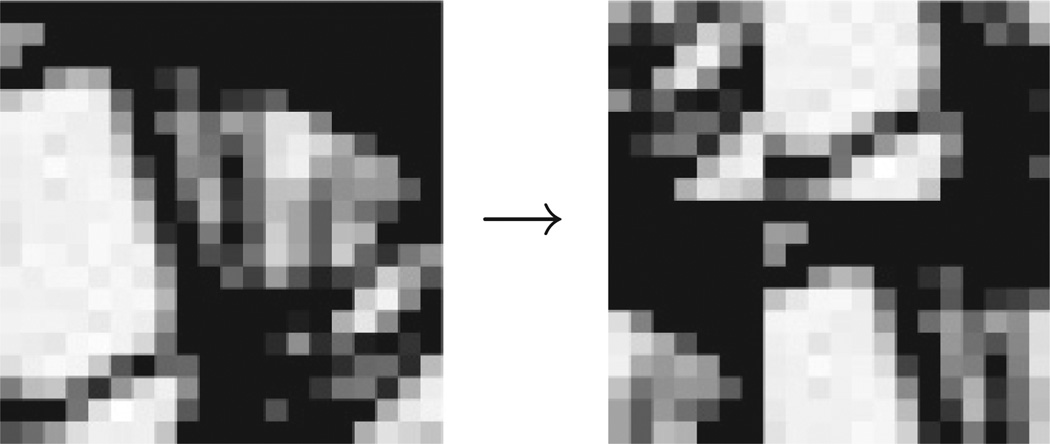
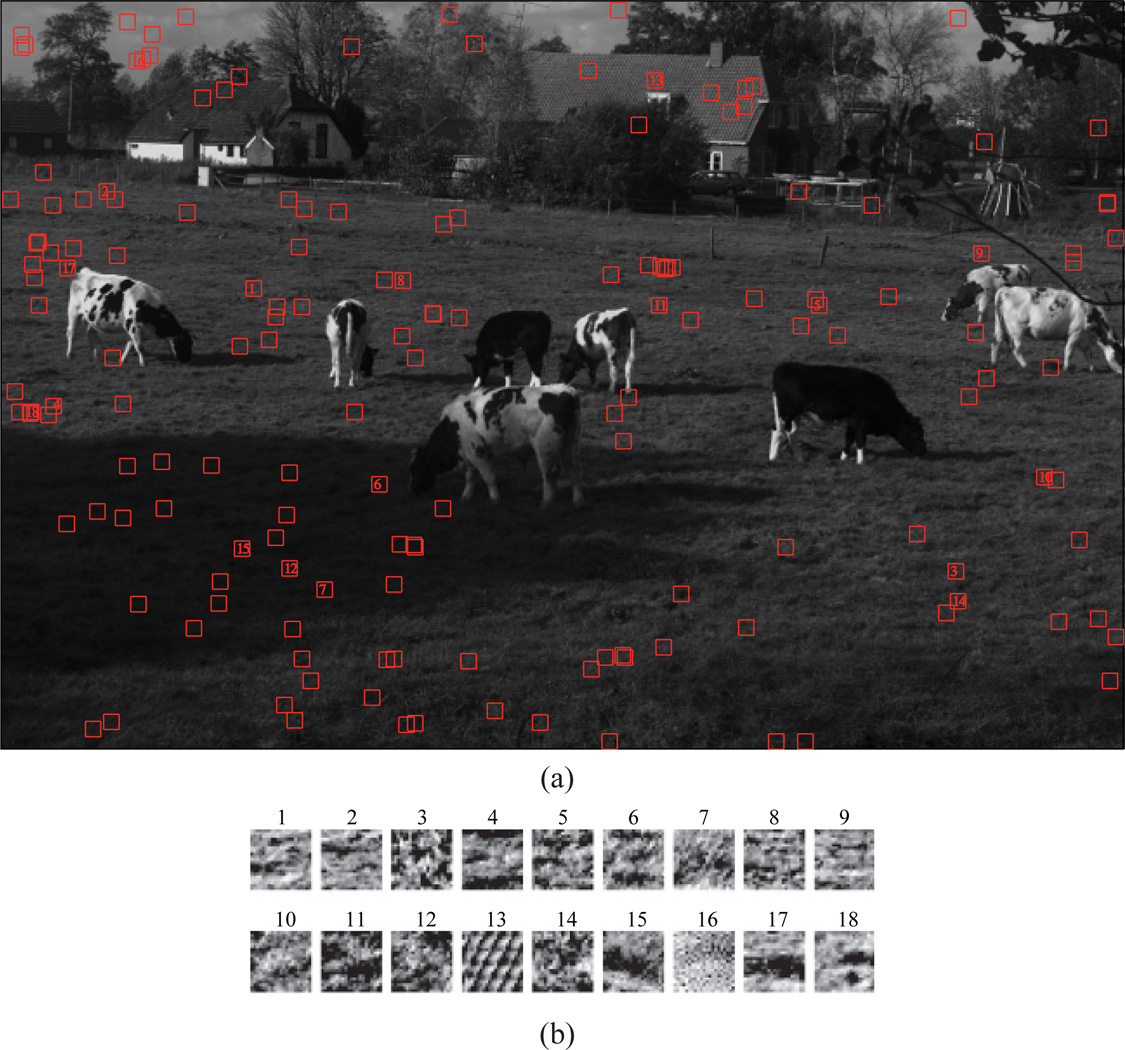
Position-centered patches cannot be mapped into each other by any translation, thus forming a translation-invariant representation of small patches. In this way, ICA learns features of the translation-invariant representation of inputs. However, centering a patch by the translation defined above might create an edge effect; an example is given in Figure 2. One way to avoid an edge effect is to enlarge the patch and find a way to smooth out the edges in the large patch. However, ICA would slow dramatically for very large patches. Instead, we searched (at random) for patches that were already position centered and thus created an ensemble of position-centered patches that were free of edge effects. An example of some of the position-centered patches found randomly is given in Figure 3. In the next section, we outline the ICA results on position-centered patches selected at random from the van Hateren database of natural images (van Hateren & van der Schaaf, 1998).
Figure 2.
Edge effects from centering a patch. The left patch is not position-centered, but the right one is after translation on a torus. Edge effects are created since the translation is defined modulo the patch sizes.
Figure 3.
(a) Example of position-centered 21 × 21 patches, randomly selected by sampling 104 patches, for an image in van Hateren database of natural images. The database consists of 4167 images, 1024 × 1536 pixels in size, ranging from 0 to 32,767 in pixel intensity. The position-centered patches are selected with the criterion |ℛ| < 0.05 in units of a pixel. A property of position-centered patches in the display here is that they are more tuned to texture features, mostly selecting patches from the grass and patches from sky and the roof despite being a small portion of the image, and avoiding the cows in this image. (b) Labeled patches in panel a are shown in isolation with their corresponding labels. The color map is from the minimum to the maximum of each patch separately.
3 Results: Translation-Invariant ICA filters
ICA is an unsupervised learning method with the goal of finding linear filters that make the linearly transformed inputs independent, thus removing correlations in all orders (Bell & Sejnowski, 1995). Early sensory areas could employ an ICA-type principle in transforming their inputs as a nonredundant representation is more more efficient use of the brain’s energy resources (Barlow, 1961, 1989).
The input vector is denoted by a vector of rank n, xT = [x1, x2, …, xn], and the linearly transformed output is given by y = WTx. The matrix W can be written by its rank n columns wi as W = [w1 w2 … wm], where m is the rank of the output vector y. For simplicity we assume the outputs to be the same size as the inputs, m = n. The goal of the ICA is to learn W that makes independent of yj for i ≠ j: , where p is any positive integer, δ is the Kronecker delta function, and 〈 〉 denotes the statistical average over the input ensemble. This can be achieved by demanding
| (3.1) |
where I is the identity matrix and f is a strongly nonlinear function. The appropriate f depends on the probability distribution of inputs, but it is always sigmoid-like (Bell & Sejnowski, 1995; Laughlin, 1981).
The infomax ICA achieves independence (see equation 3.1) by the gradient ascent, looking for saddle points ΔW = 0 by updating W (Amari, Cichocki, & Yang, 1996):
| (3.2) |
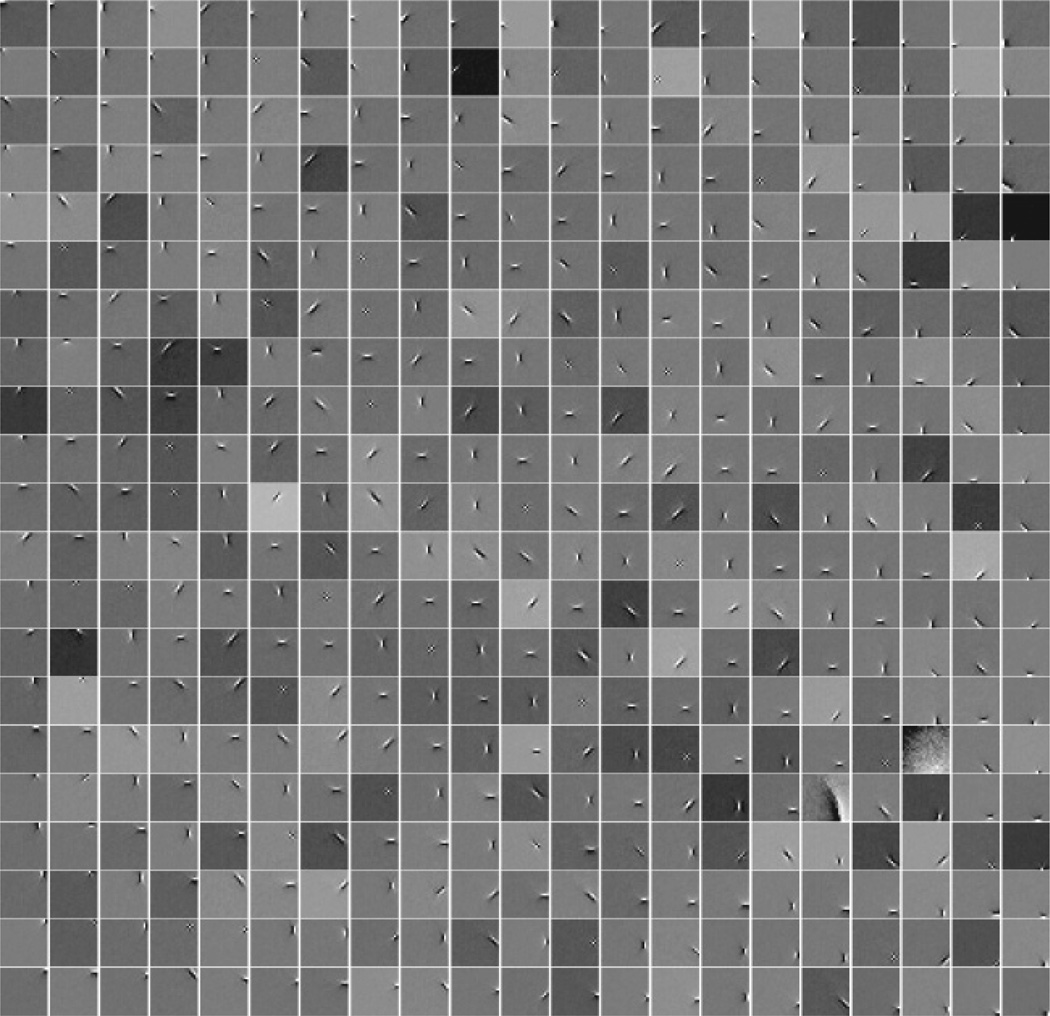
where η is the learning rate. This method applied on 21 × 21 patches from the van Hateren database of natural images (van Hateren & van der Schaaf, 1998) yields the filters shown in Figure 4. To speed up the learning, infomax ICA is usually applied on whitened data, in which the second-order correlations are removed. The linear transformation applied in whitening the data can be easily reversed. In practice, the filters learned on whitened data and the ones transformed by the inverse transformation are very similar, indicative of the importance of higher-order correlations in capturing the statistics of the data. We also checked the robustness of the ICA results from position-centered patches by applying a gaussian low-pass filter on the inputs. The filter was constructed by Matlab’s routine fspecial (‘gaussian’), with the default window of 3 × 3 and σ = 0.5. In practice, the true independence is only partially achieved for natural signals (Simoncelli & Olshausen, 2001). We chose f to be the logistic function f (y) = 1/(1 + exp(−y)), which is related to tanh, the conventional choice in the literature, through the relation tanh(y) = −1 + 2f(2y). ICA results are robust to this choice since the constant −1 drops out in averaging preprocessed signals with 〈y〉 = 0. To quantify this, denote δW as the the difference between two consecutive W after a 106 iteration process and dW = Wtanh − W as the difference between converged ICA filters for the two nonlinearities. In the conventional ICA applied on random patches, std(δW) = 0.0075, std(dW) = 0.0076, which demonstrates the equivalence of the two nonlinearities as far as converged W is concerned.
Figure 4.
Conventional ICA results found by applying the infomax ICA algorithm on 21 × 21 patches taken from van Hateren’s database of natural images.
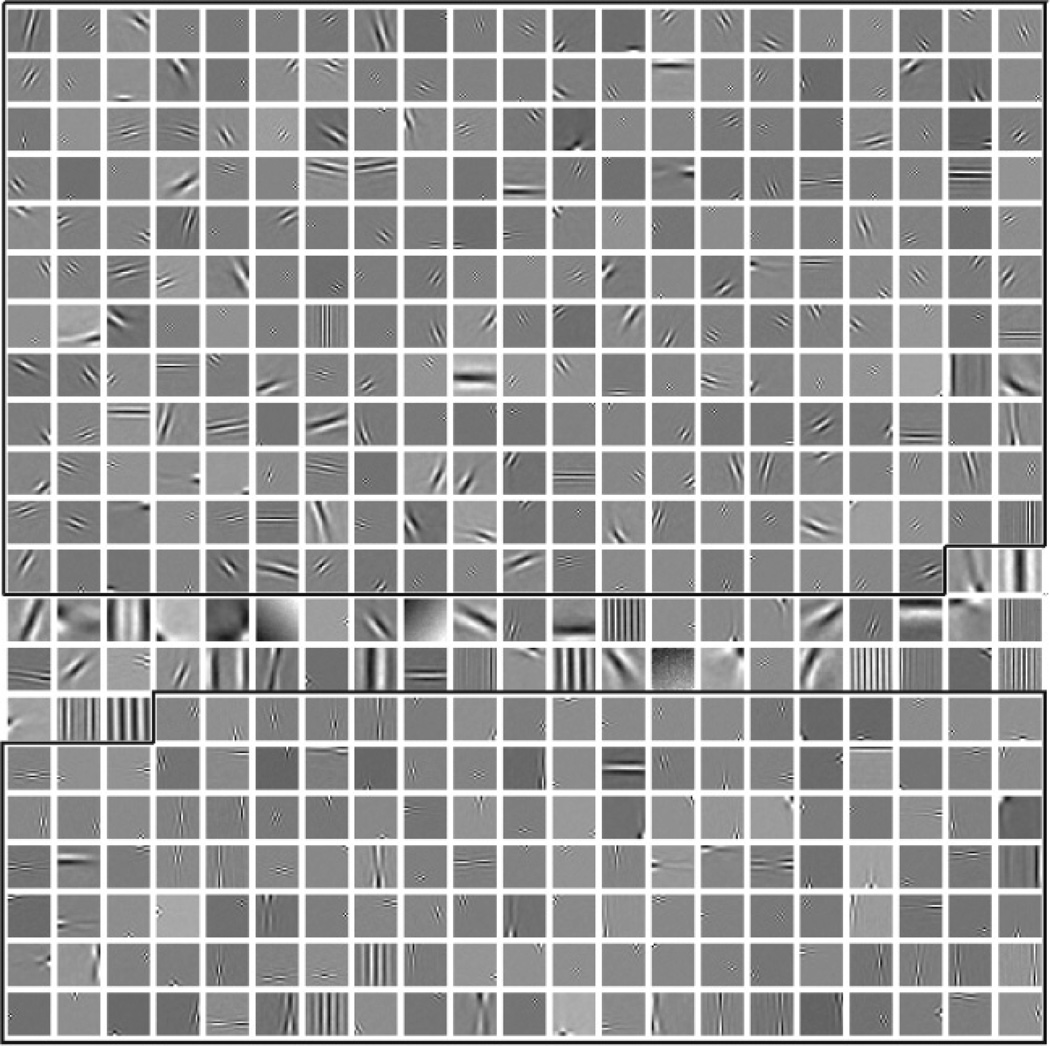
To find the translation-invariant features of inputs, we apply the infomax algorithm on the ensemble of position-centered patches. They are given in Figure 5. In this case, std(δW) = 0.0060, std(dW) = 0.0058. In the next section, we elaborate on the qualitative differences and the emergence of new types of filters compared to conventional ICA results.
Figure 5.
ICA filters trained on 21 × 21 position-centered patches from van Hateren’s database of natural images. Our criterion for a position-centered patch here was |ℛ| < 0.05 in units of a pixel. There were more than 2.8 × 10⁶ patches in our training set. The filters are separated into three groups: the upper box contains filters that are better fit with a Gabor filter, the bottom box contains double-Gabor filters, and the ones in the middle did not satisfy the criterion of adjusted coefficient of determination R2 greater than 0.98 (see Figure 10).
4 Emergence of Double-Gabor Filters
As is well known, the independent features of natural images are localized bandpass filters (Bell & Sejnowski, 1997) and are well characterized by Gabor functions:
| (4.1) |
| (4.2) |
| (4.3) |
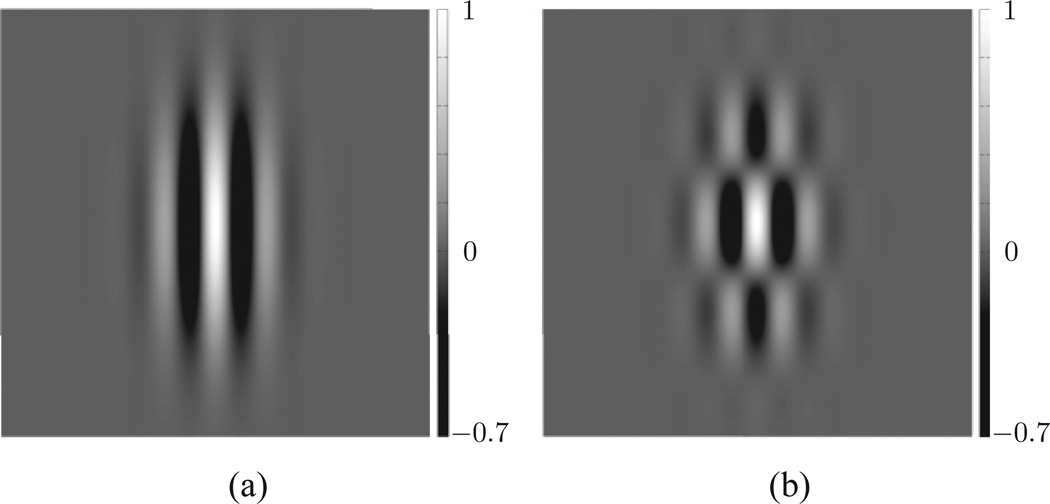
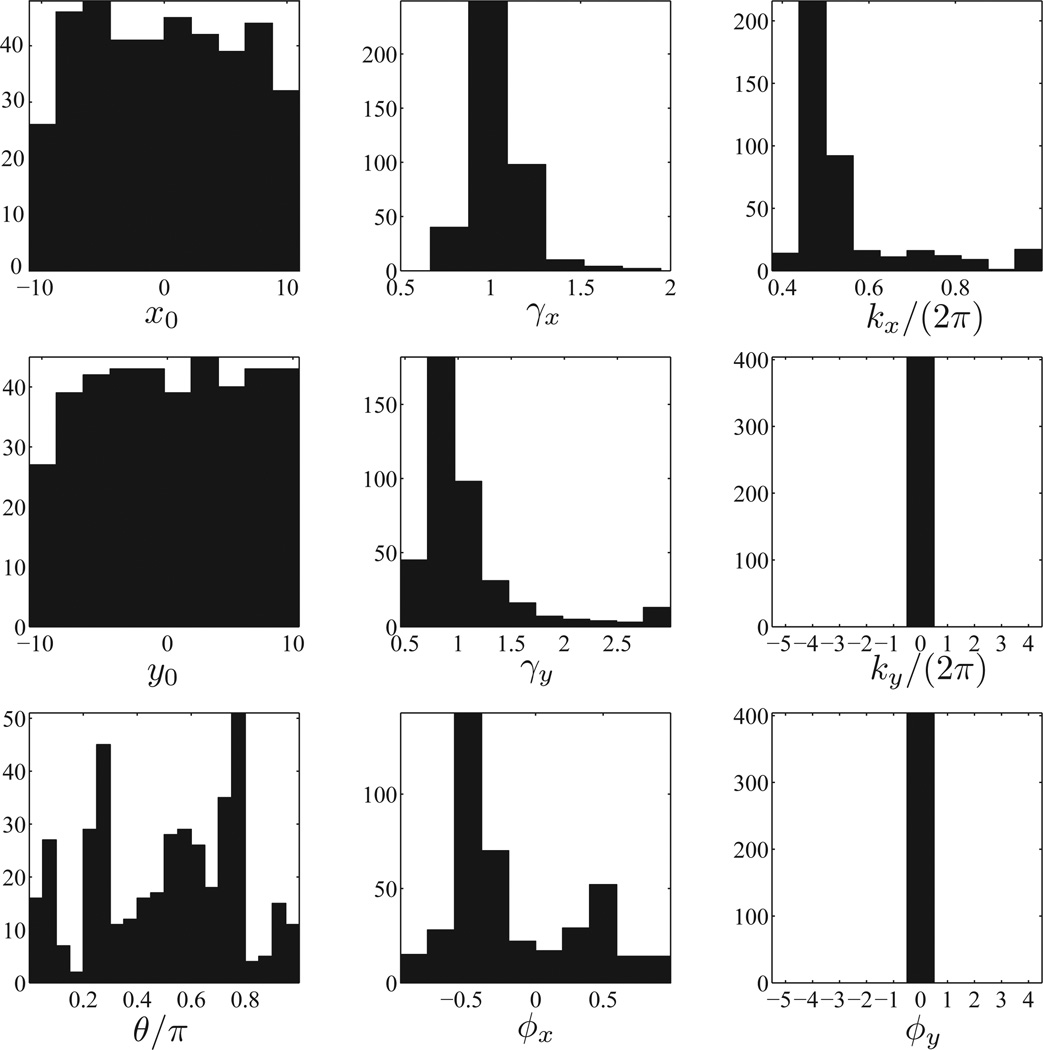
where θ is the orientation of the axis x′, y′ compared to x, y; 1/γx, 1/γy is a measure for the extension of the localization and x0, y0 its location. The parameters kx and ϕx give the wave vector (spatial frequency) and the phase of sinusoidal modulation, and A is the normalization factor. An example of a Gabor function is given in Figure 9a. We fit the ICA results of Figure 4 with the Gabor functions and find the histogram of Gabor parameters obtained by the fit. The results are given in Figure 8. The filters are localized in space with γx and γy close to 1. In addition, most filters have spatial-frequency kx close to 1/2.
Figure 9.
(a) An example of a Gabor function with parameters A = 1, γx = 0.6, γy = 0.3, kx = 0.4. (b) An example of a double-Gabor function with parameters A = 1, γx = 0.6, γy = 0.3, kx = 0.4, ky = 0.1. The parameters not indicated are all zero.
Figure 8.
Histogram of the Gabor parameters fit to the conventional ICA filters from Figure 4. Spatial frequency ky and phase ϕy are defined in equation 4.4. Gabor functions correspond to ky = ϕy = 0. We chose Gabor fits with an adjusted coefficient of determination R2 greater than 0.98; 404 filters satisfied that criterion.
ICA filters trained on position-centered patches can be categorized into two groups; examples are given in Figures 6 and 7. The examples in Figure 6 are fit by Gabor filters, noting that they are much more extended in both space and wavelength as compared to Figure 4. The second group, in Figure 7, however, cannot be fit by Gabor functions as they modulate in two directions. Since the two modulations appear orthogonal, we extend the definition of Gabor functions by multiplying them with another cosine in the perpendicular direction, thus adding two more parameters to the Gabor functions. We call this new class of functions double-Gabor functions:
| (4.4) |
where the definitions of x′ and y′ are the same as before (see equations 4.2 and 4.3). An example of a double-Gabor function is given in Figure 9b with a Gabor function.
Figure 6.

Examples of Gabor filters from ICA trained on position-centered patches. They are much more extended in space and wavelength than the conventional ICA results (see Figure 4).
Figure 7.

Examples of the double-Gabor filters from ICA trained on position-centered patches. Their signature is modulation in two perpendicular directions.
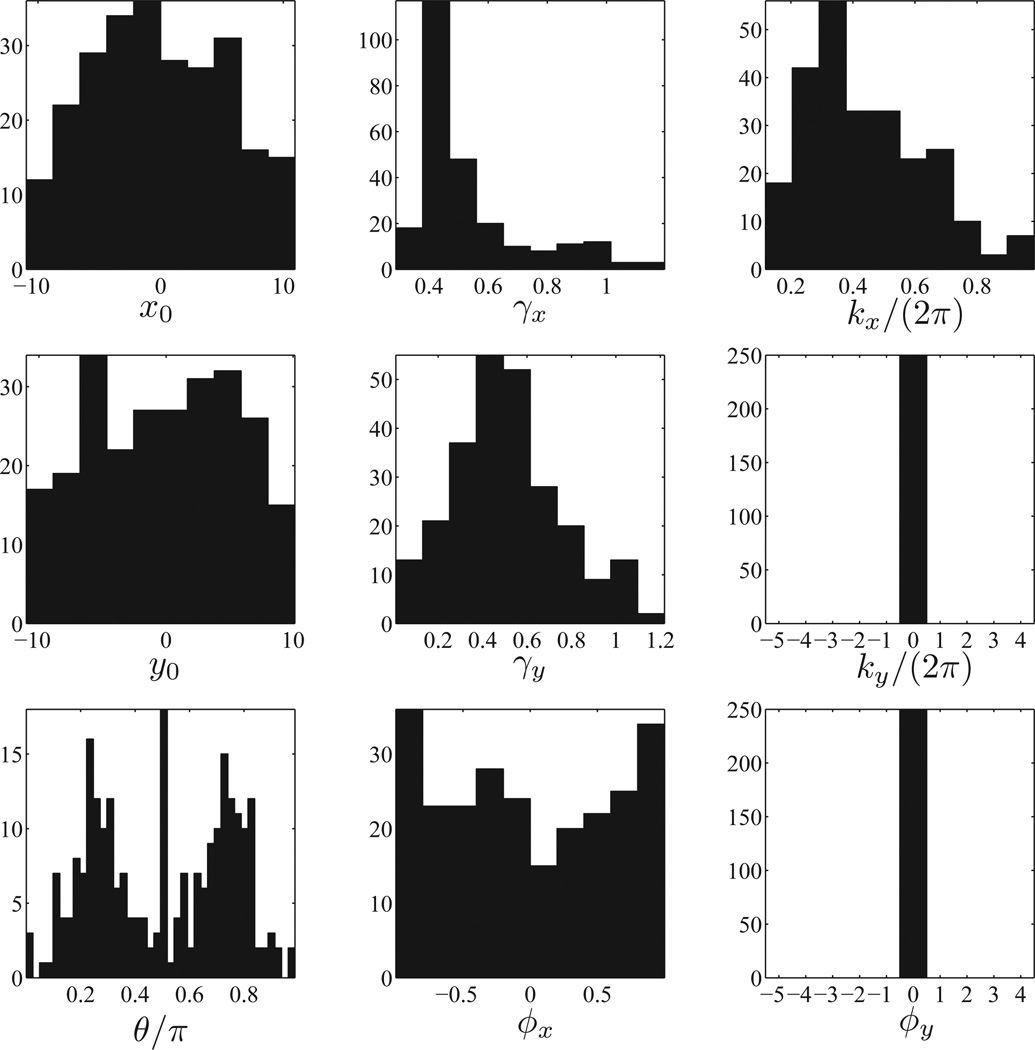
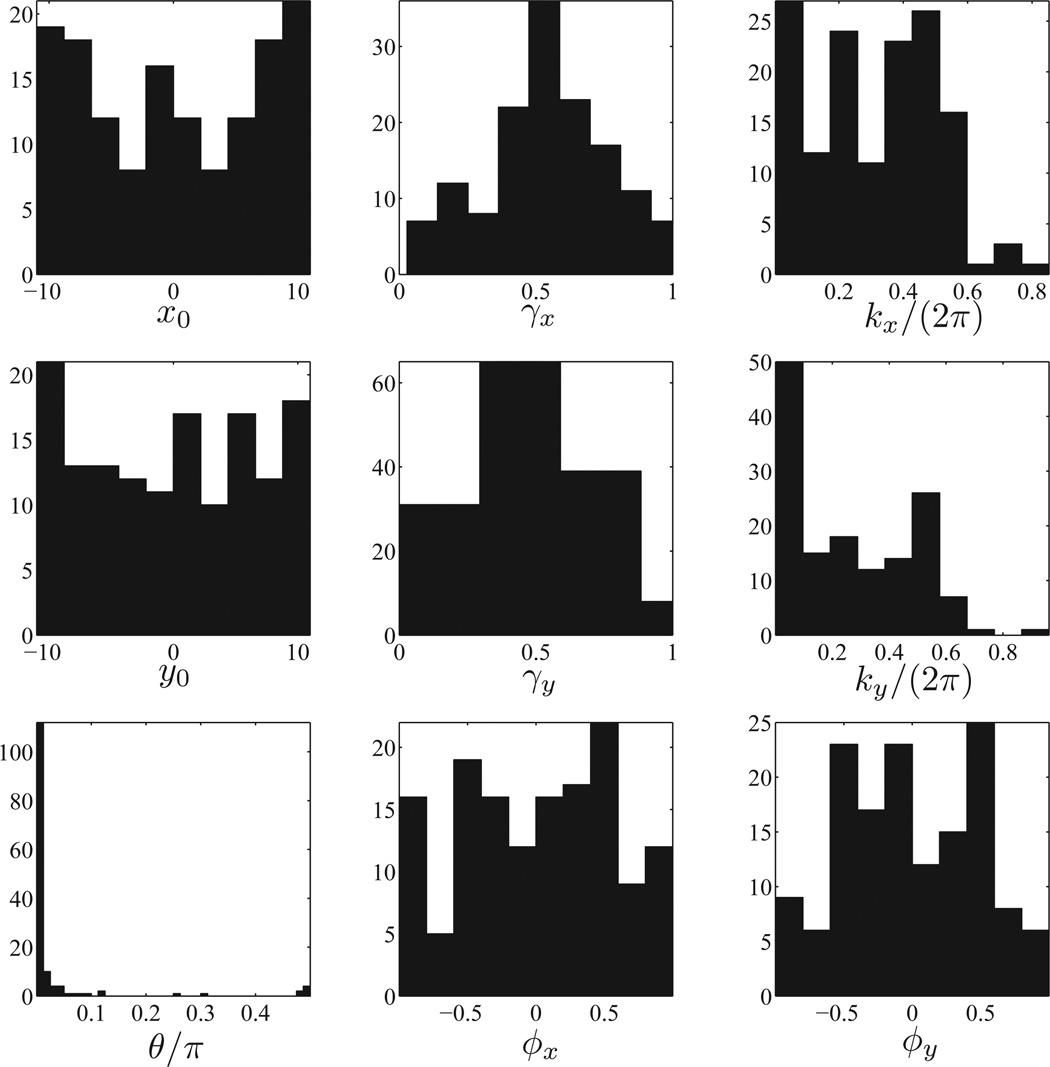
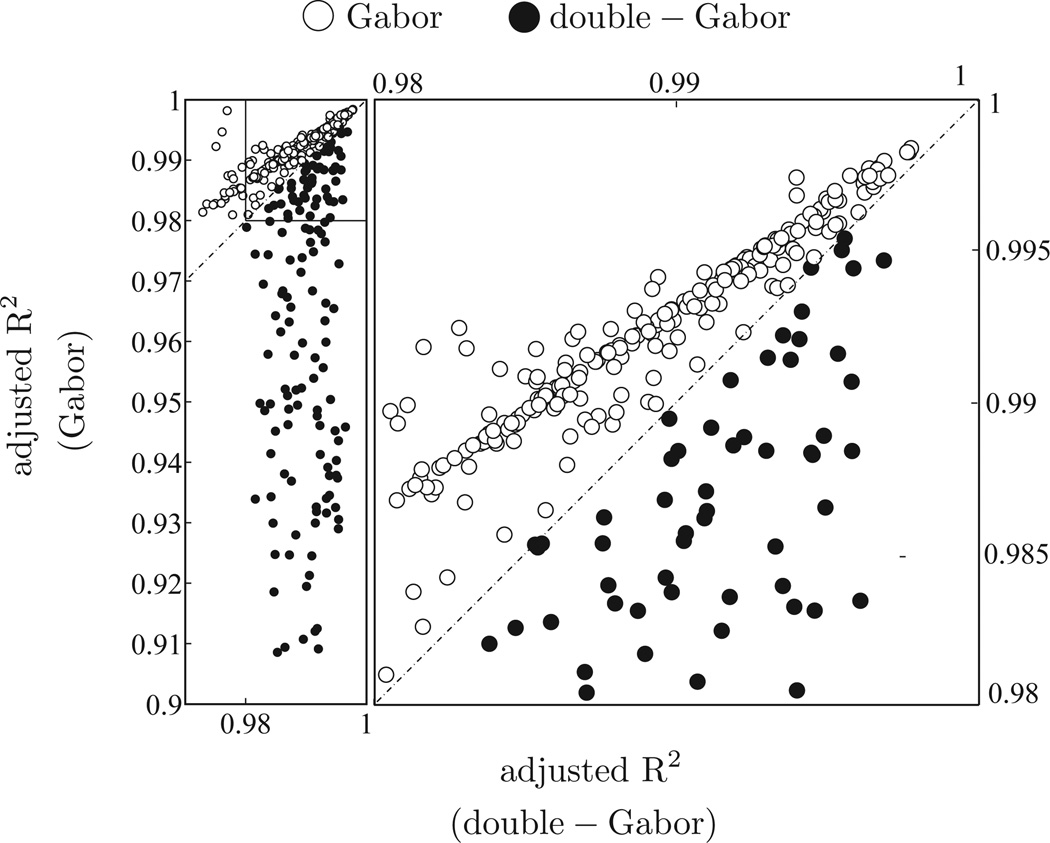
We then find the best fit for the ICA filters of Figure 5 to either Gabor or double-Gabor functions. The histograms for the parameters from fits to Gabor and double-Gabor filters are given in Figures 11 and 12 respectively. We chose fits with an adjusted coefficient of determination R2 bigger than 0.98, and our criterion for choosing between Gabor and double-Gabor filters was a better goodness-of-fit measure: 250 filters were fit by Gabor filters and 144 filters by double-Gabor filters. Figure 10 shows the decision boundary in the scatter plot of adjusted R2 for Gabor and double-Gabor filters. The double-Gabor filters close to the line could as well be classified as Gabor filters if the decision boundary were slightly shifted. However, there are many ICA filters significantly away from the line; the distinction between these double-Gabor and Gabor filters is preserved after low-pass-filtering the images. It may not be preserved for fits close to the decision boundary line, which are proportionally very few here.
Figure 11.
Histogram of the Gabor parameters for the ICA results of Figure 5. In this histogram, we have singled out filters in the Gabor class (ky = ϕy = 0), with some examples given in Figure 6.
Figure 12.
Histogram of the parameters for the ICA filters in the double-Gabor class. Examples of the filters in this category are given in Figure 7. Note that the distribution of wavelengths is shifted to lower frequencies compared to the case of Gabor filters.
Figure 10.
The scatter plot of goodness-of-fit measure, adjusted R2, for Gabor fits (y-axis) and double-Gabor fits (x-axis) found for the ICA filters of Figure 5. The inset is zoomed in on the right. The ICA components below the R2 Gabors = R2 double-Gabor dashed line (in filled circles) were labeled double-Gabor filters and the ones above the line (in empty circles) were labeled Gabor filters.
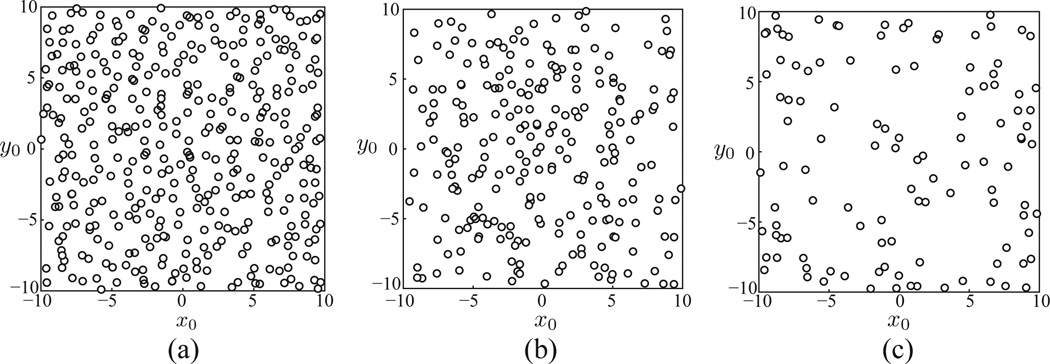
The qualitative change of the filters in the Gabor class is captured by the shift and spread of γx, γy, and kx to smaller values, and the emergence of double-Gabor filters is quantified by nonzero ky in the histogram of Figure 8. The ICA filters for random patches and for random position-centered patches cover the whole space. This is illustrated in Figure 13 by the scatter plot of (x0, y0) for Gabor and double-Gabor fits. Note that θ in double-Gabor filters is limited to [0, π/2) compared to Gabor filters, which is limited to [0, π). This is because double-Gabor filters are doubly more degenerate with respect to θ as compared to Gabor filters:
Figure 13.
(x0, y0) plot of Gabor and double-Gabor filter fits. As expected, the filter centers (x0, y0) uniformly cover the patch. (a) Gabor fits for ICA on random patches (b) Gabor fits for ICA on random position-centered patches. (c) Double-Gabor fits for ICA on random position-centered patches.
We should point out that the double-Gabor filters can be written as the sum of two Gabor filters due to this trigonometric identity:
| (4.5) |
However, we introduced double-Gabor filters as they form a special subclass of the filters obtained by adding two Gabor functions: they are characterized by their factorization into two sinusoidals in perpendicular directions.
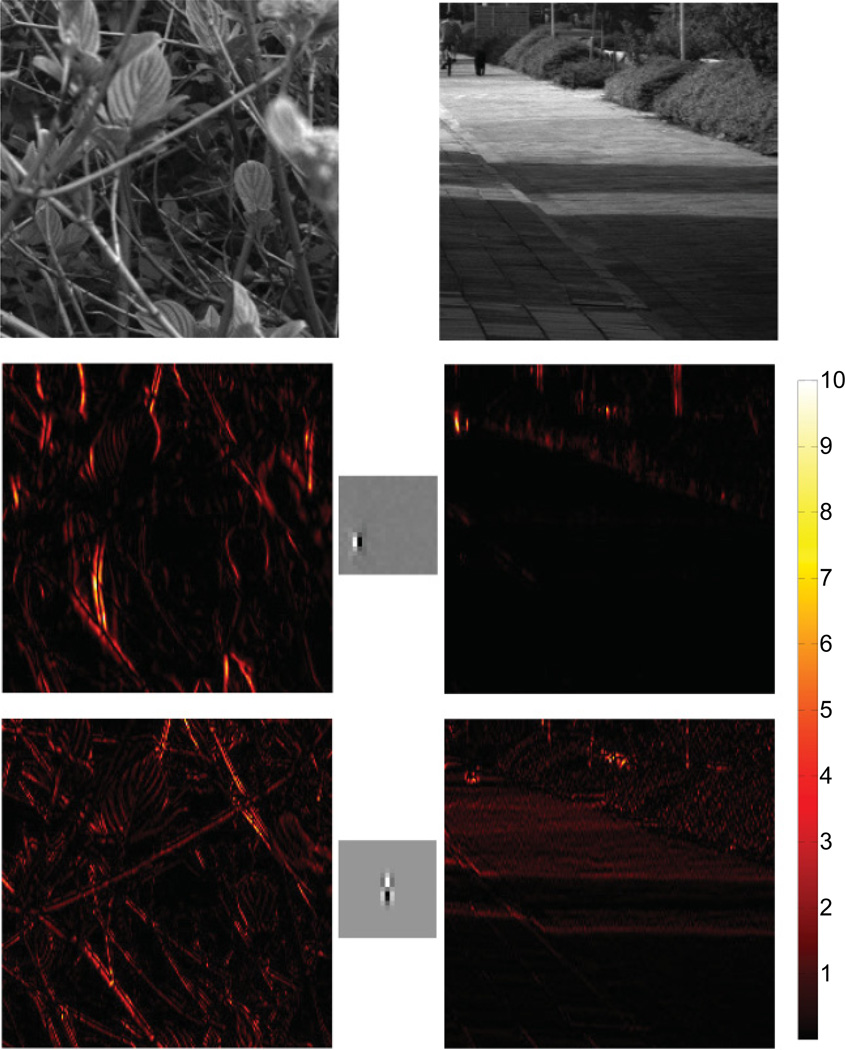
We end this section by showing the contrast between Gabor and double-Gabor filters in the convolution transformation of natural images. Double-Gabor filters, like Gabor filters, can detect linear features, as shown in the first example of Figure 15 on the left. The double-Gabor filter convolution at the bottom left panel of Figure 15 is more sensitive to edges along diagonal directions, as expected from the equality in Figure 14. Because of their additional symmetry properties, they can also detect certain textures, consistent with their spatial frequencies, as shown in the second example of Figure 15 on the bottom right. Double-Gabor filters thus have a dual role as edge and texture detectors. More study needs to be done to make this observation quantitative.
Figure 15.
Two examples of 230 × 230 patches from the van Hateren database and their convolution transformation by a Gabor and a double-Gabor filter with similar orientation prefereances. The 21 × 21 Gabor and double-Gabor filters (scaled up by a factor of three here) are shown in the middle and the bottom rows, respectively. Their corresponding transformed images were obtained by squaring each pixel after the convolution transformation of the images on the top with the filters shown. The convoluted images are 210 × 210 due to edges. The squaring better illustrates the edge and texture energy.
Figure 14.
A graphical demonstration that a double-Gabor function can be written as sums of two Gabor filters. However, only a small class of functions obtained by adding two Gabors will factorize in the form of a double-Gabor function.
5 Biological Comparisons
Here we compare our results to experimental observations. Our results capture some qualitative aspects in the recordings from cats and monkeys by Ringach (2004) and Xiaodong, Han, Poo, and Dan (2007). Receptive fields that resemble double-Gabors were found in the neuronal response of complex cells (which show some degree of translation-invariant responses) in the primary visual cortex of awake monkeys (Xiaodong et al., 2007). However, the double-Gabor type features were not the primary eigenvectors in their spike-triggered covariance analysis.
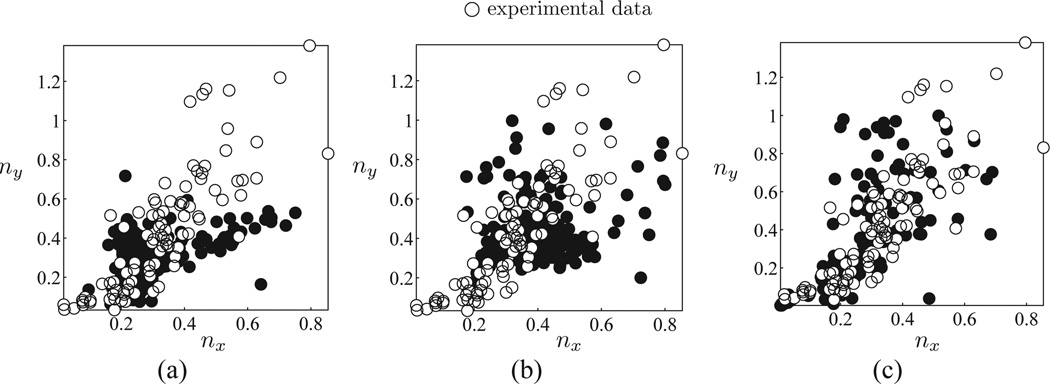
The distribution of (nx, ny) for cortical neurons (Ringach, 2004) lies around a line in Figure 16, but this is not matched by the distribution of filters derived from natural scenes with the conventional ICA (see Figure 16a). In contrast, the distribution of (nx, ny) for Gabor filters (see Figure 16b) and double-Gabor filters (see Figure 16c) derived from ICA applied on position-centered patches better matches the distribution of the cortical neurons (see Figure 16).
Figure 16.
Normalized spatial fequency plot of the experimental results (empty circles) and different versions of ICA filters (filled circles), where nx = kx/(2πγx), ny = kx/(2πγy). Each empty circle represents measurements from a single cortical neuron. The experimental results are reproduced here with permission from Ringach (Ringach, 2004; Ringach, Hawken, & Shapely, 2003). nx(y) is a dimensionless measure of the spread of Gabor-fit filters in x′ (y′) direction in units of the underlying wavelength of the modulations. (a) Filled circles are standard ICA results. (b) The same plot as a but the filled circles are now obtained by Gabor fit to the translation-invariant ICA results. (c) Here the filled circles are obtained from the double-Gabor fits. In all panels, the ICA fits are scaled by one-half to roughly match the experimental bounds. The failure of the standard ICA results (see panel a) in capturing the clustering of (nx, ny) along a line is now replaced with a better fit of the translation-invariant ICA in panels b and c.
6 Discussion
We have shown that incorporating a simple form of translation invariance in selecting small patches yielded independent components that were modulated in two directions. We quantified them by a simple extension of Gabor functions to what we have called double-Gabor functions, with their signature modulation in two directions. The independent component analysis of position-centered patches yielded more standard Gabor filters too. However, these filters were much more extended in both space and spatial frequency domains. We were successful in capturing some of the experimental features in the emergence of double-Gabor filters and the distribution of Gabor parameters among populations of V1 cells reported in the previous section. The primary visual cortex is the first step in building the wider invariance in higher visual areas (Rust, Schwartz, Movshon, & Simoncelli, 2005). In our simulations, the patches we have chosen are too small to contain any object, and we can think of them as making a translation-invariant representation for small texture patches and thus achieving only a partial translation invariance. This partial translation invariance for small patches introduces a bias for selecting texture features in images.
In comparing experimental results with our results, we do not mean to imply that neurons studied in these experiments perform linear operations on visual inputs. The selection of a subset of inputs that was the basis for this study is also a nonlinear operation. As neurons encode progressively more complex stimulus features with an increasing range of translation invariance along the visual stream, analysis of independent components of translation-invariant elements of the visual scenes should help in generating predictions for the types of feature selectivity one can expect to find in the extrastriate visual areas. In this study, we considered translation invariance in small patches derived from natural scenes. Therefore, it is instructive to compare the resulting features with the properties of complex cells in the visual cortex that are thought to mediate the first steps of translation invariance along the ventral visual stream.
The novel and unexpected lesson from this work is that a subset of inputs shows very different independent components from the whole set. The qualitative similarity between the double-Gabor filters evident in some of the independent components and the stimulus features relevant for the responses of some of V1 complex cells (Xiaodong et al., 2007) suggests a computational function for these neurons: they might participate in texture processing. In a previous study that applied ICA to texture patches (Chen, Zeng, & van Alphen, 2006), several of the ICA components were double-Gabor filters, although this was not explicitly noted by the authors. Finally, independent components computed for a set of images whose translation invariance was compensated for yielded improved agreement with the experimentally observed trend in the (nx, ny) distribution (Ringach, 2004).
Acknowledgments
This work was supported by HHMI (T. S.) and NIH grant R01EY019493 to (T.S.). T.S. was also supported by an Alfred P. Sloan Fellowship, Searle Scholarship, NIMH grant K25MH068904, NSF grant IIS-0712852, the Ray Thomas Career Development Award in Biomedical Sciences, and the Research Excellence Award from the W. M. Keck Foundation. S.S. was supported by the Sloan-Swartz Foundation. The clarifying paragraph surrounding equation 4.5 was initiated by a question Haim Sompolinsky asked at a Sloan-Swartz meeting. We thank Dario Ringach for providing the experimental data in Figure 16.We thank Marcelo Magnasco for his valuable comments.
Contributor Information
Saeed Saremi, Email: saeed@salk.edu.
Terrence J. Sejnowski, Email: terry@salk.edu.
Tatyana O. Sharpee, Email: sharpee@salk.edu.
References
- Amari S, Cichocki A, Yang H. A new learning algorithm for blind source separation. In: Touretzky D, Mozer M, Hasselmo M, editors. Advances in neural information processing. Vol. 8. Cambridge, MA: MIT Press; 1996. pp. 757–763. [Google Scholar]
- Barlow H. Possible principles underlying the transformation of sensory messages. In: Rosenblith W, editor. Sensory communication. Cambridge, MA: MIT Press; 1961. pp. 217–234. [Google Scholar]
- Barlow H. Unsupervised learning. Neural Computation. 1989;1:295–311. [Google Scholar]
- Bell A, Sejnowski T. An information-maximization approach to blind separation and blind deconvolution. Neural Computation. 1995;7:1129–1159. doi: 10.1162/neco.1995.7.6.1129. [DOI] [PubMed] [Google Scholar]
- Bell A, Sejnowski TB. The “independent components” of natural scenes are edge filters. Vision Research. 1997;37:3327–3338. doi: 10.1016/s0042-6989(97)00121-1. [DOI] [PMC free article] [PubMed] [Google Scholar]
- Chen X, Zeng X, van Alphen D. Multi-class feature selection for texture classification. Pattern Recognition Letters. 2006;27(14):1685–1691. [Google Scholar]
- Comon P. Independent component analysis, a new concept? Signal Processing. 1994;36(3):287–314. [Google Scholar]
- Hyvarinen A, Karhunen J, Oja E. Independent components analysis. New York: Wiley; 2001. [Google Scholar]
- Jutten C, Hérault J. Blind separation of sources, part I: An adaptive algorithm based on neuromimetic architecture. Signal Processing. 1991;24(1):1–10. [Google Scholar]
- Laughlin S. A simple coding procedure enhances a neuron’s information capacity. Z. Naturforsch. 1981;36(c):910–912. [PubMed] [Google Scholar]
- Olshausen B, Field D. Emergence of simple-cell receptive field properties by learning a sparse code for natural images. Nature. 1996;381:607–609. doi: 10.1038/381607a0. [DOI] [PubMed] [Google Scholar]
- Olshausen B, Field D. Sparse coding with an overcomplete basis set: A strategy employed by V1? Vision Research. 1997;37:3311–3325. doi: 10.1016/s0042-6989(97)00169-7. [DOI] [PubMed] [Google Scholar]
- Ringach D. Mapping receptive fields in primary visual cortex. Journal of Physiology. 2004;558:717–728. doi: 10.1113/jphysiol.2004.065771. [DOI] [PMC free article] [PubMed] [Google Scholar]
- Ringach D, Hawken M, Shapely R. Dynamics of orientation tuning in macaque V1: the role of global and tuned suppression. Journal of Neurophysiology. 2003;90:342–352. doi: 10.1152/jn.01018.2002. [DOI] [PubMed] [Google Scholar]
- Rust N, Schwartz O, Movshon J, Simoncelli E. Spatiotemporal elements of macaque V1 receptive fields. Neuron. 2005;46:945–956. doi: 10.1016/j.neuron.2005.05.021. [DOI] [PubMed] [Google Scholar]
- Simoncelli E, Olshausen B. Natural image statistics and neural representation. Annu. Rev. Neurosci. 2001;24:1193–1216. doi: 10.1146/annurev.neuro.24.1.1193. [DOI] [PubMed] [Google Scholar]
- van Hateren J, van der Schaaf A. Independent Component Filters of Natural Images Compared with Simple Cells in Primary Visual Cortex. Proceedings: Biological Sciences. 1998;265:359–366. doi: 10.1098/rspb.1998.0303. [DOI] [PMC free article] [PubMed] [Google Scholar]
- Xiaodong C, Han F, Poo M, Dan Y. Excitatory and suppressive receptive field subunits in awake monkey primary visual cortex (V1) Proceedings of the National Academy of Sciences. 2007;104:19120–19125. doi: 10.1073/pnas.0706938104. [DOI] [PMC free article] [PubMed] [Google Scholar]


