Abstract
We are developing a dual panel breast-dedicated positron emission tomography (PET) system using LSO scintillators coupled to position sensitive avalanche photodiodes (PSAPD). The charge output is amplified and read using NOVA RENA-3 ASICs. This paper shows that the coincidence timing resolution of the RENA-3 ASIC can be improved using certain list-mode calibrations. We treat the calibration problem as a convex optimization problem and use the RENA-3’s analog-based timing system to correct the measured data for time dispersion effects from correlated noise, PSAPD signal delays and varying signal amplitudes. The direct solution to the optimization problem involves a matrix inversion that grows order (n3) with the number of parameters. An iterative method using single-coordinate descent to approximate the inversion grows order (n). The inversion does not need to run to convergence, since any gains at high iteration number will be low compared to noise amplification. The system calibration method is demonstrated with measured pulser data as well as with two LSO-PSAPD detectors in electronic coincidence. After applying the algorithm, the 511 keV photopeak paired coincidence time resolution from the LSO-PSAPD detectors under study improved by 57%, from the raw value of 16.3 ± 0.07 ns full-width at half-maximum (FWHM) to 6.92 ± 0.02 ns FWHM (11.52 ± 0.05 ns to 4.89 ± 0.02 ns for unpaired photons).
Index terms: Coincidence, convex, positron emission tomography, time resolution, PSAPD
I. Introduction
We are developing a positron emission tomography (PET) system for breast cancer imaging [1], [2]. The system uses a two-panel geometry with each 16×9×2 cm3 panel requiring 2304 Position Sensitive Avalanche Photodiodes (PSAPDs) coupled to 8 × 8 arrays of 1 × 1 × 1 mm3 LSO (Lutetium Oxyorthosilicate) scintillation crystals for a total of 294 912 crystal elements. The use of an “edge on” detector design with the photodetector planes oriented orthogonal to the panel planes enables > 90% scintillation light collection efficiency for 1 mm resolution crystal elements, independent of interaction location, directly measured photon depth of interaction (DoI), and 3-D positioning of individual photon interactions [3]. Simulations show that at 5 mCi whole body image dose, the system will have an event rate of 4.6 million events per second [2]. The system will acquire list-mode data.
Each panel has 9216 readout channels. The channel count is read out using 288 RENA-3 readout ASICs, developed by NOVA R&D [4]. The RENA-3 ASIC was chosen for its processing capabilities and density of channels—36 channels, each consisting of preamplifier, Gaussian shaper, trigger, and timestamp circuitry—and for its low power consumption of less than 6 mW per channel. Each RENA-3 chip can handle a maximum event rate of 83 kHz, though the average event rate per RENA-3 will be 16 kHz [2].
This RENA family has been used for gamma ray detection with [5], [6] built using the RENA-3, [7] using the RENA-2 and [8], the RENA-1. The RENA-3 is being designed with CZT for use in small animal PET in [9].
In [2], the coincidence timing resolution of two LSO-PSAPD detectors was shown to be 15.5 ns full-width at half-maximum (FWHM), similar to the time resolution reported for the RENA-3 in [7] and [9]. The timing resolution for other PMT-based breast dedicated PET imaging systems is under 10 ns FWHM: 1.2 ns [10], 5.2 ns [11], and 8.1 ns [12]. In order to achieve sub 10 ns timing resolution with PSAPDs, additional calibration parameters were used and a calibration method was created in order to compensate for the nonoptimal timing of the RENA-3 ASIC.
We show that per crystal coincidence time calibration from list-mode data can be formulated using a maximum-likelihood framework and solved with a direct or iterative convex optimization method. We also demonstrate that additional correlated noise can be accounted for to further improve the annihilation photon pair coincidence time resolution.
II. Methods and Materials
A. System and Timing Method
The RENA-3 ASIC consists of 36 configurable channels [4]. Each channel can be configured to accept positive or negative pulses, to act as a trigger or be read out on another channel’s trigger. On a trigger, the RENA-3 system records a timestamp for the triggered channel and amplitude data from user specified channels. The timing is obtained through two mechanisms: a leading edge discriminator and a quadrature time stamp. This section explains these two mechanisms.
1) Leading Edge Discriminator Trigger
The RENA-3 uses a leading edge discriminator as the trigger. This consists of a comparator with a programmable threshold value. For our application, timing is done with a negative pulse signal, so when the input signal passes below the threshold, the RENA-3 senses a trigger.
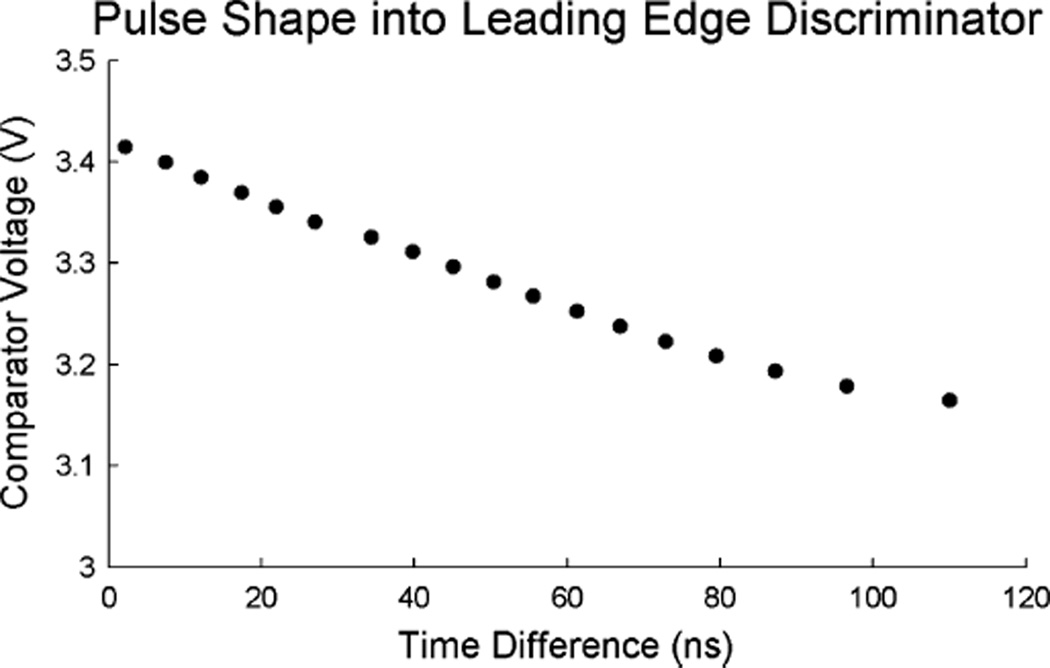
The time of the trigger event is dependent on the input signal shape. Prior to reaching the comparator, the energy pulse is shaped by a preamplifier, followed by an optional pole-zero cancellation network, differentiator, and fast shaper. The resulting pulse shape present at the comparator is seen by changing the threshold on one channel while holding another constant. Fig. 1 shows the shape of the pulse that is seen by the comparator. For this example, a square wave signal, with a rise time of 5 ns, is AC-coupled to two channels on one RENA-3 chip. The comparator threshold on one channel is held constant and the arrival time reported by this channel is a reference for the signal arrival time. The threshold voltage on the second channel is varied and the difference in its arrival time to that of the reference is plotted.
Fig. 1.
Stepping through threshold values shows the shape of the input signal to the leading edge discriminator. Lowering the threshold causes the negative pulse to trigger the comparator at a later time.
For this demonstration, the differentiator sets the dc level of the shaped pulse to 3.5 V. The negative pulse shape is visible and the last threshold to record triggers was 3.17 V, indicating that for this square wave, the shaped pulses have amplitude of around 0.33 V. The middle range has a slope of 2.6 V/µs. The 10%–90% rise time is in the 80 ns range.
Many of these factors impact the timing capabilities of the RENA-3 and much of this paper will focus on explaining how to compensate for time-walk introduced by the use of leading edge discrimination.
2) Quadrature Timing
When the leading edge discriminator comparator threshold is passed, two different methods capture the time: a coarse digital timestamp, and a fast analog timestamp. The coarse timestamp is recorded by a counter on an FPGA when the RENA-3 reports it has seen an event. For the fast analog timestamp, when the comparator threshold is passed, the voltage of the two quadrature signals are sampled and later converted to digital values. The relationship between the signals encodes the arrival time.
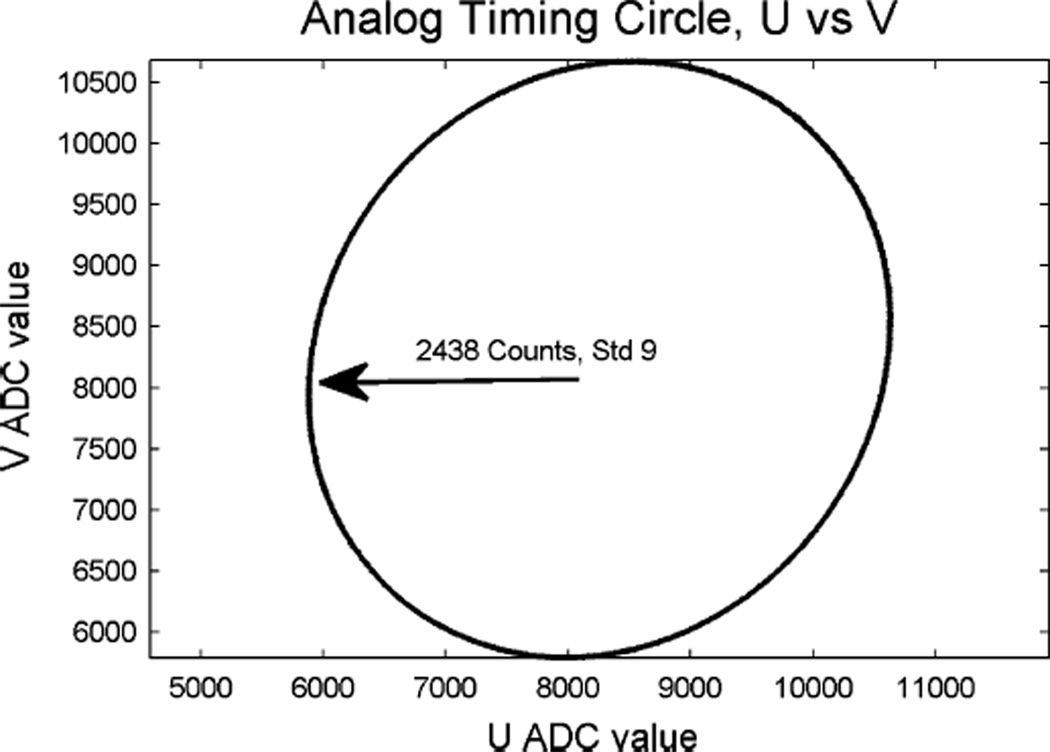
The quadrature signals, U and V, are sinusoids with one lagging the other by 90° in phase. In Fig. 2, a plot of U and V signals recorded for several events shows the resulting timing circle for one channel. To find the time difference between events that occurred on two different channels, the location of each event on the timing circle is found, and the angle difference between the two measurements directly correlates to the time difference. The angle difference divided by the frequency of the signals gives the time difference. In our setup, the frequency of the signals is 1 MHz.
Fig. 2.
The quadrature timing signals, U and V, when plotted against each other for 54098 pulses, form a circle. The circle has a radius of and average of 2438 counts and a standard deviation of 9 counts.
As seen in Fig. 2, dc offsets in the ADC values need to be taken into account before calculating the angle for timing. The skew in the circle is due to the phase difference in the two signals not being exactly 90° or the sampling occurring at slightly different times. More eccentricity can occur when the magnitude of the two quadrature signals are not identical.
Quadrature timing does not have uniform time bins, due to the phase being calculated by a uniform sampling of amplitude of the quadrature signals, rather than a direct phase measurement. With the quadrature signals maximum range of 4876 counts, the largest time bin is under 100 ps, occurring at phases of pi/8 + n * pi/4. This is a differential nonlinearity of 50 ps. Uncorrected, a 3° phase error between the signals can lead to an integral nonlinearity of 4 ns. Fig. 2 has a phase error of about 3°.
The fast timestamp is determined by the angular separation of the two events on the circle. Imperfect signals or imperfect sampling causes distortion in the circle. The radius of the circle averages 2438 counts and the standard deviation of the radius at each angle is nine counts.
B. Timing Issues
The timing pickoff can be offset or distorted in a number of different ways. Some distortion is directly due to variations in the chip, such as individual channel delays and noise from the quadrature signals. Other distortion is related to the actual measurement, such as crystal location on the PSAPD and variance in amplitude of the output signal.
1) ASIC Channel Delay
With identical noiseless input pulses on two channels, it is possible for the channels to report slightly different arrival times. The largest impact is likely the difference in comparator switching delays. Each comparator will have a different delay when its threshold is passed, reporting an arrival time offset by the delay amount.
Other individual channel delay variation can occur in the preamp, zero-pole cancellation network, differentiator and fast shaper that process the pulse before the comparator. These delays will vary from channel to channel and chip to chip and will also create a fixed offset to the reported photon arrival time.
Finally, any variation between channels in the threshold voltage or dc bias voltage will cause offset in measured photon arrival times. A threshold difference could be caused by variations in digital to analog converters or in reference levels. The dc bias voltages could be different due to I-R drop across the chip. If the pulse shape at the comparator is linear, these variations will affect the arrival time measurement by a fixed offset. Other pulse shapes will have varying effects.
The comparator threshold has a range of 3.75 V, with 8-bit resolution, for about 15 mV steps. The experiment with the square wave signal, described in Section II-A, showed that a one-bit difference in threshold causes an offset in reported arrival time of 5.8 ns. This is a significant difference for our application, so a hardware threshold calibration to handle the cumulative fixed offsets is insufficient to calibrate the individual channels. A post-acquisition calibration of a constant offset is necessary.
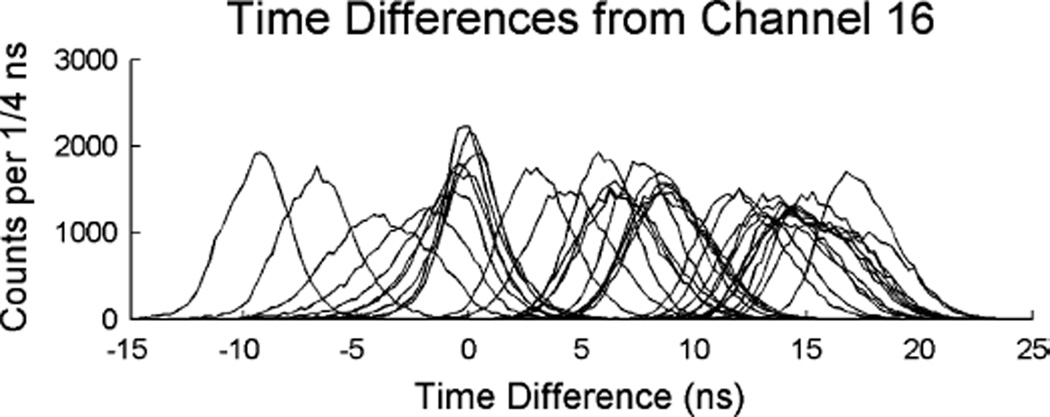
A charge injection pulse was sent to the 36 channels on the RENA-3 ASIC. The pulser data set consisted of 54 098 pulses. The same threshold DAC value was used on each channel. Histograms of the reported arrival time relative to channel 16 shows several distributions with a range greater than 25 ns. The different arrival time offsets are visible in Fig. 3. From this figure, it can be seen that an iterative method of averaging time differences should be feasible.
Fig. 3.
Pulser timing histogram from channel 16 to the other 35 channels. Each line shows a different channel. A range of greater than 25 ns exists across the channels.
2) Correlated Quadrature Noise
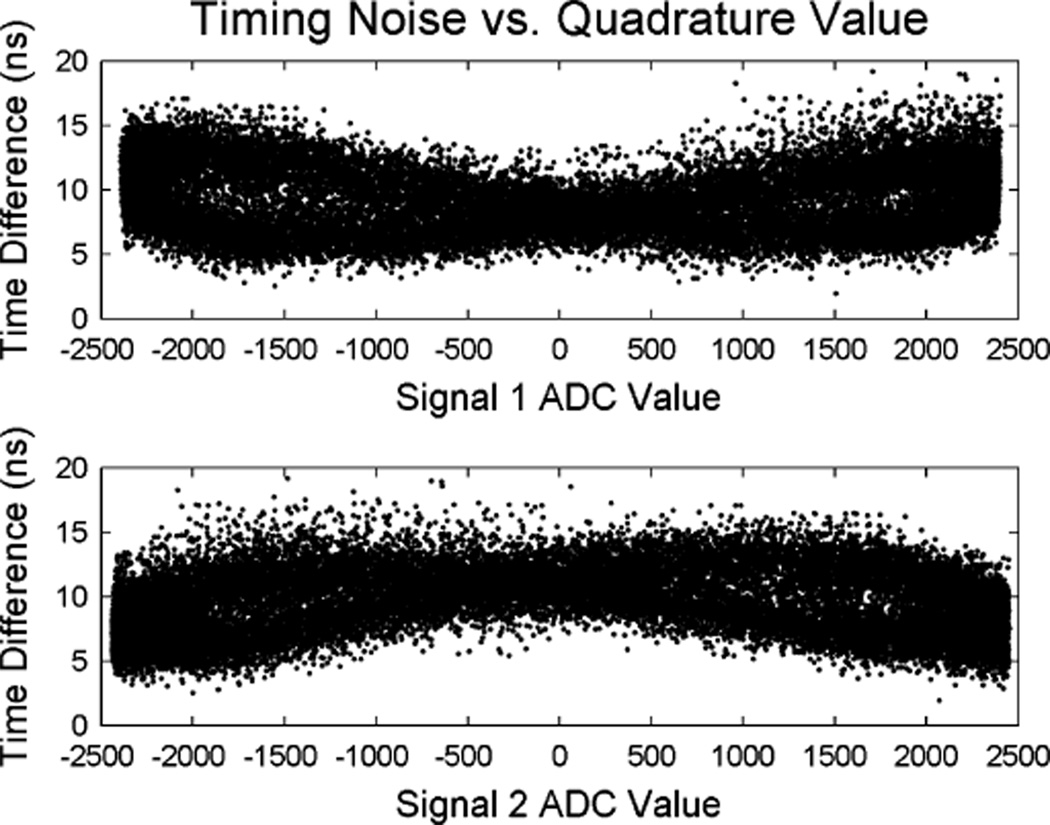
A second timing effect is also observed using a pulser. Pulsing two channels and plotting the U and V signals against the timing difference shows a nonconstant, nonlinear correlation between the quadrature signals and time difference. The observed correlation is shown in Fig. 4. This correlation is due to the distortion in the analog timing circle, shown in Fig. 2.
Fig. 4.
Plots of the quadrature timing signals against the calculated time difference show a strong correlation which can be corrected to improve the pair coincidence timing resolution.
3) Crystal-Location Dependent Variations on the PSAPD
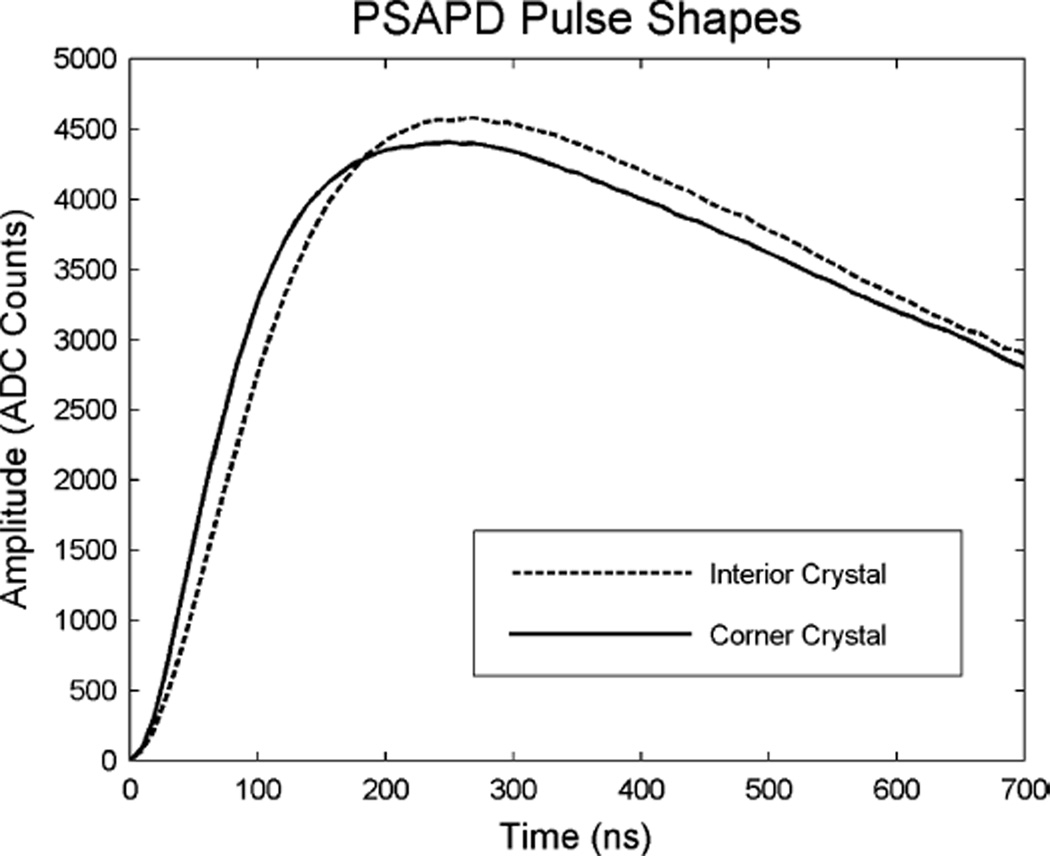
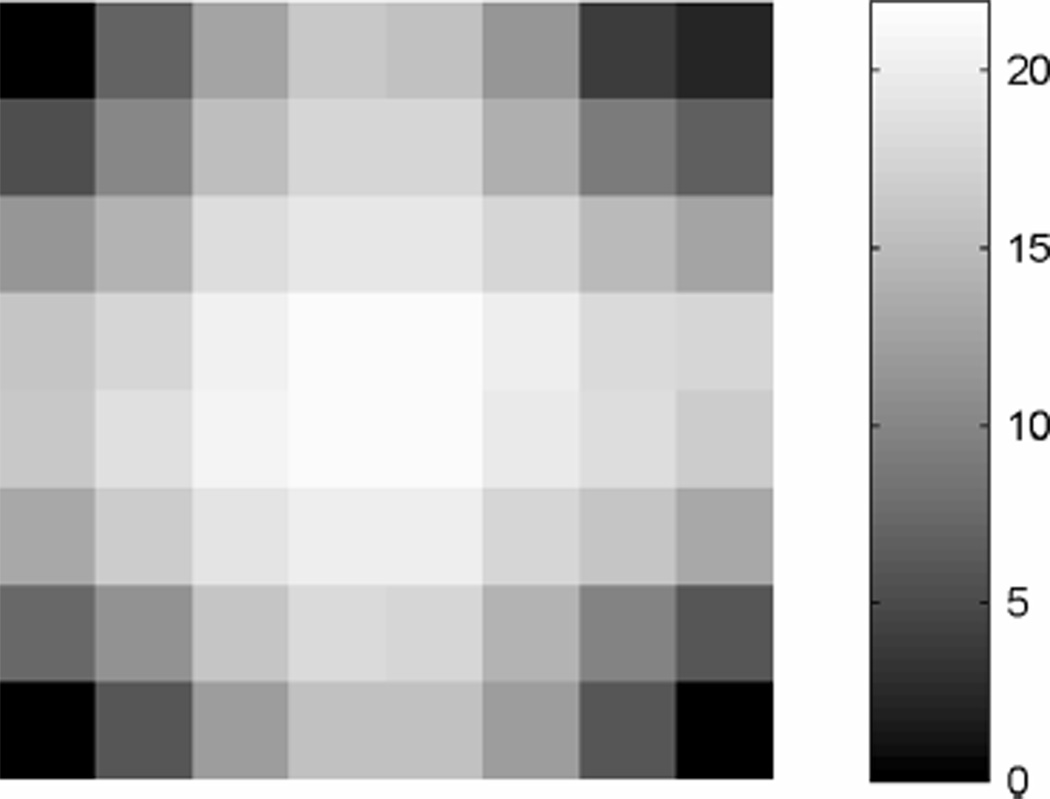
The PSAPD produces further time dispersion effects. The first is due to the variation in RC time constant across the device. The PSAPD contains a resistive sheet to determine positional information [15], so charge created by light that enters near a corner of the device will see an effective resistance significantly lower than that of charge created in the center of the device. Therefore, annihilation photons detected by crystals at the edge of the device will appear to arrive much sooner than those interacting in a crystal near the center, as seen in Fig. 5. This effect is also mentioned in [16], though no calibration procedure was proposed or reported. For our system, the time delays for the 8×8 crystal arrays on PSAPDs vary up to 20 ns [17]. Fig. 6 shows a map of the time delay for a crystal array found in the calibration, demonstrating the time delay versus the relative position of the crystals. A constant offset in timing per crystal compensates for this effect.
Fig. 5.
Digitized PSAPD pulse shapes. The PSAPD signals used for timing were measured using free-running ADCs [24]. The delay in arrival time between events in crystals near the center of the PSAPD compared to the corner of the PSAPD is visible.
Fig. 6.
Per crystal timing delay caused by the PSAPD resistive sheet. The gray scale units are nanoseconds. The bottom right corner is the crystal used as the timing reference. Timing for crystals on a single PSAPD is achieved using timing measurements from only one RENA-3 channel.
4) Amplitude Dependent Time Walk
The second effect on coincidence timing resolution from the detector is due to energy resolution. The energy resolution of this system is 14.4 ± 0.8% FWHM [13]. The different amplitudes of pulses cause the leading edge discriminator to cross its threshold value at different delays. A higher amplitude signal will appear to arrive earlier than a lower amplitude signal. With the RENA-3’s fast shaper 10%–90% rise time of about 80 ns, a pulse with energy 7.2% lower would cause the system to trigger about 7.5 ns later. With the imperfect energy resolution of this system, the time walk inherent to a leading edge discriminator is significant, even when gated for the 511 keV photo peak. The delay will be even more pronounced with if lower energies are used. The delay is linearly related to pulse height if the rising edge of the pulse is approximately linear.
C. Calibration Formulation and Optimization
Many methods have been created for the timing calibration of PET scanners. Methods range from using time alignment probes and calibrating manually to using algorithms and timing histograms to calibrate offsets for each block detector [18]–[20], and then for each individual crystal [21]. Some algorithms use direct calculation of the calibration offsets [22], while others use iterative methods [18], [21], [23]. Here we show that timing calibration, as a function of any number of calibration parameters, is a convex optimization problem. This allows the solution to be found using conventional methods, such as direct inversion or coordinate descent, an iterative method. The calibration parameters in this system include delay for each individual crystal and correlated noise from the quadrature timing.
1) Problem Formulation
We consider a list of n coincidence events (or annihilation photon pairs) detected by the system. The k,th event comprises the following information: the indices of the crystals involved ik and jk, the two arrival times and , and some additional data, which will be denoted by two column vectors and . The column vectors contain the amplitude of both pulses, and , and the quadrature time samples , and .
The timestamps measured on crystal i follows a random distribution, described by the random variable T
| (1) |
where τ is the true photon arrival time, δ is the per crystal delay and ε is the measurement noise. To simplify later calibration, the per crystal delay is modeled as a linear combination of the event data, including a constant bias
| (2) |
where ci; is the vector of calibration parameters for each crystal element.
Since the breast imaging panels are 4–8 cm apart, the noise bias effects from time of flight are negligible. The measurement noise is modeled by a zero-mean normal distribution with variance σ2.
The time difference measured between both photons in a coincidence event follows a random distribution given by
| (3) |
Since the time of flight, , is negligible, it is ignored. As a result, the vector of measured time difference is well described by an uncorrelated Gaussian random vector
| (4) |
The per-crystal delay differences are a linear combination of the per-crystal calibration factors c
| (5) |
where is formed using the per-event data and .
Equation (6) shows an example matrix formulation of the time calibration problem for five annihilation photon pairs in a system with four crystal elements or arrays
| (6) |
The goal of the time calibration is to estimate the calibration parameters per crystal element given the measured data. Maximum-likelihood (ML) estimation was used for this purpose. The log-likelihood function is given by
| (7) |
where is the measured time difference.
The ML calibration parameters c are such that is minimized, which is more commonly known as a “least-squares problem.” It should be noted that this approach also optimizes the coincidence time resolution of the system since
| (8) |
is simply the calibrated time difference.
A number of other objective functions, such as the L1 norm or a weighted sum are available to evaluate the timing error. With an initial system calibration scan with a weak source and a low randoms rate, the L2 method is sufficient. However, to adjust the calibration using data from a real scan with a high randoms rate, an alternative cost function, with a smaller penalty for large errors, could be used.
2) Optimization
Formulating a maximum-likelihood problem amounts to solving the following least squares problem: select the appropriate vector c to minimize . This can be directly solved with the pseudo inverse, c = (A T A)−1 A T Δt.
When A becomes large, the inverse of A T A is computationally intensive, and an iterative single-coordinate descent algorithm is used. For each iteration, the parameters for a single crystal or channel are optimized while the parameters for other crystals or channels are held constant. This procedure is repeated until no further improvements in coincidence time resolution can be achieved.
The authors in [21] show a similar problem formation, and are, in effect, using a single-coordinate descent method, itera-tively optimizing a parameter for each coordinate, the per crystal delay time.
3) Implementation
To calibrate the individual RENA-3 channel delays, the ASIC inter-channel delay is calibrated using a single fixed delay per channel, each an element in the vector c. One channel is used as a reference and does not have a calibration offset, so the vector c has one element fewer than the number of channels. Each row of the matrix A contains one coincidence event. The kth row represents the kth event, recorded between the channels i and j. On this row, all the coefficients are zero except the ith and jth columns, which are equal to (+1) and (−1), respectively. The size of the matrix A is the number of coincident event rows times the number of channels less the reference channel.
The quadrature timing noise is calibrated by adding information to the matrix A and vector c. A polynomial correction for the two signals, u and v, is achieved by adding correction coefficients for each of the channels into the vector c. The number of rows in the matrix A is increased and for each coincident event the recorded signal values are placed into the appropriate column. The known values, u, v. u2, v 2, and uv are included in the matrix A, and five additional calibration parameters for each channel are added to c. The constant term is included with a constant term from the delay corrections. For 10 channels, there are 59 calibration parameters.
4) Individual Channel Contribution
Knowing the channel to channel variance for all combinations, the individual single timing resolution per channel can be estimated. Assuming a Gaussian noise distribution on the timing error and independence between channel measurement errors, the combined variance for two channels is the sum of the individual variance between the channels. The combined variance is directly related to the square of the FWHM of the pulser data coincident time resolution.
D. Detector Setup
Two 8×8 arrays of 1 × 1 × 1 mm3 crystal elements, each coupled to a 10 × 10 mm2 PSAPD, is connected to one RENA-3 chip. The signal of the PSAPD is higher than the dynamic range of the RENA-3 chip, so attenuation is required. The negative, common, signal is split through a capacitive divider between two channels, the larger of which is saturated and used for timing information, while the smaller is used for energy information. The positive signals, which are split by the PSAPD to provide positional information, are attenuated to ground using a capacitive divider [13]. A 22Na point source is placed between the crystal arrays, which are aligned edge-on with respect to the source (Fig. 7).
Fig. 7.
Two 8×8 arrays of 1 × 1 × 1 mm3 crystal elements coupled to PSAPDs are placed edge-on, 6 cm apart. A 22Na point source is placed in between the two crystal arrays. The crystal flood histogram for each array used for crystal position gating is shown below the crystal.
The timing calibration optimization is performed using the coordinate-descent method, treating the parameters for each 1×1×1 mm3 crystal element as a different coordinate. For each test, the calibration is performed using a subset of collected data; the coincidence time resolution is reported using the remaining data.
III. Results
Both the RENA-3 and the LSO-PSAPD detectors have influence on the calibration procedure and calibration factors. In order to separate out the effects, different experiments were run. In order to determine the effect from the RENA-3, a pulser was used to generate timing data. Once the effects from the RENA-3 were known, the pulser was replaced with the LSO-PSAPD detectors. All pulser data was calibrated using the direct convex optimization method. The PSAPD detectors were calibrated using the iterative convex optimization method.
A. ASIC Dependent Correction Factors From Pulser Data
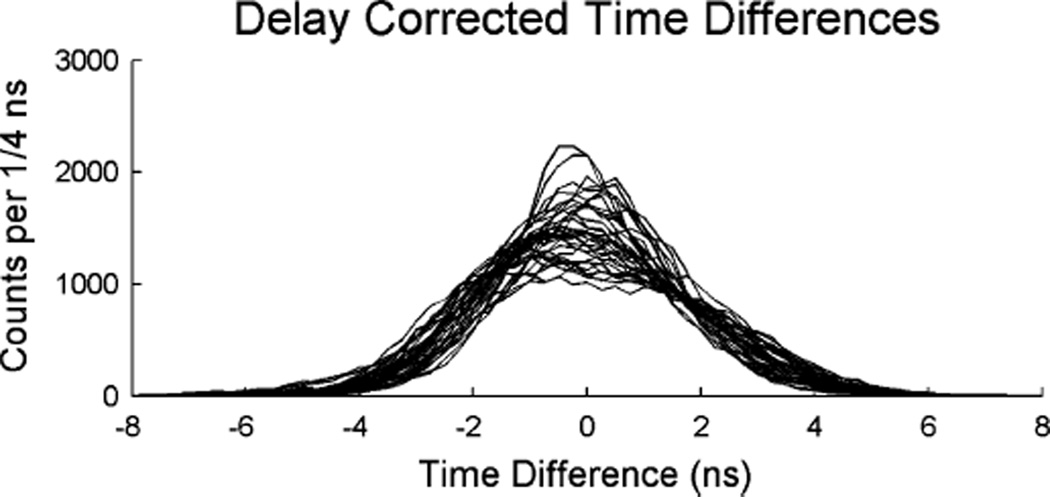
Fig. 8 shows the results from a correction for ASIC per channel delay. With the delay correction, pulser coincident time resolution from all channels to channel 16 is 4.39±0.04 ns. This is a significant improvement compared to the 25 ns of channel skew as seen in Fig. 3.
Fig. 8.
Timing histograms from ASIC channel 16 to the other 35 channels using pulser data. Each line shows a different channel. Removal of channel skew through delay correction improved the coincidence time resolution from an uncorrected 25 ns range to 4.39 ± 0.04 ns FWHM.
In a second calibration of the data, randoms were artificially added to the data set by arbitrarily pairing list mode data. The distribution of the resulting randoms does not change after application of the algorithm. The algorithm improves timing between coincident photons and has no nonlinear effects on randoms data.
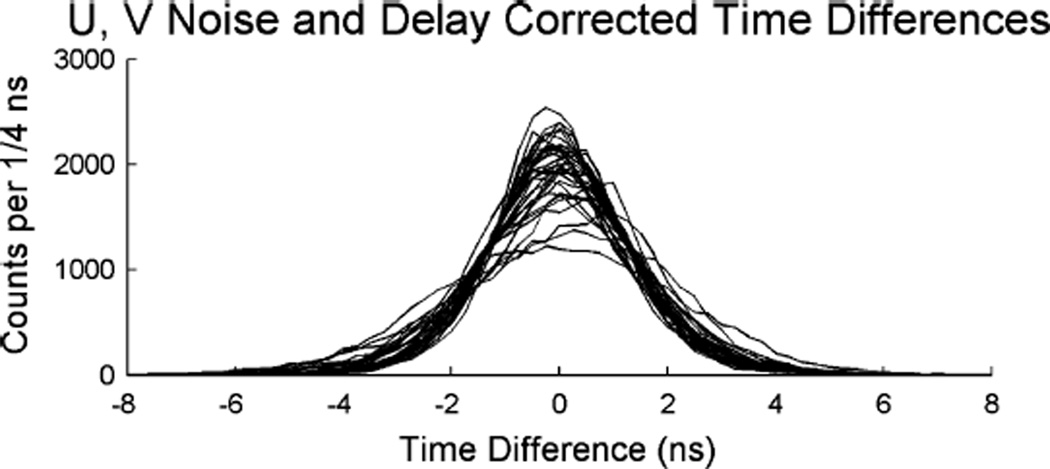
The histograms in Fig. 9 show the results after calibration for quadrature timing noise, using the polynomial correction previously described. As with the ASIC inter-channel delay correction, the algorithm has no impact on the randoms distribution. With correction for delay and quadrature timing, pulser coincident time resolution for all channels to channel 16 is 3.37 ± 0.02 ns.
Fig. 9.
Timing histograms from ASIC channel 16 in reference to the other 35 channels using pulser data. Each line shows a different channel. Correction for quadrature timing correlated noise has a 22% improvement over just delay correction to achieve 3.37±0.02ns.
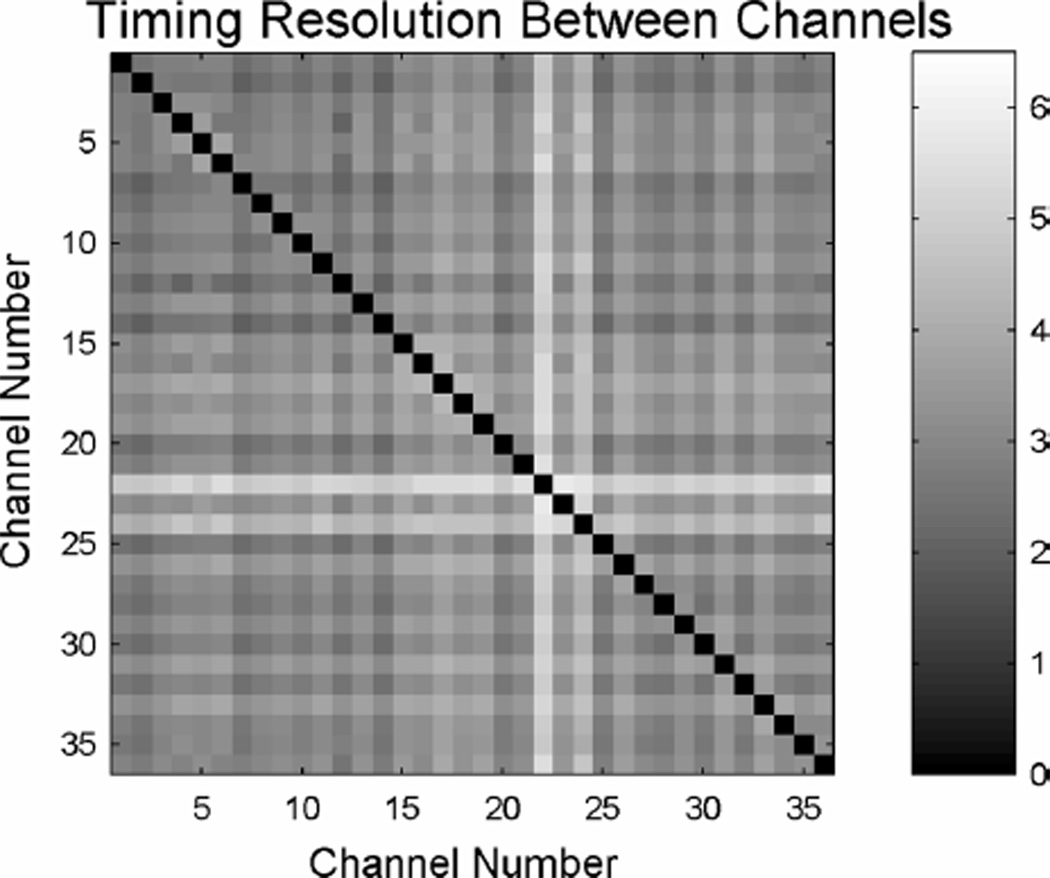
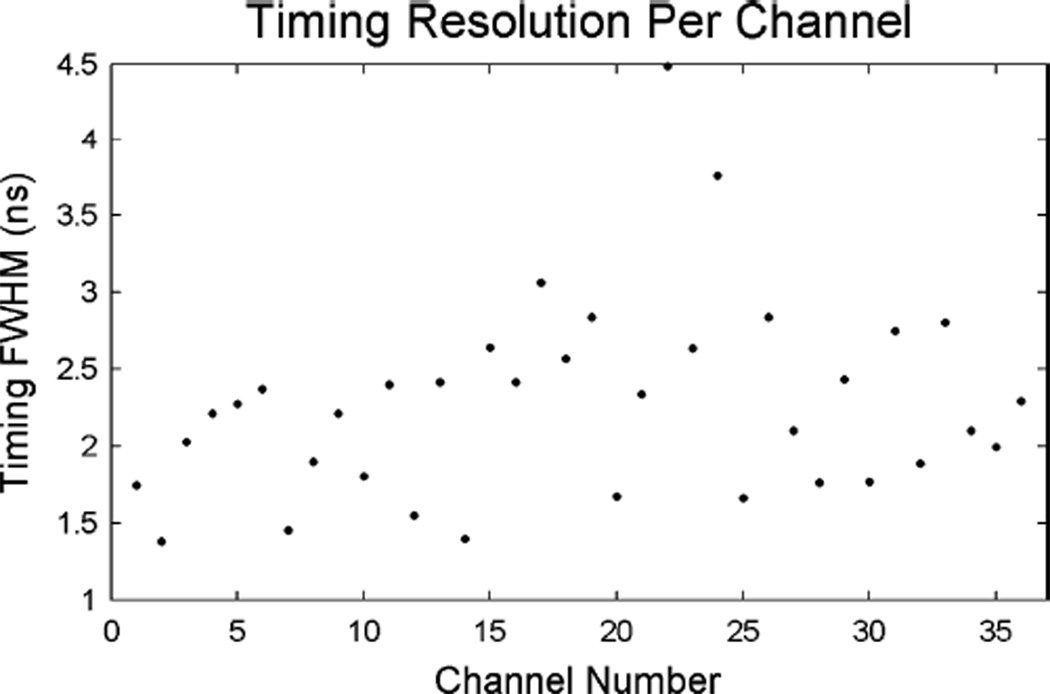
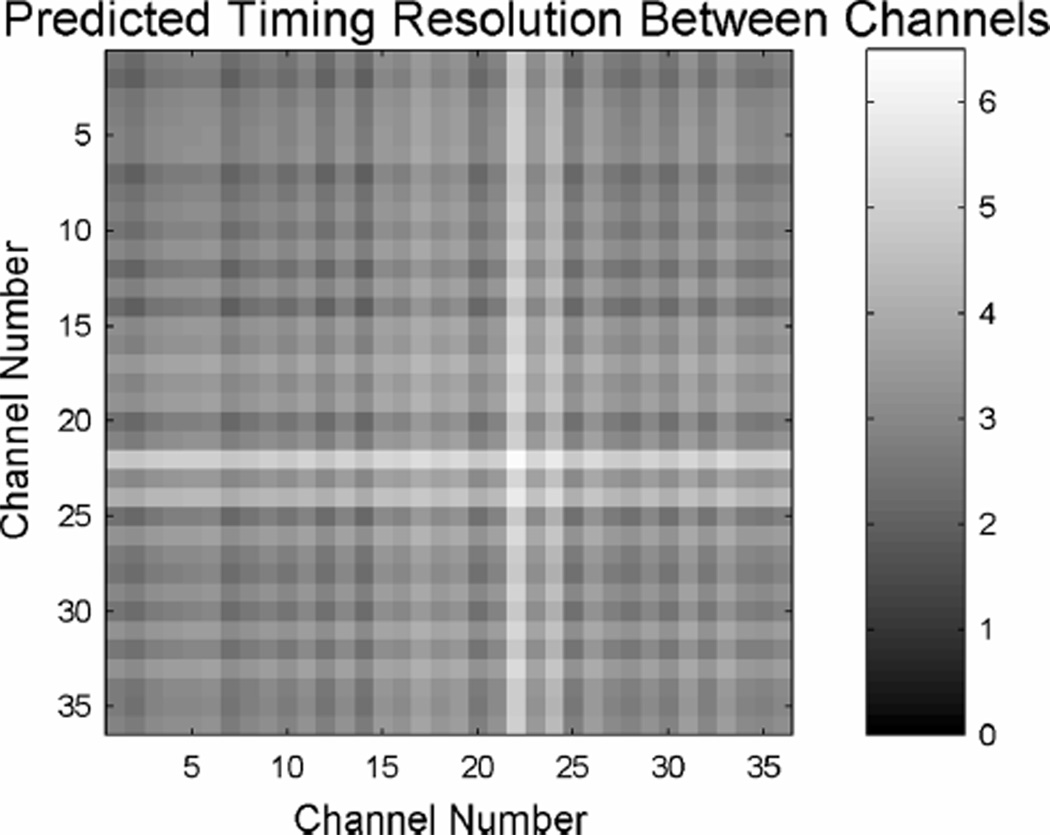
Fig. 10 shows the pulser coincidence time resolution for all pairings of 35 channels of the RENA-3. The coincidence time resolution between any two channels varies from 1.95 ± 0.01 ns at best to 5.87 ± 0.02 ns at worst. The estimated unpaired time resolution per channel is shown in Fig. 11. The best individual timing resolution is 1.38 ± 0.02 ns FWHM; the worst is 4.48 ± 0.02 ns FWHM. The estimated paired time resolutions are shown in Fig. 12, which compares well to the corresponding measured values shown in Fig. 10. The mean difference for all pairings is 2.34 ± 1.5%.
Fig. 10.
Measured pulser coincidence time resolution for all pairings of channels in the ASIC. The whiter shade signifies a greater FWHM. Units are FWHM in nanoseconds. The diagonal of zeros down the center is due to no data for a channel being paired with its self.
Fig. 11.
The individual channel (unpaired) timing resolutions for pulser data. The unpaired channel time resolution varies from 1.38 ± 0.02 ns FWHM to 4.48 ± 0.02 ns FWHM.
Fig. 12.
Predicted coincidence time resolution between all pairings of channels for pulser data. The whiter shade signifies a greater FWHM. Units are FWHM in nanoseconds. The diagonal, where channel numbers of each axis are the same, represents the time resolution if it was possible to measure two coincident events on the same channel.
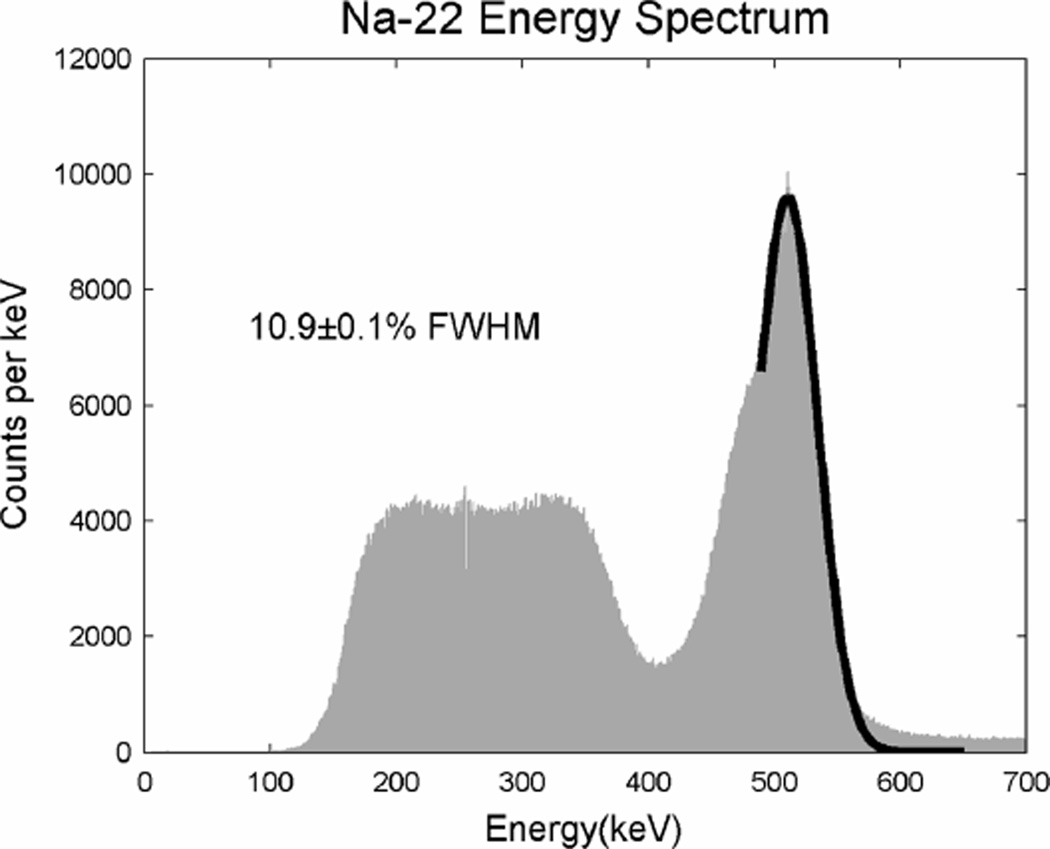
B. Detector-Dependent Correction Factors
For the LSO-PSAPD detector setup, approximately 450 000 coincident events were collected. Around 50 000 coincidence events remained when both arrays were gated to ±15% around the 511 keV photopeak, shown in Fig. 13. The crystals locations were segmented manually from the acquired crystal image as described in [14]. The flood histograms of the crystal arrays are shown in Fig. 7. The pin cushion effect in the flood histograms is a characteristic of PSAPDs due to nonlinear equivalent resistances across the sheet and is also shown in [16] and [14].
Fig. 13.
An energy spectrum from an 8 × 8 array of l×l×l mm LSO-PSAPD detector. The gain is calibrated per crystal and the resulting energies combined to form the spectrum of the whole detector. The energy resolution is l0.9±0.1% FWHM and the lutetium X-ray escape energies are visible in the lower energy side of the photopeak.
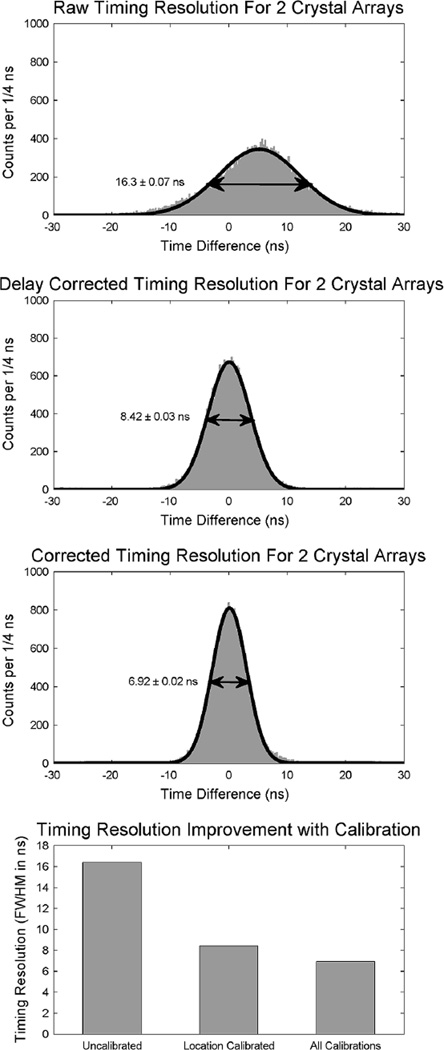
The precalibration paired photon coincidence time resolution was found to be 16.37±0.07 ns FWHM. After correction for per crystal location on the PSAPD effects, the paired coincidence time resolution improved to 8.42 ± 0.03 ns FWHM. The additional signal amplitude and quadrature timing correction improved coincidence time resolution to 6.92 ± 0.02 ns FWHM over all crystal elements in the two arrays. Timing histograms are shown in Fig. 14.
Fig. 14.
Timing histograms of coincidence timing between LSO-PSAPD detectors of Fig. 7. From top to bottom: No correction, FWHM 16.38 ± 0.05 ns; ASIC inter-channel delay correction, FWHM 8.42 ± 0.03 ns; inter-channel delay, signal amplitude and quadrature timing correction, FWHM 6.92 ± 0.02 ns; and the improvement of timing resolution with each calibration.
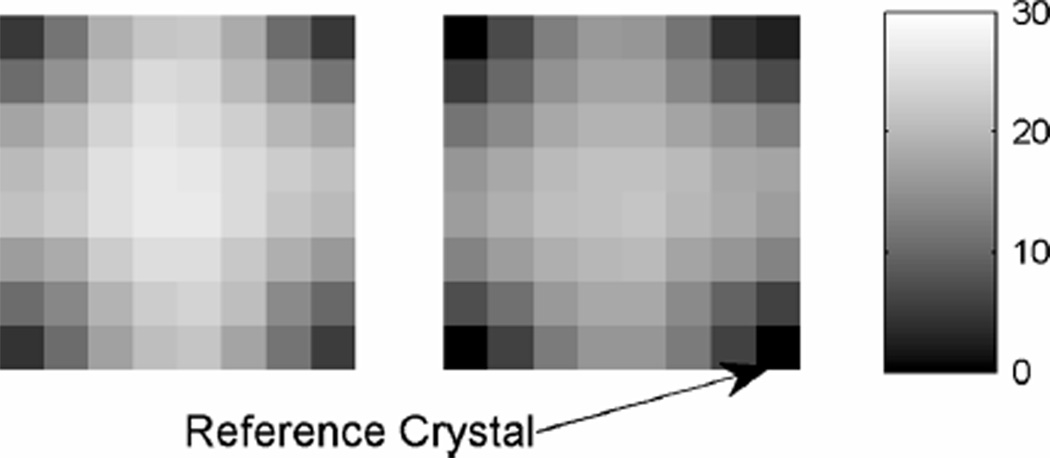
The calibration delays resulting from the per crystal PSAPD delay calibration are shown in Fig. 15. The change in RC time constant due to the capacitance of the readout system and different locations on the resistive sheet of PSAPD across the array is visible. The corner crystals have significantly less delay than center crystals and the same pattern is visible in both crystal arrays. There is also an apparent bias between the two crystal arrays. This is due the inherent delay between the two PSAPDs’ readout channels.
Fig. 15.
The optimum delay adjustment for the two 8×8 crystal arrays coupled to PSAPDs used in the coincident setup of Fig. 7. The gray scale is in nanoseconds. There is up to 20 ns delay across the PSAPD sensitive surface, and a 10 ns delay between the two arrays.
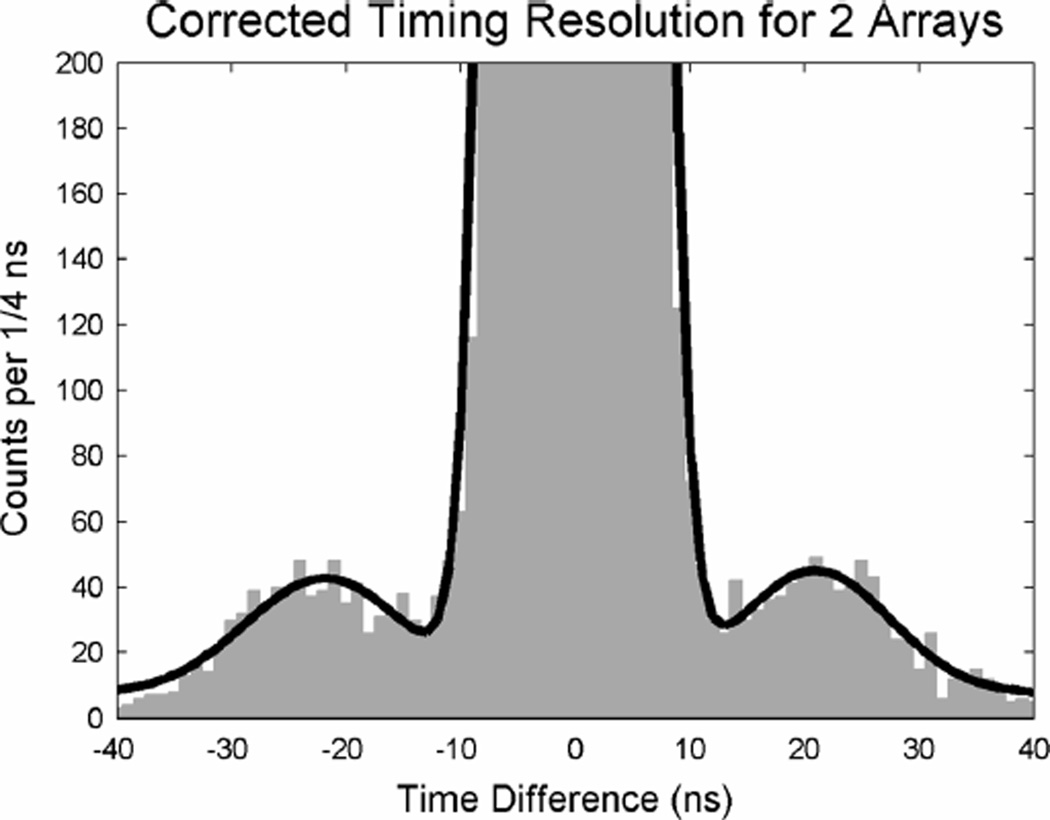
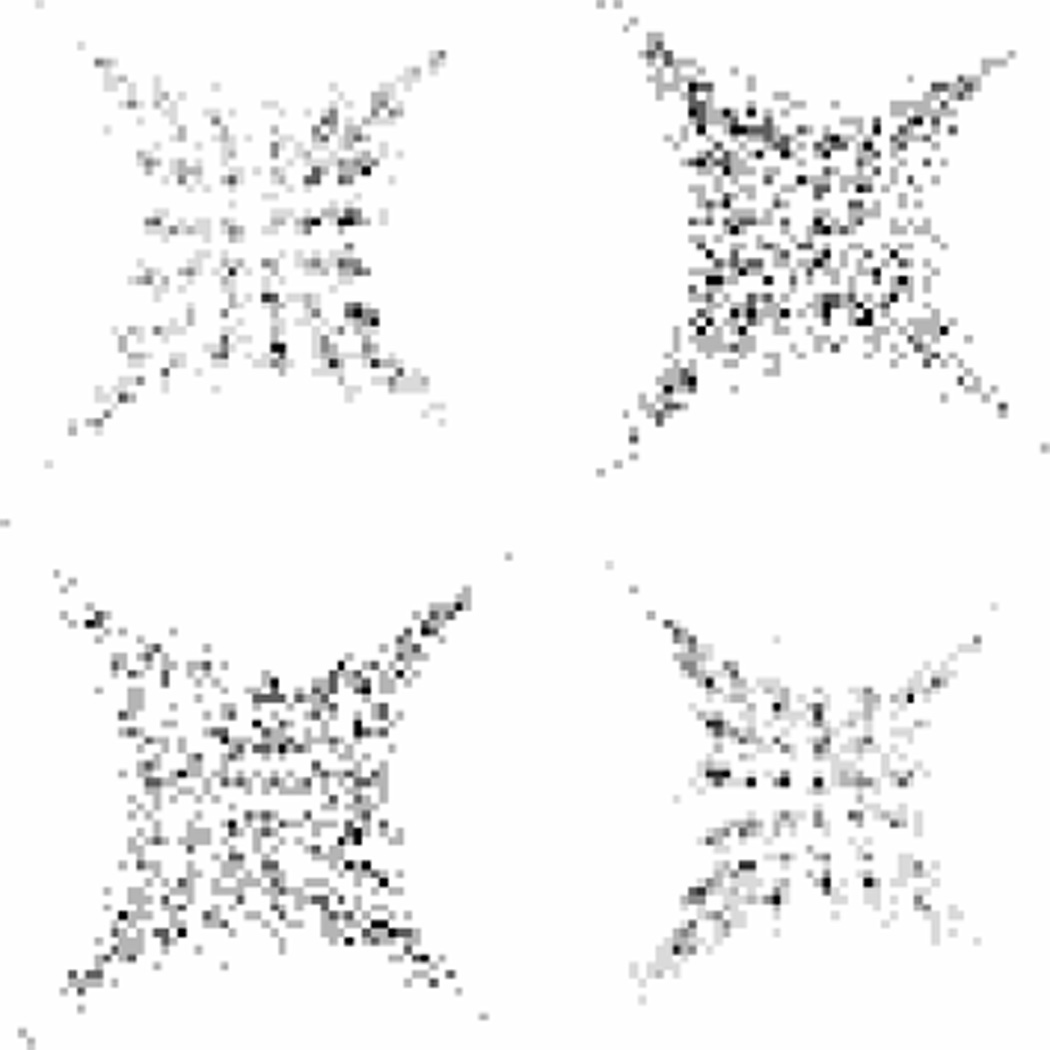
A closer examination, in Fig. 16, of the optimized time spectrum (6.92 ± 0.02 ns FWHM) over the two 8×8 arrays shows two side peaks outside of the center peak. The flood histograms from each of these side lobes for both PSAPD detectors are shown in Fig. 17.
Fig. 16.
A closer look at the coincidence time resolution over all 128 1×1×1 mm3 crystal elements in the two LSO-PSAPD detectors shows two side lobes. These lobes are the result of multiple interactions in a single array.
Fig. 17.
The top two images show the resulting crystal flood histograms in each of the two opposing detectors (Fig. 7) when events are gated around the negative side lobe from the coincidence time histogram of Fig. 16. Individual crystals are visible in the left crystal array, but blurred in the right crystal array. The bottom two images show that for gating around the positive side lobe, where the reverse is true. These data indicate that the side lobes are the result of multiple interactions in a single array.
C. Lines of Response Backprojection
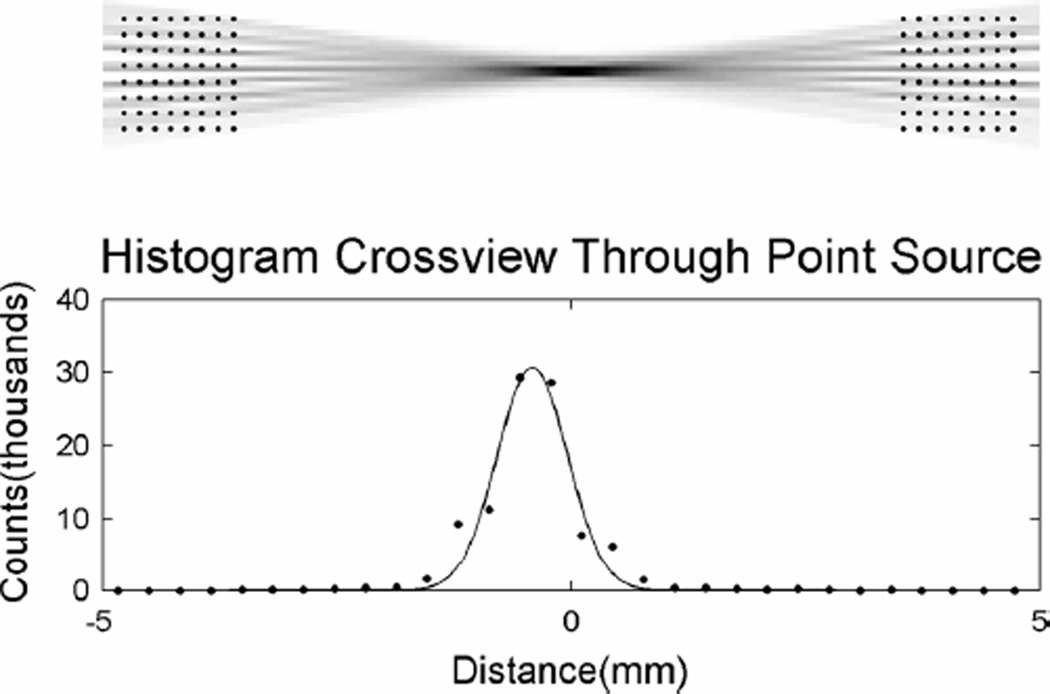
Fig. 18 shows a histogram of the lines of response from the coincidence data backprojected through the space between the two detectors. The data were normalized for varying detector element efficiencies by weighting for the sensitivity of each line of response. The resulting superposition of backprojected lines converge at a point in the middle corresponding to the source position, confirming that most of the coincidence data were trues. The FWHM of a vertical profile from the histogram taken through the point source is 0.90 ± 0.05 mm.
Fig. 18.
Histograms of the backprojected lines of response from the coincidence data with a 0.250-mm-diameter point source with a 0.33 mm pixel/bin size. The bottom plot is a histogram of the lines of response taken from a vertical profile through the center of the image. The raw FWHM is 0.90±0.05 mm (before beam size deconvolution).
IV. Discussion and Observation
A. Optimization With High Randoms Rate
Calibration on a data set with a high randoms rate would significantly slow the convergence of a single-coordinate descent optimization. The attempt to minimize the timing difference of randoms would counteract the minimization of the timing difference of trues. In this case and also in cases of low randoms rates, only data with near zero time difference should be optimized for each coordinate optimization.
For each crystal, or coordinate, the time difference to all others is calculated. This data could be gated to constant window or an adaptive window, so that the optimization could be calculated data with a higher percentage of trues. This could allow for patient data to be used for calibration.
For large quantities of data, only a subset of the data interacting on each crystal, or coordinate, is necessary to be used in the coordinate optimization. This would allow for less calculation per iteration.
B. Variable Coincidence Windows
As seen in Fig. 10, even with calibration, a significant variation in timing FWHM exists between different pairings of channels in the RENA-3 ASIC. For a global system timing window, to ensure trues are not incorrectly removed from noisy lines of response, the timing window would need to be based on the worst line of response. If a smaller timing window is used, the sensitivity weighting of the lines of response would be incorrect.
Given the proximity of the scanner to the body and heart, as well as the low uptake in the breast, a significant percentage of the events will come from out of the field of view. Even when gated for energy and timing, a high percentage of coincidence events will be randoms. Reducing the timing window in lines of response can significantly reduce randoms. A reduction in timing window of 1.4 ns will decrease the randoms on that line of response by 10%.
In order to remove more randoms, an optimum time window could be created for each coincident pair based on the channels it came from. The timing resolution for each channel would be calculated as in Fig. 11 and stored in a lookup table. When a suspected coincidence pair is analyzed, the timing resolution from the individual elements would be summed in quadrature to create the timing window for the line of response. This way randoms can be removed from the data set for better time resolution pairings, while true photon coincidences from poor time resolution pairings are not removed from the data set.
As with individual channels pairs, coincidence time resolutions can be found between individual crystal element pairs. This was not performed with this data set since the point source did not provide lines of response between all individual 1×1×1 mm3 crystal element pairs. This will be done in future work using a larger area source.
C. Timing With Multiple Interactions
The side lobes seen in Fig. 16 are due to multiple interactions inside the array, when a single photon scatters and is absorbed into another 1×1×1 mm crystal element in the same array. The common and spatial signals seen by the RENA-3 system is the sum of the signals of the two interactions.
Since the scatter interactions occur in two different portions of the array, each is subjected to a different RC time delay. The 290 ns shaper of the RENA-3 chip effectively removes the time delay between the signals and the peak detect reads approximately the sum of the two maximums of the signals, yielding a summed energy result appearing in the 511 keV photopeak. The spatial signals will result as a weighted mean of the two interaction locations, with Anger logic resulting in a location as some combination of the interaction locations.
For timing, no shaper is used, and the RC delay of the PSAPD for the two interaction locations is significant. The leading edge discriminator determines timing from the faster event, the one with the lowest RC time delay. The lowest RC time delay is the one nearer to a corner, so this interaction will have its timing recorded.
Since the reported spatial position is between the two interactions and the timing will be from the corner, an inaccurate (too large) time shift correction will be applied. Thus, for multiple interaction events, the timing will always be overcorrected, creating the side peaks. One side peak is from a scatter interaction in one array and the other comes from a scatter interaction in the opposing array.
This is confirmed by looking at the histogram of the acquired event locations for each lobe in each array. From Fig. 17, it is apparent that for the negative lobe, the left array has visible crystals, while the right array does not, as would be expected from an average of multiple interactions. The opposite is true for the positive lobe.
A fraction of such multiple interaction events with interaction locations well-separated on the PSAPD will be removed from the data set with an appropriate timing window, since the delay across the PSAPD is on the order of 20 ns.
V. Conclusion
A number of issues can affect coincidence timing resolution when detecting LSO-PSAPD scintillation detector signals with the RENA-3 ASIC. However, many of these issues are strongly correlated with sources of timing dispersion and can be calibrated out of the system. The system calibration method used was formulated as a convex optimization problem, and by finding the solution, we are able to convert a leading edge discriminator-based ASIC with raw timing variation of tens of nanoseconds into a fast timing data acquisition system appropriate for PET. Correcting data for ASIC time channel delay, PSAPD RC time constant delay, leading edge discriminator time walk, and quadrature timing correlated noise, a paired coincidence timing of less than 7 ns is achieved. Also, with PSAPDs and per crystal time correction, the events with multiple interactions will be removed from the data set.
Acknowledgments
This work was supported by the National Institutes of Health (nih) under Grant r01 ca119056, Grant r01 ca119056-04s1 (arra), Grant r33 eb003283, Grant r01 ca120474. Asterisk indicates corresponding author.
Contributor Information
Paul D. Reynolds, Department of Electrical Engineering, Stanford University, Stanford, CA 94305 USA (paulr2@stanford.edu)..
Peter D. Olcott, Bio-Engineering Department, Stanford University, Stanford, CA 94305 USA..
Guillem Pratx, Department of Electrical Engineering, Stanford University, Stanford, CA 94305 USA..
Frances W. Y. Lau, Department of Electrical Engineering, Stanford University, Stanford, CA 94305 USA..
Craig S. Levin, Departments of Radiology, Physics, and Electrical Engineering, Stanford University, Stanford, CA 94305 USA (cslevin@stanford.edu)..
References
- 1.Zhang J, Olcott PD, Chinn G, Foudray AMK, Levin CS. Study of the performance of a novel 1 mm resolution dual-panel PET camera design dedicated to breast cancer imaging using monte carlo simulation. Med. Phys. 34(no. 2):689–702. doi: 10.1118/1.2409480. [DOI] [PMC free article] [PubMed] [Google Scholar]
- 2.Olcott PD, Lau FWY, Levin CS. Data acquisition system design for a 1 mm3 resolution PSAPD-based pet system, 2007 IEEE Nucl. Sci. Symp. Conf. Rec. 2007:3206–3211. [Google Scholar]
- 3.Levin CS. New imaging technologies to enhance the molecular sensitivity of positron emission tomography. Proc. IEEE. 2008 Mar;96(no. 3):439–467. [Google Scholar]
- 4.Tumer TO, Cajipe VB, Clajus M, Hayakawa S, Volkovskii a. Multi-channel front-end readout IC for position sensitive solid-state detectors. 2006 IEEE Nucl. Sci. Symp. Conf. Rec.; Oct. 29–Nov.4 2006; San Diego, CA. [Google Scholar]
- 5.Li w, Du y, Yanoff BD, Gordon JS. Energy resolution limiting factors of multi-pixel events in 3D position sensitive CZT gamma-ray spectrometer, 2008 IEEE Nucl. Sci. Symp. Conf. Rec. 2008:496–502. [Google Scholar]
- 6.Skelton r. t, Matteson j. l, Cardoso b. Sensitivity-optimized wide-field imaging with a CZT-based coded mask imager, 2008 IEEE Nucl. Sci. Symp. Conf. Rec. 2008:468–471. [Google Scholar]
- 7.Matteson JL, Skelton RT, Pelling MR, Suchy S, Cajipe VB, Clajus M, Hayakawa s, Tumer TO. CZT detectors read out with the RENA-2 ASIC, 2005 IEEE Nucl. Sci. Symp. Conf. Rec. 2005:211–215. [Google Scholar]
- 8.Matteson JL, Capote MA, Skelton RT, Batinica GJ, Stephan E, Rothschild RE, Huszar g, Gasaway T, Pelling MR. A directional gamma radiation spectrometer based on pixelated CZT arrays and coded mask apertures, 2006 IEEE Nucl. Sci. Symp. Conf. Rec. 2006:87–92. [Google Scholar]
- 9.Gu Y, Matteson JL, Skelton RT, Deal AC, Stephan EA, Dut-tweiler f, Gasaway TM, Levin CS. Study of a high resolution, 3-D positioning cross-strip cadmium zinc telluride detector for PET, 2008 IEEENucl. Sci. Symp. Conf. Rec. 2008:3596–3603. [Google Scholar]
- 10.Furuta M, et al. Basic evaluation of a C-shaped breast PET scanner, 2009 IEEENucl. Sci. Symp. Conf. Rec. 2009:2548–2552. [Google Scholar]
- 11.Albuquerque E, et al. Charaterization of the clear-PEM breast imaging scanner performance, 2009 IEEE Nucl. Sci. Symp. Conf. Rec. 2009:3487–3490. [Google Scholar]
- 12.Doshi NK, Silverman RW, Shao Y, Cherry SR. maxPET: A dedicated mammary and axillary region PET imaging system for breast cancer, IEEE Trans. Nucl. Sci. 2001 Jun;78(no. 3):811–815. [Google Scholar]
- 13.Lau FWY, Vandenbroucke a, Reynolds PD, Olcott PD, Horowitz MA, Levin CS. Analog signal multiplexing for psapd-based PET detectors: simulation and experimental validation, Phys. Med. Biol. 2010;55:7149–7174. doi: 10.1088/0031-9155/55/23/001. [DOI] [PMC free article] [PubMed] [Google Scholar]
- 14.Zhang J, Foudray AMK, Olcott PD, Farrell R, Shah K, Levin CS. Performance characterization of a novel thin position-sensitive avalanche photodiode for 1 mm resolution positron emission tomography, IEEE Trans. Nucl. Sci. 2007 Jun;54(no. 3):415–421. [Google Scholar]
- 15.Shah KS, Farrell R, Grazioso R, Harmon ES, Karplus E. Position-sensitive avalanche photodiodes for gamma-ray imaging, IEEE Trans. Nucl. Sci. 2002 Aug;49(no. 4):1687–1692. [Google Scholar]
- 16.Yang Y, Wu Y, Qi J, St. James S, Du H, Dokhale PA, Shah KS, Farrell R, Cherry SR. A prototype PET scanner with DOI-en-coding detectors, J. Nucl. Med. 2008 Jul;49(no. 7):1132–1140. doi: 10.2967/jnumed.107.049791. [DOI] [PMC free article] [PubMed] [Google Scholar]
- 17.Vandenbroucke A, Foudray AMK, Olcott PD, Levin CS. Performance characterization of a new high resolution PET scintillation detector, Phys. Med. Biol. 2010;55:5895–5911. doi: 10.1088/0031-9155/55/19/018. “Performance characterization of a new high resolution PET scintillation detector,” in 2008 IEEE Nucl. Sci. Symp. Conf. Rec., 2008 3604–3608. [DOI] [PMC free article] [PubMed] [Google Scholar]
- 18.Lenox MW, Gremillion T, Miller S, Young JW. Coincidence time alignment for planar pixilated positron emission tomography detector arrays, 2001 IEEE Nucl. Sci. Symp. Conf. Rec. 2001:1952–1954. [Google Scholar]
- 19.Williams JJ. Automated coincidence timing calibration for a PET scanner, 5 272 344. U.S. Patent. 1993 Dec 21;
- 20.Thompson CJ, Camborde M, Casey ME. A central positron source to perform the timing alignment of detectors in a PET scanner, IEEE Trans. Nucl. Sci. 2005 Oct;52(no. 5):1300–1304. [Google Scholar]
- 21.Luo D, Williams JJ, Limkeman MK, Cook MJ, Oswalt EL, Feilen MP, McDaniel DL. presented at the 2002 IEEE Nucl. Sci. Symp. Conf. Norfolk, VA: 2002. Nov, Crystal-based coincidence timing calibration for PET scanner, pp. 10–16. [Google Scholar]
- 22.Mann A, Paul S, Tapfer A, Spanoudaki VC, Ziegler SI. A computing efficient PET time calibration method based on pseudoin-verse matrices, 2009 IEEE Nucl. Sci. Symp. Conf. Rec. 2009:3889–3892. [Google Scholar]
- 23.Spanoudaki VC, McElroy DP, Huisman MC, Ziegler SI. A software based iterative method of improving the system wide timing resolution of the MADPET-II small animal PET tomograph, 14th Int. Conf. Med. Phys. 2005;50:897–898. [Google Scholar]
- 24.Peng H, Olcott PD, Foudray AMK, Levin CS. Evaluation of free-running ADCs for high resolution PET data acquisition, 2007 IEEE Nucl. Sci. Symp. Conf. Rec. 2007:3328–3331. [Google Scholar]


