Abstract
Accurate understanding and modeling of respiration-induced uncertainties is essential in image-guided radiotherapy. Explicit modeling of overall lung motion and interaction among different organs promises to be a useful approach. Recently, preliminary studies on 3D fluoroscopic treatment imaging and tumor localization based on Principal Component Analysis (PCA) motion models and cost function optimization have shown encouraging results. However, the performance of this technique for varying breathing parameters and under realistic conditions remains unclear and thus warrants further investigation. In this work, we present a systematic evaluation of a 3D fluoroscopic image generation algorithm via two different approaches. In the first approach the model’s accuracy is tested for changing parameters for sinusoidal breathing. These parameters included changing respiratory motion amplitude, period, and baseline shift. The effects of setup error, imaging noise and different tumor sizes are also examined. In the second approach, we test the model for anthropomorphic images obtained from a modified XCAT phantom. This set of experiments is important as all the underlying breathing parameters are simultaneously tested, as in realistic clinical conditions. Based on our simulation results for more than 250 seconds of breathing data for 8 different lung patients, the overall tumor localization accuracy of the model in left-right (LR), anterior-posterior (AP) and superior-inferior (SI) directions are 0.1 ± 0.1 mm, 0.5 ± 0.5 mm and 0.8 ± 0.8 mm respectively. 3D tumor centroid localization accuracy is 1.0 ± 0.9 mm.
1. Introduction
Respiration-induced lung motion is a major cause of uncertainty in image-guided radiotherapy (Jiang, 2006; Keall et al., 2006; Vedam et al., 2003). Two-dimensional projection images can be used to account for respiratory motion-based uncertainties in tumor localization (Seppenwoolde et al., 2002). However, these techniques do not provide 3D information about the tumor or normal structures. Recently, there have been significant developments in 3D lung motion modeling (Li et al., 2010; Sohn et al., 2005; Zhang et al., 2007; Zhang et al., 2010). This approach takes into account the inherent correlation among different organs and can effectively capture the overall lung motion. Accurate 3D fluoroscopic imaging captures anatomical variations during radiotherapy treatment has the potential to improve target localization and delivered dose calculations for tumors or normal tissue that move with respiratory motion, and could play an important role in adaptive radiotherapy.
The generation of 3D fluoroscopic images based on single 2D x-ray projection images is comprised of two components. The first component is the creation of a patient specific motion-model based on information available prior to radiotherapy treatment (e.g., 4DCT) (Sohn et al., 2005); (Low et al., 2005; Hertanto et al., 2012). The second component involves the generation of 3D fluoroscopic images by incorporating prior knowledge in the form of the patient-specific lung motion model, with 2D x-ray projection images. Both components introduce variability to the accuracy of generated 3D fluoroscopic images. In the past, there have been efforts to evaluate the accuracy of various motion models based on deformable registration methods (Brock, 2009; Kashani et al., 2008), and initial studies on the performance of 3D fluoroscopic image generation (Li et al., 2010). A complete step-by-step analysis of 3D fluoroscopic image generation remains to be done.
The objective of this work is to systematically evaluate the accuracy of a 3D fluoroscopic image generation algorithm. Since the method incorporates prior knowledge, it is important to test the performance of the algorithm in situations where the patient’s anatomy or motion during treatment varies compared to the imaging used as prior knowledge. The accuracy will be evaluated under conditions of changing breathing period, breathing amplitudes, baseline tumor positions, patient setup errors, imaging noise, and tumor sizes. The evaluation is first carried out by varying these parameters for a sinusoidal breathing pattern, as the effect of individual changing parameters can be analyzed. The evaluation is then extended to measured 3D (irregular) patient tumor motions. The data for irregular breathing is based on data from 8 lung patients and is generated using a modified anthropomorphic XCAT phantom (Berbeco et al., 2005; Mishra et al., 2012). A major advantage of using the digital XCAT phantom is the access to ground truth anatomy and tumor motion. The two error metrics used to evaluate the model are tumor localization error and normalized root mean squared error for the entire volume.
Evaluating the 3D fluoroscopic image generation algorithm for irregular patient breathing patterns is of critical importance. The lung motion model is built from 4DCT training data, thus essentially information corresponding to only one breathing cycle is used as prior knowledge. While this may not be a problem for regular, periodic breathing patterns, irregular patterns pose a challenge for accurate 3D image generation. Evaluation using real patient tumor trajectories will allow assessment of the algorithm’s performance under realistic situations and is a necessary step in determining its potential clinical utility.
2. Methods and Materials
2.1 Modified XCAT phantom
The non-uniform rational B-spline (NURBS)-based 4D eXtended CArdiac-Torso (XCAT) phantom (Segars et al., 2010) is a flexible and realistic hybrid digital phantom. The XCAT phantom uses a model for respiratory mechanics involving motion of diaphragm, liver, stomach, spleen, thoracic cage and lungs (Segars et al., 2001). According to this model, anterior-posterior (AP) and superior-inferior (SI) motion of the lung is governed by chest wall and diaphragm motions, respectively. This phantom generates 3D imaging data with regular breathing cycles. (Mishra et al., 2012) modified the existing XCAT phantom to include irregular breathing cycles based on recorded patient tumor trajectories (Berbeco et al., 2005). In this work, we use the realistic 4DCT data generated from the modified XCAT phantom to carry out experiments for evaluation of the 3D fluoroscopic image generation and tumor localization model. Typical sagittal and coronal slices of 4DCT data corresponding to 5 different phases from the modified XCAT phantom are shown in Figure 1.
Figure 1.

Sagittal and Coronal slices from the modified XCAT phantom created using measured patient tumor motion data.
2.2 Patient Data
The 3D patient tumor trajectories used in this work were acquired using the Mitsubishi Real-time Radiation (RTRT) system in the Radiation Oncology Clinic at the Nippon Telegraph and Telephone Company in Sapporo, Japan. Patient data was taken using simultaneously acquired stereoscopic images of 1.5 mm gold fiducial markers in the lung tumors. The data acquisition rate is 30 Hz. Patients in this study were not breath coached. The acquired data only indicates 3D tumor centroid position for each time step which is then used to generate 3D images as described in section 2.1. For a detailed description regarding patient data acquisition, see (Shirato 2000, Berbeco 2005).
2.3 Definition of terms used
Before describing 3D lung motion model and the experimental setup for its evaluation, we would like to introduce some of the key terms used in the paper.
Reference image
The reference phase of (simulated) 4DCT to which each other 4DCT phase is registered. The patient-specific 3D lung motion model (described in section 2.4) is based on DVFs derived from deformable image registration. These DVFs must be defined relative to a reference image. The end-of-exhale 4DCT phase is chosen as the reference in this work.
Generated 3D fluoroscopic images
The final resultant images of the image generation algorithm. The goal of the algorithm tested in this study is to generate 3D fluoroscopic images based on prior knowledge from 4DCT and measured 2D projection images. Generated 3D fluoroscopic images are time-varying 3D images.
For brevity, in figures 3D fluoroscopic images are referred to as fluoroscopic images.
Figure 3.
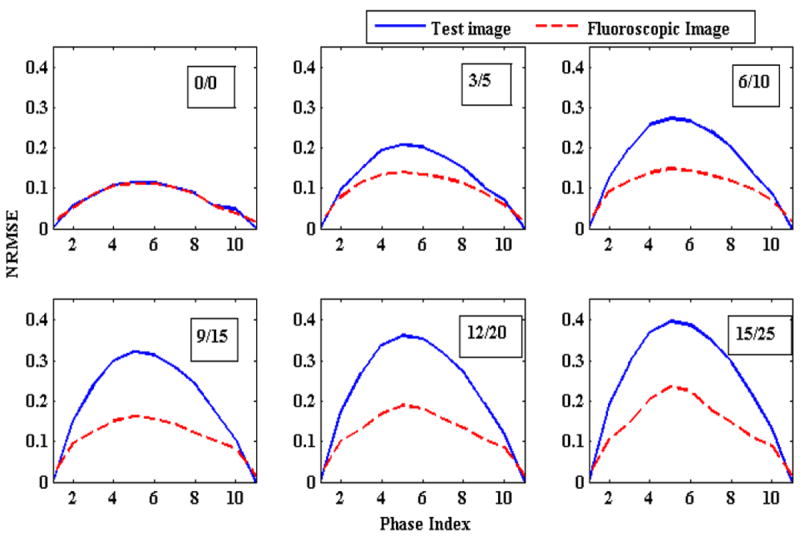
Change in NRMSE as the magnitude of chest wall and diaphragm (and thus tumor) motions are varied. The numbers in the boxes represent magnitude of AP/SI motions in mm. Solid blue lines represent the NRMSE between the reference image and the ground truth 3D images (initial NRMSE). Broken red lines show NRMSE between generated 3D fluoroscopic images and the ground truth image (final NRMSE). The gap between these two curves represents that generated 3D fluoroscopic images are closer to the ground truth 3D images than the initial 3D reference images (improved accuracy). In an ideal scenario the broken red line will be flat representing zero error between generated 3D fluoroscopic images and ground truth images.
Ground truth 3D images/ test images
3D images representing the actual positions of anatomy/tumor at a given time. These are generated using the XCAT software, and compared to the generated 3D fluoroscopic treatment images to assess the accuracy of the image generation algorithm. The advantage of using modified XCAT phantom is that it gives exact voxel locations and their movements corresponding to different phases of a breathing cycle.
For brevity, in figures ground truth test images are referred to as test images.
2D projection treatment images
2D projections images “measured” during treatment using an on-board imager (i.e., gantry-mounted kilo-voltage imager). In this work, 2D projection treatment images are simulated using the XCAT phantom’s ground truth 3D images.
Optimization DRR
The 2D image created by applying the projection operator to the deformed reference image in the iterative optimization scheme (eq. 2). This image is used for comparison to the 2D projection treatment images.
2.4 3D fluoroscopic image generation algorithm
(Sohn et al., 2005) modeled inter-fractional deformation of adjacent organ structures in CT images using eigenvector decomposition. A PCA-based method was subsequently used by (Zhang et al., 2007a) for estimating the thoracic tumor and normal lung tumor motion for non-repeatable breathing patterns. This demonstrated that a model based on only a few PCA coefficients could capture variations in respiratory motion. This work was extended in (Li et al., 2010) to generate 3D fluoroscopic images from 2D treatment images via cost function optimization. A brief description of the PCA motion model followed by 3D fluoroscopic image generation is given as follows:
2.4.1. Principal Component Analysis (PCA) based lung motion model
To capture the spatiotemporal evolution of lung motion a set of displacement vector fields (DVFs) are calculated via deformable image registration between each 3D image (corresponding to different phases) and a reference image. These DVFs can be compactly represented by only a few (2-3) eigenvectors. Based on the lung motion model, a DVF for any possible motion state t can be approximated by adding a mean DVF and a linear weighted combination of eigenvectors:
| (1) |
where is the mean DVF, un are the basis eigenvectors, wn(t) are the eigen-coefficients (or weight vectors), and n is the number of eigenvectors used. In our model, N =3, i.e., 3 eigenvectors are used for the lung motion model. 3D fluoroscopic image for a given DVF and a reference image can be calculated by using a suitable 3D interpolation technique (e.g., 3D linear interpolation).
The key characteristic of PCA based eigenvector decomposition is that spatiotemporal information in DVFs is separated into spatial and temporal components. PCA coefficients wn(t) are time dependent whereas and eigenvectors un are space-dependent. Generating 3D fluoroscopic images thus becomes dependent on a small set of time-dependent eigen-coefficients wn(t).
2.4.2. Optimization-based 3D Fluoroscopic images
A new 3D fluoroscopic image can be generated by optimizing coefficients wn(t) in the PCA lung motion model. These weight vectors are iteratively calculated such that the optimization DRR for the reference image f0 matches the 2D projection treatment image x. This is achieved by minimizing following cost function:
| (2) |
where J(w) is the objective function representing squared L2-norm of the error between 2D projection treatment image x and the optimization DRR of the 3D image f (obtained from deforming the reference image f0). The relative pixel intensity between optimization DRR and 2D projection treatment image is represented by λ. P is the projection matrix (Siddon, 1985) that computes the optimization DRR for a 3D image f on the x-ray detector. The imager has a physical size of 40 × 30 cm2. The resolution of 2D projection treatment image was sampled down to a resolution of 200 × 150 (2 × 2 mm2). The dot between P, f and λ, x represents a dot product. A typical optimization DRR is shown in Figure 2.
Figure 2.
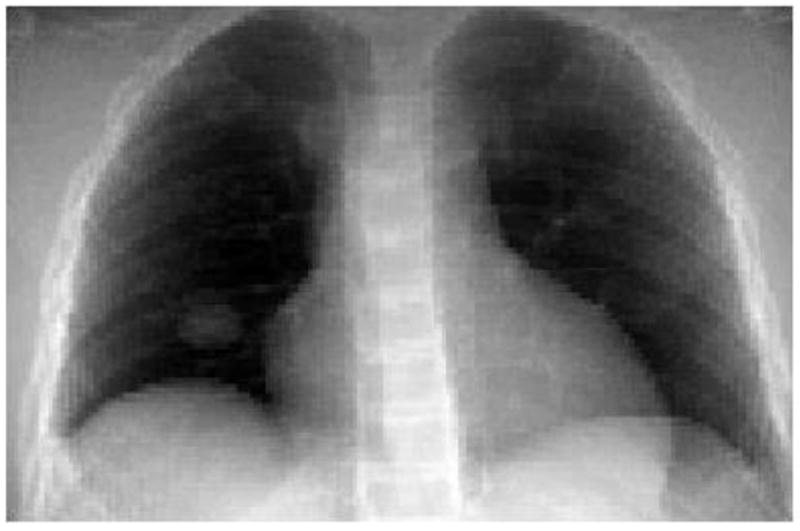
A typical digitally reconstructed radiograph (DRR) based on Siddon’s algorithm at an imager angle of 0° The DRR is created for a tumor in the right lung.
2.5 Experimental design
The 3D fluoroscopic image generation algorithm is evaluated based on: 1) systematically varying parameters for a sinusoidal breathing pattern; and 2) measured patient tumor motions. These evaluations are carried out on images generated from the modified XCAT phantom. The resolution of generated 3D fluoroscopic images is 2, 2, 2.5 mm in x, y and z directions. The size of 3D images containing entire volume is 256×256×120. The details of each experiment are described below.
Tumor location influences the diaphragm and chest wall motion and hence the production of modified XCAT data. The tumor motion is inversely related to the distance from both the chest wall and diaphragm motion (Segars et al., 2010). In these experiments tumor is located close to both chest wall and diaphragm. Thus chest wall, diaphragm and tumor motion are almost equal.
2.5.1 Experiments based on variations in sinusoidal breathing
3D training images for all experiments related to sinusoidal breathing (except varying chest wall and diaphragm motion experiments) were generated for an amplitude of 2 cm in superior-inferior (SI) direction and 1.2 cm in the anterior-posterior (AP) direction. These 3D images were generated for a breathing period of 5 s. Corresponding SI and AP amplitudes values for varying chest wall and diaphragm motion experiments were 1 cm and 1.2 cm. The reasoning for these values is explained in section 3.1.1. All images included default XCAT heart motion.
Varying magnitude: The magnitude of diaphragm motion is varied from 0 cm to 3 cm and 0 to 1.8 cm for the chest wall motion. Diaphragm motion is incremented by 0.5 cm. Chest wall increments are 0.3 cm.
Changing breathing period: The breathing period was varied from 3 to 8 s at an interval of 1 s.
Baseline Shift: The diaphragm and tumor “home” positions were shifted from 0 cm to 3 cm at increments of 0.5 cm. The chest wall motion was kept constant.
Setup error: The isocenter was shifted by 0.5 cm in the SI direction.
Imaging noise: The algorithm was tested for Poisson noise of high and low doses. High dose (low noise) 2D projection treatment images were generated for 200,000 photons per detector and low dose (high noise) 2D projection treatment images were generated for 25,000 photons per (Evans et al., 2011; Whiting et al., 2006) detector.
Different tumor sizes: Tumor diameters were varied from 10 mm to 30 mm at an increment of 5 mm.
2.5.2 Experiments based on patient tumor trajectories
Modified XCAT phantom was used to generate 4DCT training and test data from recorded tumor trajectories (section 2.2). A total of 8 patients’ tumor trajectories were used for XCAT phantom generation. For each patient the first breathing cycle was used for creating patient-specific lung motion models and next 10 breathing cycles were used for producing test data. Each breathing cycles was sampled to produce 10 phases of 4DCT data.
2.6 Error metrics
Performance of the generation model is measured by two error metrics:
-
3D fluoroscopic image generation accuracy: The first error metric evaluates the 3D fluoroscopic image generation accuracy by calculating normalized root mean square error (NRMSE), which is defined as follows:
where f is the generated 3D fluoroscopic image and f* is the ground truth test images obtained from modified XCAT phantom. Here i represent the voxel index. NRMSE measures the voxel-wise difference in intensities of the two images. The overall number of voxels covering entire lung is equal to 256×256×120.(3) In this manuscript, NRMSE error between reference image and ground truth test images is referred as “initial NRMSE” whereas the NRMSE between generated 3D fluoroscopic image and ground truth test image is referred as “final NRMSE”. An improvement in NRMSE means that final NRMSE is less than initial NRMSE. In other words improvement means the generated 3D fluoroscopic image more closely matches the ground truth test images.
-
Tumor localization accuracy: The second error metric evaluates how accurately the tumor position is represented in the 3D fluoroscopic images. Localization accuracy is determined by calculating LR, AP, SI and 3D positions of the tumor centroid for different time indices and comparing it with the location obtained from ground truth test images.
Centroid tumor positions in generated 3D fluoroscopic images are determined by deformation inversion. DVFs to generate 3D fluoroscopic images in eq. 2 are defined on the coordinates of new image f. To determine how each voxel (and centroid) in the reference image f0 has moved push-forward DVFs on the coordinates of reference image need to be calculated. Push-forward DVFs tell how to warp the reference image to the generated 3D fluoroscopic image. “Pull-backward” DVFs tell how to warp the generated 3D fluoroscopic image back to the reference image. Since the DVFs are sampled discretely (due to finite voxel size), some approximation is required when inverting from one type of DVF to another. Our algorithm calculates pull-backward DVFs, but we need push-forward DVFs to determine the motion of voxels in the reference image’s coordinate system. To calculate DVFs on reference image coordinates, we used an efficient fixed-point algorithm for deformation inversion as described in (Chen et al., 2008). These push-forward DVFs with tri-linear interpolation are used to determine movement of individual voxels and thus define the centroid positions in the generated 3D fluoroscopic images.
3. Results
3.1 Controlled evaluation of varying sinusoidal breathing
3.1.1 Varying chest wall and diaphragm motion
In this section changes in 3D fluoroscopic image generation accuracy as a function of varying chest wall and diaphragm (and thus AP and SI tumor) motion amplitudes was evaluated. This experiment represents situations where a patient’s breathing amplitude changes between 4DCT acquisition (used to build the PCA lung motion model) and treatment. Changes in 3D fluoroscopic image generation accuracy are shown by NRMSE lines in Figure 3. It can be observed that the algorithm always improves upon the initial error but as the magnitudes of the two motions are increased the gain in final accuracy decreases. One of the reasons for differences between generated 3D fluoroscopic image and ground truth 3D test images is heart motion, which is not explicitly modeled by the PCA lung motion model.
The effect of varying amplitude on tumor localization accuracy is shown in Figure 4. The plots in these figures show the localization accuracy in the LR, AP and SI directions. Blue lines show tumor locations in ground truth test images while the broken red lines show tumor locations in the generated 3D fluoroscopic images. Two adjacent broken red and solid blue lines represent the tumor locations for same amplitudes. It can be observed that the tumor locations in the generated 3D fluoroscopic images closely follow the ground truth locations in all the three directions. As mentioned in section 3.1, to evaluate the localization accuracy with changing magnitudes the model is trained for 1 cm diaphragm motion and 0.6 cm chest wall motion. This is represented by the second line (bold blue line) in all the three cases. The corresponding red line is also in bold. There is small increase in localization error when magnitudes are varied in the either directions. The exact localization accuracy is shown in Table 1.
Figure 4.
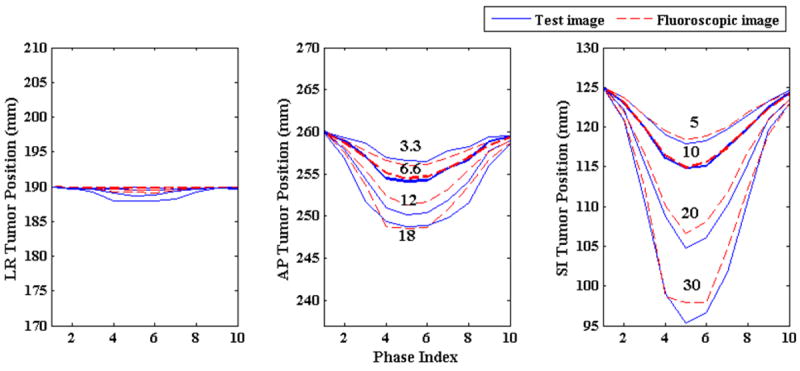
Tumor centroid positions in ground truth 3D image (solid blue line) vs. tumor positions in generated 3D fluoroscopic images (broken red line) with changing diaphragm and chest wall motion amplitudes. The numbers in the middle and right plots represent magnitude of chest wall (middle) and diaphragm (right) motions in mm for the adjacent solid blue lines. In all three directions tumor centroid positions in the generated 3D fluoroscopic images match tumor positions in the ground truth 3D images very closely. There is a small loss in tumor localization accuracy as the amplitudes vary.
Table 1.
Changes in chest wall (AP) and diaphragm (SI) motion amplitudes and their effects on tumor localization accuracy. The first two columns show the two motions being varied in tandem and the next three columns show tumor localization errors in each direction. The last column depicts 3D error in tumor centroid position. The result for training data is shown in bold. Localization errors are means taken over the phase indexes, with corresponding standard errors.
| Magnitude (mm) | Localization error (mm) | ||||
|---|---|---|---|---|---|
| SI | AP | LR | AP | SI | 3D |
|
| |||||
| 5 | 3.3 | 0.1 ± 0.1 | 0.5 ± 0.3 | 0.3 ± 0.2 | 0.5 ± 0.4 |
|
| |||||
| 10 | 6.6 | 0.2 ± 0.1 | 0.3 ± 0.2 | 0.2 ± 0.2 | 0.4 ± 0.3 |
|
| |||||
| 15 | 9.9 | 0.2 ± 0.1 | 0.6 ± 0.6 | 0.3 ± 0.4 | 0.8 ± 0.7 |
|
| |||||
| 20 | 12 | 0.4 ± 0.3 | 0.8 ± 0.6 | 1.0 ± 0.8 | 1.3 ± 1.1 |
|
| |||||
| 25 | 15 | 0.5 ± 0.5 | 0.8 ± 0.8 | 1.2 ± 1.2 | 1.5 ± 1.5 |
|
| |||||
| 30 | 18 | 0.7 ± 0.5 | 0.8 ± 0.7 | 1.1 ± 1.1 | 1.5 ± 1.4 |
3.1.2 Varying respiratory period
Next, the impact of changing respiratory period on the 3D fluoroscopic image generation and tumor localization was evaluated. Breathing cycle periods were varied from 3 to 8 s at an increment of 1 s. Magnitudes of AP and SI motion in all these cases were kept at 1.2 cm and 2 cm, respectively. The 3D fluoroscopic image generation accuracy (NRMSE) is shown in Figure 5 and the tumor localization accuracy is shown in Figure 6. 3D fluoroscopic image generation and tumor localization accuracies remain constant and are independent of respiratory period. This is expected as the PCA lung motion model decouples (eq. 1) the spatial and temporal component of the lung motion captured by the DVFs. As long as the DVFs accurately capture the underlying motion state, the approximation to any time instance t can be accurately calculated.
Figure 5.
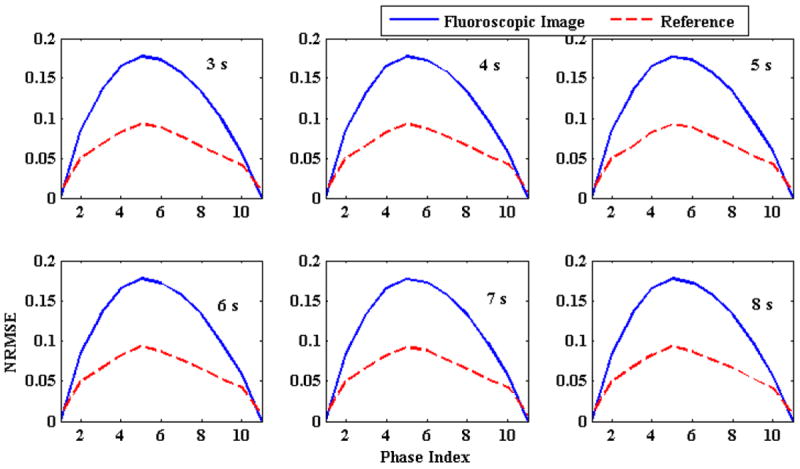
Comparison of NRMSE with changing breathing period. Solid blue lines represent initial NRMSE error while broken red lines show final NRMSE. The number in the upper right corner of each plot shows breathing period. NRMSE is independent of breathing period
Figure 6.
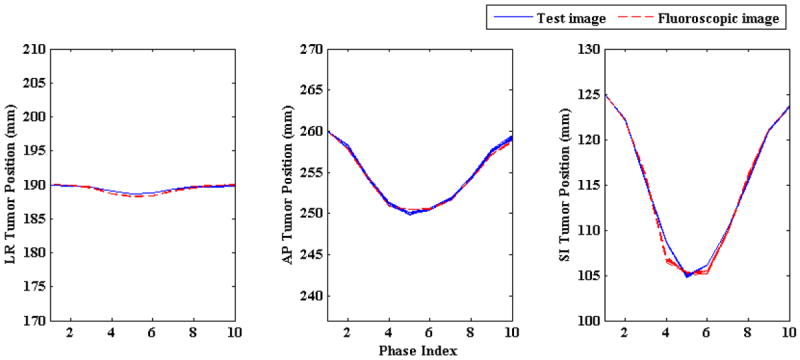
Tumor centroid positions in ground truth test images (solid blue line) vs. tumor centroid positions in generated 3D fluoroscopic images (broken red line) with changing breathing period. Irrespective of changing breathing period broken red lines are closely followed by solid blue lines in all three LR, AP, and SI directions. Tumor trajectories for different breathing periods overlap each other as the magnitudes of AP and SI directions were kept constant while the breathing period was changed (hence “thicker” solid blue and broken red lines).
3.1.3 Varying Baseline Shift
This section simulates the errors induced if the baseline position of a tumor’s motion changes between 4DCT acquisition (used to generate the PCA model) and treatment. In this experiment, the baseline tumor position is shifted from 0 to 3 cm in increments of 5 mm. 3D fluoroscopic image generation accuracy with the changing baseline is shown in Figure 7. In this figure solid blue lines represent initial NRMSE and broken red lines represent final NRMSE. Plots in figure 7 correspond to different baseline shifts introduced in the SI direction. The numbers in the top right corner show the magnitude of baseline shift in mm. The default SI motion is 2 cm. Hence the first plot corresponds to 2cm plus the baseline shift shown in the plot. From the gap between these two lines in this figure, it can be observed that the model is able to improve upon the generation accuracy (NRMSE) for different baseline shifts.
Figure 7.
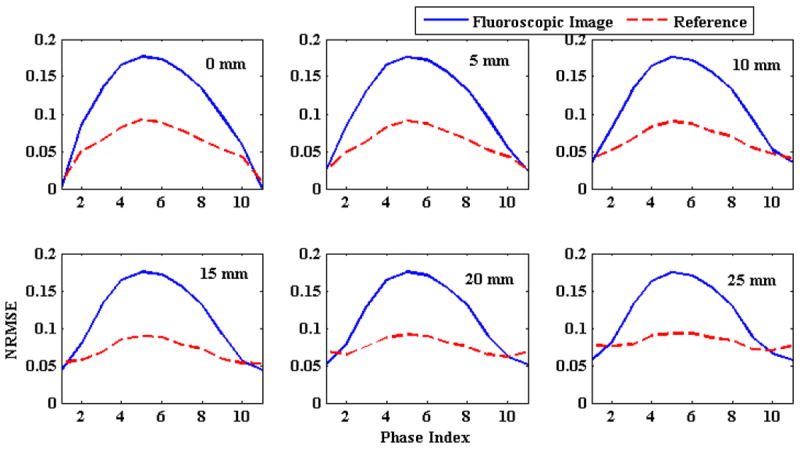
Comparison of NRMSE errors with shifting baseline. Solid blue lines represent initial NRMSE and broken red lines represent final NRMSE. The number in the upper right corner of each plot shows the baseline shift introduced in the SI direction.
Tumor localization accuracies with changing baseline shifts are shown in Figure 8. Tumor centroid positions in generated 3D fluoroscopic images follow tumor trajectories in ground truth test images closely, but some accuracy is lost in the AP direction. This is due to the fact that for ground truth 3D images baseline shifts are introduced only in SI directions. This disrupts the correspondence between SI and AP motion on which the model is trained. The localization accuracy in all three LR, AP and SI directions and 3D are shown in Table 2.
Figure 8.
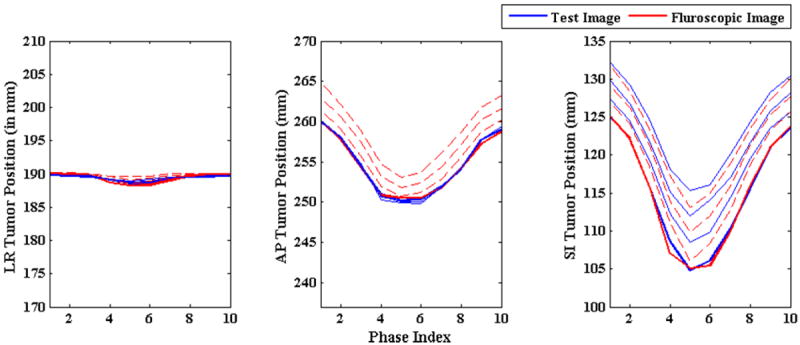
Tumor centroid position in ground truth 3D images (solid blue line) vs. tumor centroid positions in generated 3D fluoroscopic images (broken red line) with varying baseline shift. Tumor localization accuracy in AP direction drops due to introduction of baseline shift in SI direction only. This disrupts the relationship between SI and AP direction as explained in section 3.1.3.
Table 2.
Tumor localization accuracy with varying baseline shift. The baseline shift was introduced in SI direction. The default motion in SI direction is 2 cm. The first row (bold) corresponds to the default AP and SI motion as baseline shift is 0 mm. The first column shows the baseline shift added to the default SI motion. The last column shows the 3D localization error for the tumor centroid.
| SI baseline shift (mm) | Localization error (mm) | |||
|---|---|---|---|---|
| LR | AP | SI | 3D | |
|
| ||||
| 0 | 0.2 ± 0.1 | 0.2 ± 0.1 | 0.4 ± 0.5 | 0.5 ± 0.5 |
|
| ||||
| 5 | 0.2 ± 0.2 | 0.3 ± 0.2 | 0.6 ± 0.6 | 0.7 ± 0.7 |
|
| ||||
| 10 | 0.3 ± 0.1 | 0.7 ± 0.3 | 0.7 ± 0.7 | 1.0 ± 0.7 |
|
| ||||
| 15 | 0.2 ± 0.1 | 1.1 ± 0.3 | 1.0 ± 0.8 | 1.5 ± 0.8 |
|
| ||||
| 20 | 0.2 ± 0.1 | 1.7 ± 0.4 | 0.9 ± 0.7 | 1.9 ± 0.8 |
|
| ||||
| 25 | 0.3 ± 0.1 | 2.0 ± 0.3 | 0.8 ± 0.7 | 2.2 ± 0.7 |
|
| ||||
| 30 | 0.3 ± 0.1 | 2.5 ± 0.3 | 1.0 ± 0.7 | 2.7 ± 0.8 |
3.1.4 Setup error
To simulate patient positioning/setup error, the projection images for ground truth test images were generated by shifting the isocenter superiorly by 5 mm. The setup error for regular breathing test data for 10 different phases in LR, AP and SI directions are shown in Table 3. Tumor localization errors in all three directions confirm that setup error is a potentially major source of error. Possible ways to remedy setup error are considered in the discussion.
Table 3.
Tumor localization errors (in mm) due to setup error. The setup error is introduced by shifting the isocenter superiorly by 5 mm. Localization errors here are reported for 10 phases of one breathing cycle. The errors in LR, AP and SI direction are reported in the 2nd, 3rd and 4th column. The last column shows the 3D localization error.
| Phase # | LR (mm) | AP (mm) | SI (mm) | 3D(mm) |
|---|---|---|---|---|
| 1 | 0.0 | 1.7 | 2.7 | 3.2 |
| 2 | 0.3 | 2.2 | 3.2 | 3.9 |
| 3 | 0.3 | 1.2 | 0.3 | 1.3 |
| 4 | 1.1 | 0.9 | 3.8 | 4.0 |
| 5 | 0.5 | 0.6 | 1.3 | 1.5 |
| 6 | 0.9 | 0.7 | 2.9 | 3.1 |
| 7 | 0.6 | 1.0 | 0.2 | 1.2 |
| 8 | 0.5 | 1.2 | 0.6 | 1.4 |
| 9 | 0.0 | 1.9 | 2.0 | 2.8 |
| 10 | 0.1 | 2.1 | 3.0 | 3.7 |
3.1.5 Imaging noise
In this section we analyze the effects of increased imaging noise (Evans et al., 2011) characterized the incident photon fluence and thus account for imaging noises in 2D projection treatment images. In this work, we used low dose (high noise) of 25, 000 photons per detector and high dose (low noise) 200,000 photons per detector to mimic noisy 2D projection images. 2D projection images containing low and high Poisson noise is shown in figure 9.
Figure 9.
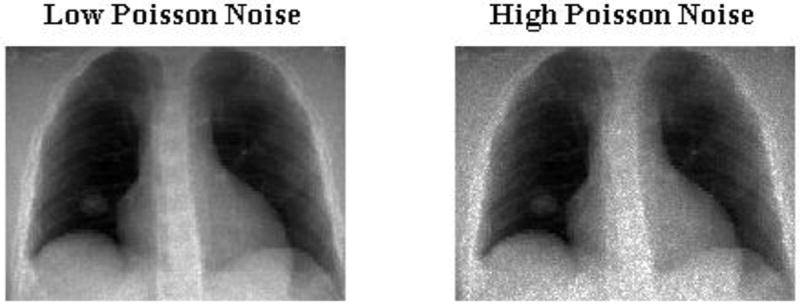
2D projection images with Low and High Poisson noise. Low Poisson noise was generated for a incident photon fluence of 200, 000 photons per detector and high Poisson noise was detected for 25, 000 photons per detector.
Figure 10 shows the reconstruction accuracy of the algorithm for low and high imaging noise. In this figure blue lines shows initial NRMSE and broken red lines show the final NRMSE. In both the cases algorithm improves 3D fluoroscopic image generation accuracy. The tumor centroid positions of ground truth 3D images (solid blue line) and generated 3D fluoroscopic (broken red lines) images for LR, AP, SI directions are shown in figure 11. The two tumor trajectories follow each other closely. The tumor trajectories for low and high noise case are almost same, confirming the robustness of the algorithm in the presence of varying imaging noise.
Figure 10.
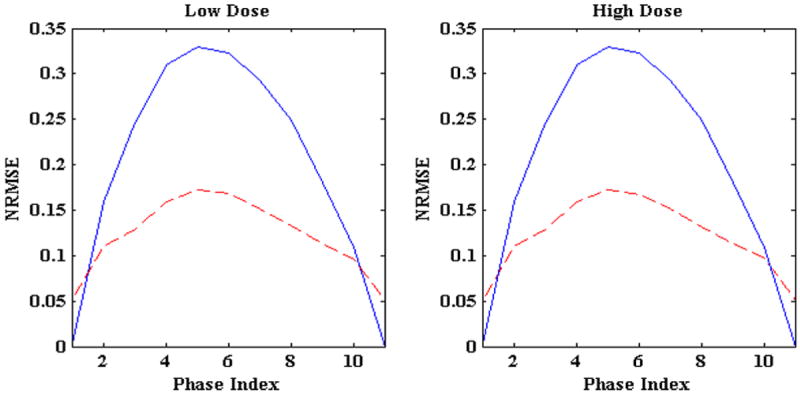
NRMSE for low and high Poisson noise 2D projection treatment images. Solid blue lines represent the initial NRMSE while broken red lines show final NRMSE
Figure 11.
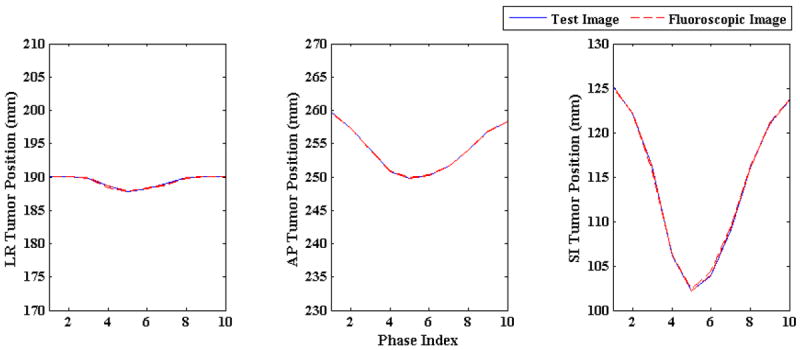
Tumor centroid positions in ground truth 3D images (solid blue line) vs. tumor trajectories in generated 3D fluoroscopic images (broken red line) for low and high imaging noise The tumor trajectory in generated 3D fluoroscopic images closely follow the tumor trajectory in test images in LR, AP, and SI directions. The tumor trajectories in reconstructed 3D fluoroscopic images overlap each other which shows the robustness of model to different imaging noises
3.1.6 Varying tumor size
Tumors of diameters from 10 to 30 mm (at an increment of 5 mm) were used to test the tumor localization accuracy capability of the algorithm for varying tumor sizes. The tumor localization results are shown in figure 12. Tumor trajectories in the reconstructed 3D fluoroscopic images (broken red lines) closely follow the tumor trajectories in the ground truth 3D images (solid blue line). It can be noted that there is virtually no difference in localization accuracy in LR, AP, and SI directions with changing tumor diameter.
Figure 12.
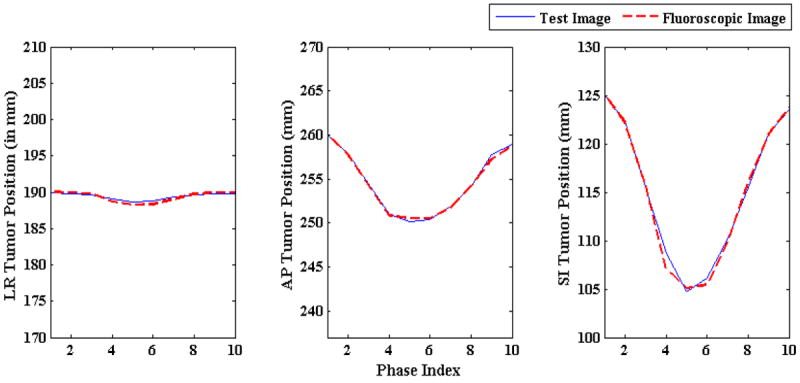
Tumor centroid positions in ground truth 3D images (solid blue line) vs. tumor centroid positions in generated 3D fluoroscopic images (broken red line) for varying tumor sizes.
3.2 Evaluation on patient data
In this section, the 3D fluoroscopic image generation algorithm is evaluated with XCAT phantom data generated from measured 3D patient tumor trajectories (described in section 2.2). For each patient first breathing cycle was used for building PCA lung motion model and then 100 2D treatment projection images spanning over approximately 30 s were used for testing the algorithm. In total, 8 patients were used to test the accuracy of 3D fluoroscopic image generation model and its tumor localization accuracy. Thus 800 3D images were generated and were tested for NRMSE and tumor localization accuracy.
The 3D fluoroscopic image generation errors for two patients are shown in the figure 13. 3D fluoroscopic image generation accuracies for all 8 patients are shown in table 4. Tumor localization for a total of 8 patients is shown in figure 14. The localization accuracy is shown for all the three directions: LR, AP and SI. The centroid positions are plotted in mm. The tumor motion in the generated 3D fluoroscopic images follows the ground truth test images closely in all three directions.
Figure 13.
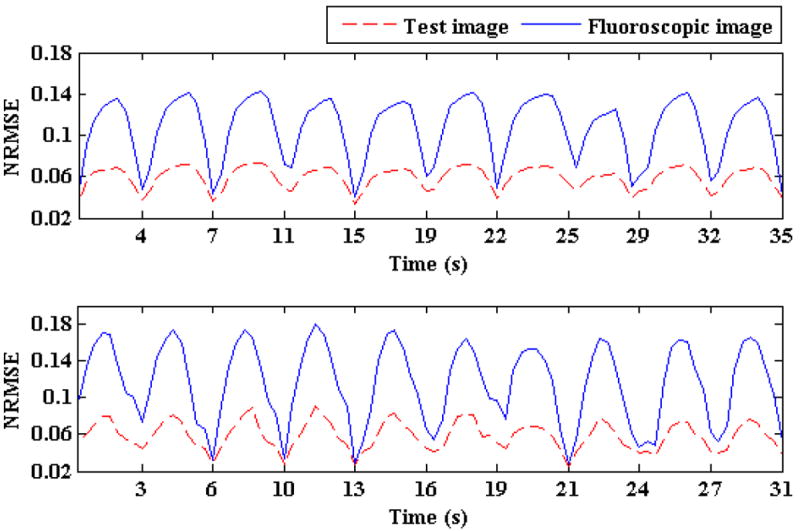
NRMSE for two patients for approximately 30 s is shown. Solid blue lines represent the initial NRMSE and broken red lines show final NRMSE
Table 4.
Comparisons of NRMSE after 3D fluoroscopic image generation. The second columns show NRMSE between the reference image and ground truth 3D images (initial NMRSE), while the 3rd column shows NRMSE between the ground truth 3D images and generated 3D fluoroscopic images (final NMRSE).
| Patient # | Initial NRMSE | Final NRMSE |
|---|---|---|
| 1 | 0.10 ± 0.04 | 0.05 ± 0.02 |
| 2 | 0.08 ± 0.04 | 0.05 ± 0.02 |
| 3 | 0.06 ± 0.03 | 0.04 ± 0.01 |
| 4 | 0.07 ± 0.04 | 0.04 ± 0.02 |
| 5 | 0.09 ± 0.05 | 0.06 ± 0.02 |
| 6 | 0.10 ± 0.05 | 0.06 ± 0.03 |
| 7 | 0.12 ± 0.05 | 0.08 ± 0.04 |
| 8 | 0.09 ± 0.05 | 0.06 ± 0.03 |
Figure 14.
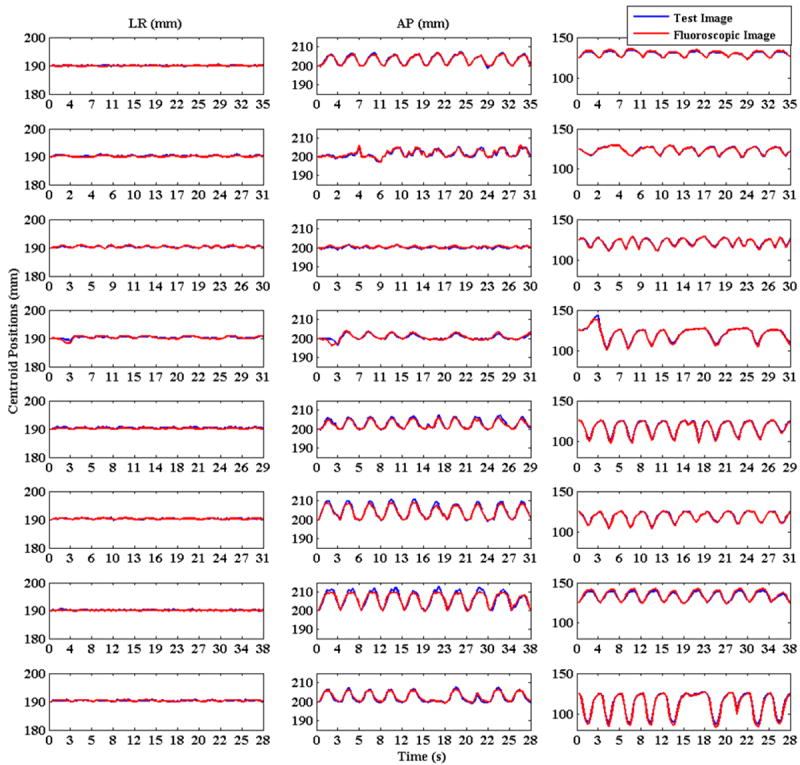
Tumor centroid positions for 8 patients are shown. Solid blue lines show tumor centroid positions for ground truth 3D images while the broken red lines show tumor centroid positions for generated 3D fluoroscopic images.
The localization error mean and standard deviation for all of the patients are shown in table 5. The last row in this table reports the overall localization error in all three dimensions and also the overall value for 3D accuracy. All the errors are in the order of 1-2 pixels.
Table 5.
Tumor localization accuracy for individual patients and their standard deviations are shown here. The last column shows the root mean square error for the tumor 3D position. The overall tumor localization accuracy across the population is shown in the last row of the table.
| Patient # | LR (mm) | AP (mm) | SI (mm) | 3D (mm) |
|---|---|---|---|---|
| 1 | 0.1 ± 0.1 | 0.4 ± 0.3 | 0.7 ± 0.5 | 0.7 ± 0.6 |
| 2 | 0.2 ± 0.1 | 0.6 ± 0.4 | 0.4 ± 0.3 | 0.7 ± 0.5 |
| 3 | 0.1 ± 0.1 | 0.4 ± 0.3 | 0.6 ± 0.5 | 0.7 ± 0.5 |
| 4 | 0.2 ± 0.2 | 0.4 ± 0.5 | 0.7 ± 0.1 | 0.9 ± 1.0 |
| 5 | 0.2 ± 0.1 | 0.5 ± 0.5 | 0.9 ± 0.6 | 1.1 ± 0.8 |
| 6 | 0.1 ± 0.1 | 0.6 ± 0.6 | 0.5 ± 0.4 | 0.8 ± 0.7 |
| 7 | 0.1 ± 0.1 | 0.9 ± 0.7 | 1.3 ± 0.8 | 1.6 ± 1.1 |
| 8 | 0.2 ± 0.1 | 0.5 ± 0.3 | 1.4 ± 1.1 | 1.5 ± 1.2 |
| Overall | 0.1 ± 0.1 | 0.5 ± 0.5 | 0.8 ± 0.8 | 1.0 ± 0.9 |
4 Discussion
We presented a detailed evaluation of a 3D fluoroscopic image generation algorithm. The evaluation was done in two stages. First a systematic set of experiments were carried out on varying sinusoidal breathing patterns and second, the model was tested using recorded patient tumor motions. In the first stage the effects of changes in amplitude, period, baseline shift, setup error, imaging noise, and tumor size were analyzed. This set of experiments provides insight into the behavior of the image generation model under isolated and well-defined settings. In the second set of experiments, measured patient 3D tumor trajectories are used to test the model. For each of the 8 patients, 100 3D images, spanning over approximately 30 s, were used. The overall accuracy of tumor localization is on the order of 1 pixel (1.0 ± 0.9 mm). For patient data, all of the underlying variables are tested simultaneously and the overall error is a cumulative result of these parameters. Our result is comparable to the markerless tumor tracking results of 1-2 mm accuracy reported in (Cui et al., 2007; Rottmann et al., 2010; Xu et al., 2008).
Patient 4 in figure 14 is a good example for highlighting the robustness of the 3D fluoroscopic image generation algorithm. The SI motion for patient 4 (row 4, column 3) shows a baseline shift (first breath vs. second breath) as well as varying breathing periods (fourth breath vs. fifth breath). In both cases the tumor position is accurately represented in the 3D fluoroscopic image, corroborating the results from the set of experiments conducted on the sinusoidal breathing cases (section 3.1).
This work can be extended in a few directions. The PCA lung motion model uses eigenvectors as basis function and assumes Gaussian probability distribution. The model could be extended to include a more generalized basis function decomposition e.g., independent component analysis (ICA) (Comon, 1994; Hyvarinen and Oja, 2000). Another direction to investigate will be image generation based on MV projections.
Incorporating 4D-CBCT into the image generation algorithm is an important next step. Setup error can cause significant errors in tumor localization (Section 4.1.4). These errors could be eliminated or greatly reduced by using 4D-CBCT acquired from the patient immediately before treatment (in treatment position) to generate the motion model. This approach would also allow for the image generation algorithm to adapt to any significant anatomical changes between the time of 4DCT acquisition and the treatment session. A downside is the time it would take to generate the motion model while the patient is in treatment position. With the current GPU implementation (NVIDIA GeForce GTS 450), this takes approximately 3-4 minutes for a 10 phase 4D image set.
5. Conclusion
In this work we presented a systematic evaluation of a 3D fluoroscopic image generation algorithm from a single planar treatment image. Using the modified XCAT phantom, first a set of experiments were conducted to independently study uncertainties induced by setup errors, breathing amplitude changes, breathing period changes, imaging noise, baseline tumor position shifts, and tumor size variations. Next, the algorithm was tested on measured patient 3D tumor trajectories from 8 patients. Overall, results suggested that the algorithm was robust to nearly all of the variables, with the most problematic uncertainty sources being setup error and baseline shifts. Resolving these issues will be a subject of future research. Based on our simulation results 8 patients, the overall tumor localization accuracy of the model in left-right (LR), anterior-posterior (AP) and superior-inferior (SI) directions are 0.1 ± 0.1 mm, 0.5 ± 0.5 mm and 0.8 ± 0.8 mm respectively. 3D tumor centroid localization accuracy is 1.0 ± 0.9 mm.
Acknowledgments
The authors would like to express their gratitude to Drs. Seiko Nishioka of the Department of Radiology, NTT Hospital, Sapporo, Japan and Hiroki Shirato of the Department of Radiation Medicine, Hokkaido University School of Medicine, Sapporo, Japan for sharing the Hokkaido dataset. The project described was supported by Award Numbers RSCH1206 (JHL) from the Radiological Society of North America and NIH/NCI 1K99CA166186 (RL).
Contributor Information
Pankaj Mishra, Email: pmishra@lroc.harvard.edu.
John H Lewis, Email: jhlewis@lroc.harvard.edu.
References
- Berbeco RI, Mostafavi H, Sharp GC, Jiang SB. Towards fluoroscopic respiratory gating for lung tumours without radiopaque markers. Phys Med Biol. 2005;50:4481–90. doi: 10.1088/0031-9155/50/19/004. [DOI] [PubMed] [Google Scholar]
- Brock KK. Results of a multi-institution deformable registration accuracy study (MIDRAS) Int J Radiat Oncol Biol Phys. 2009;76:583–96. doi: 10.1016/j.ijrobp.2009.06.031. [DOI] [PubMed] [Google Scholar]
- Chen M, Lu W, Chen Q, Ruchala KJ, Olivera GH. A simple fixed-point approach to invert a deformation field. Med Phys. 2008;35:81–8. doi: 10.1118/1.2816107. [DOI] [PubMed] [Google Scholar]
- Comon P. Independent component analysis, a new concept? Journal of Signal Processing. 1994;36:287–314. [Google Scholar]
- Cui Y, Dy JG, Sharp GC, Alexander B, Jiang SB. Multiple template-based fluoroscopic tracking of lung tumor mass without implanted fiducial markers. Phys Med Biol. 2007;52:6229–42. doi: 10.1088/0031-9155/52/20/010. [DOI] [PubMed] [Google Scholar]
- Evans JD, Politte DG, Whiting BR, O’Sullivan JA, Williamson JF. Noise-resolution tradeoffs in x-ray CT imaging: a comparison of penalized alternating minimization and filtered backprojection algorithms. Med Phys. 2011;38:1444–58. doi: 10.1118/1.3549757. [DOI] [PMC free article] [PubMed] [Google Scholar]
- Hertanto A, Zhang Q, Hu YC, Dzyubak O, Rimner A, Mageras GS. Reduction of irregular breathing artifacts in respiration-correlated CT images using a respiratory motion model. Med Phys. 2012;39:3070–9. doi: 10.1118/1.4711802. [DOI] [PMC free article] [PubMed] [Google Scholar]
- Hyvarinen A, Oja E. Independent component analysis: algorithms and applications. Neural Netw. 2000;13:411–30. doi: 10.1016/s0893-6080(00)00026-5. [DOI] [PubMed] [Google Scholar]
- Jiang SB. Radiotherapy of mobile tumors. Semin Radiat Oncol. 2006;16:239–48. doi: 10.1016/j.semradonc.2006.04.007. [DOI] [PubMed] [Google Scholar]
- Kashani R, Hub M, Balter JM, Kessler ML, Dong L, Zhang L, Xing L, Xie Y, Hawkes D, Schnabel JA, McClelland J, Joshi S, Chen Q, Lu W. Objective assessment of deformable image registration in radiotherapy: a multi-institution study. Med Phys. 2008;35:5944–53. doi: 10.1118/1.3013563. [DOI] [PMC free article] [PubMed] [Google Scholar]
- Keall PJ, Mageras GS, Balter JM, Emery RS, Forster KM, Jiang SB, Kapatoes JM, Low DA, Murphy MJ, Murray BR, Ramsey CR, Van Herk MB, Vedam SS, Wong JW, Yorke E. The management of respiratory motion in radiation oncology report of AAPM Task Group 76. Med Phys. 2006;33:3874–900. doi: 10.1118/1.2349696. [DOI] [PubMed] [Google Scholar]
- Li R, Jia X, Lewis JH, Gu X, Folkerts M, Men C, Jiang SB. Real-time volumetric image reconstruction and 3D tumor localization based on a single x-ray projection image for lung cancer radiotherapy. Med Phys. 2010;37:2822–6. doi: 10.1118/1.3426002. [DOI] [PubMed] [Google Scholar]
- Low DA, Parikh PJ, Lu W, Dempsey JF, Wahab SH, Hubenschmidt JP, Nystrom MM, Handoko M, Bradley JD. Novel breathing motion model for radiotherapy. Int J Radiat Oncol Biol Phys. 2005;63:921–9. doi: 10.1016/j.ijrobp.2005.03.070. [DOI] [PubMed] [Google Scholar]
- Mishra P, St James S, Segars WP, Berbeco RI, Lewis JH. Adaptation and applications of a realistic digital phantom based on patient lung tumor trajectories. Phys Med Biol. 2012;57:3597–608. doi: 10.1088/0031-9155/57/11/3597. [DOI] [PMC free article] [PubMed] [Google Scholar]
- Rottmann J, Aristophanous M, Chen A, Court L, Berbeco R. A multi-region algorithm for markerless beam’s-eye view lung tumor tracking. Phys Med Biol. 2010;55:5585–98. doi: 10.1088/0031-9155/55/18/021. [DOI] [PubMed] [Google Scholar]
- Segars WP, Lalush DS, Tsui BM. Modeling respiratory mechanics in the mcat and spline-based mcat phantoms. IEEE Trans Nucl Sci. 2001;48:89–97. [Google Scholar]
- Segars WP, Sturgeon G, Mendonca S, Grimes J, Tsui BM. 4D XCAT phantom for multimodality imaging research. Med Phys. 2010;37:4902–15. doi: 10.1118/1.3480985. [DOI] [PMC free article] [PubMed] [Google Scholar]
- Seppenwoolde Y, Shirato H, Kitamura K, Shimizu S, van Herk M, Lebesque JV, Miyasaka K. Precise and real-time measurement of 3D tumor motion in lung due to breathing and heartbeat, measured during radiotherapy. Int J Radiat Oncol Biol Phys. 2002;53:822–34. doi: 10.1016/s0360-3016(02)02803-1. [DOI] [PubMed] [Google Scholar]
- Siddon RL. Calculation of the radiological depth. Med Phys. 1985;12:84–7. doi: 10.1118/1.595739. [DOI] [PubMed] [Google Scholar]
- Sohn M, Birkner M, Yan D, Alber M. Modelling individual geometric variation based on dominant eigenmodes of organ deformation: implementation and evaluation. Phys Med Biol. 2005;50:5893–908. doi: 10.1088/0031-9155/50/24/009. [DOI] [PubMed] [Google Scholar]
- Vedam SS, Keall PJ, Kini VR, Mostafavi H, Shukla HP, Mohan R. Acquiring a four-dimensional computed tomography dataset using an external respiratory signal. Phys Med Biol. 2003;48:45–62. doi: 10.1088/0031-9155/48/1/304. [DOI] [PubMed] [Google Scholar]
- Whiting BR, Massoumzadeh P, Earl OA, O’Sullivan JA, Snyder DL, Williamson JF. Properties of preprocessed sinogram data in x-ray computed tomography. Med Phys. 2006;33:3290–303. doi: 10.1118/1.2230762. [DOI] [PubMed] [Google Scholar]
- Xu Q, Hamilton RJ, Schowengerdt RA, Alexander B, Jiang SB. Lung tumor tracking in fluoroscopic video based on optical flow. Med Phys. 2008;35:5351–9. doi: 10.1118/1.3002323. [DOI] [PMC free article] [PubMed] [Google Scholar]
- Zhang Q, Hu YC, Liu F, Goodman K, Rosenzweig KE, Mageras GS. Correction of motion artifacts in cone-beam CT using a patient-specific respiratory motion model. Med Phys. 2010;37:2901–9. doi: 10.1118/1.3397460. [DOI] [PMC free article] [PubMed] [Google Scholar]
- Zhang Q, Pevsner A, Hertanto A, Hu YC, Rosenzweig KE, Ling CC, Mageras GS. A patient-specific respiratory model of anatomical motion for radiation treatment planning. Med Phys. 2007;34:4772–81. doi: 10.1118/1.2804576. [DOI] [PubMed] [Google Scholar]


