Abstract
The extracellular pH (pHe) of solid tumors is acidic, and there is evidence that acidic pHe is related to invasiveness. Herein, we describe an MRI single infusion method (SIM) to measure pHe in gliomas using a cocktail of contrast agents (CA). The cocktail contained Gd-DOTA-4AmP and Dy-DOTP, whose effects on relaxation are sensitive and insensitive to pH, respectively. The Gd-CA dominated the spin-lattice relaxivity, ΔR1, whereas the Dy-CA dominated the spin-spin relaxivity, . The effects were used to determine the pixelwise concentration of [Dy] which, in turn, were used to calculate a value for [Gd] concentration. This value was used to convert ΔR1 values to molar relaxivity, Δr1 and hence, pHe maps. Development of the method involved in vivo calibration and measurements in a rat brain glioma model. The calibration phase consisted of determining a quantitative relationship between the ΔR1 and induced by two pH-independent CAs, Gd-DTPA and Dy-DOTP, using Echo Planar Spectroscopic Imaging (EPSI) and T1 weighted images. Intensity and linewidths of the water peaks in EPSI images were affected by CA and were used to follow pharmacokinetics. These data showed a linear relationship between inner- and outer-sphere relaxation rate constants that were used for CA concentration determination. Non-linearity in the slope of the relationship was observed and ascribed to variations in vascular permeability. In the pHe measurement phase, Gd-DOTA-4AmP was infused instead of Gd-DTPA, and relaxivities were obtained through the combination of interleaved T1-weighted images (R1) and EPSI for (). The resulting r1 values yielded pHe maps with high spatial resolution.
Keywords: pH, susceptibility, contrast agent cocktail
Introduction
The extracellular pH (pHe) of tumors is acidic, and there is evidence that this acidity stimulates local invasion (1,2), and plays a role in metastases (3). This low pHe is a product of elevated metabolism combined with perfusion limitations. To fully characterize the nature and anatomical extent of this aspect of the altered tumor microenvironment, there is a need for further advances in the ability to accurately map the extracellular pHe at high spatial resolution. Furthermore, noninvasive measures of pHe have been limited to pre-clinical animal models and there is a real need to develop methods that may eventually be used in humans.
Various approaches have been developed to measure pHe maps in tumors with MRI and MRSI. Advances have involved low-resolution single voxel 31P MRS to medium resolution pHe maps using 19F, 1H, or 13C labeled tracers (4–7). However, methods exist to render pHe maps with a spatial resolution that is on the same scale as MRI, such as magnetization transfer methods (8–10) or pH-sensitive relaxivity agents (11). Relaxivity-based methods offer the advantage of lower RF energy deposition, which is a significant consideration in the clinical setting. However, a challenge in relaxometric methods is the determination of contrast agent (CA) concentration, which is required to convert relaxation data to pHe maps. Methods to date have used sequential injections of pH-insensitive and pH-sensitive agents (12,13). Although these can provide high spatial resolution maps, they lack high temporal resolution and would be impractical in a clinical setting.
Numerous MRI applications require the determination of CA concentrations, such as dynamic contrast enhanced (DCE) MRI. Historically, this has been achieved with either T1-weighted (dynamic contrast) or -weighted (dynamic susceptibility) pulse sequences (14–16). T1 sequences yield contrast and enhancement based on inner sphere relaxation while contrast is based on outer sphere mechanisms. Although it is slower, 1H Echo Planar Spectroscopic Imaging (EPSI) can be highly linear with CA concentration and has been used to measure spectra in both water-suppressed (17–19) and non-water-suppressed mode (20,21). One of the advantages of using EPSI in vivo is the ability to determine R2 (or ) and ΔB0 simultaneously (22). In addition, one may examine the complexity of the lineshape to reveal underlying sub-voxel heterogeneities.
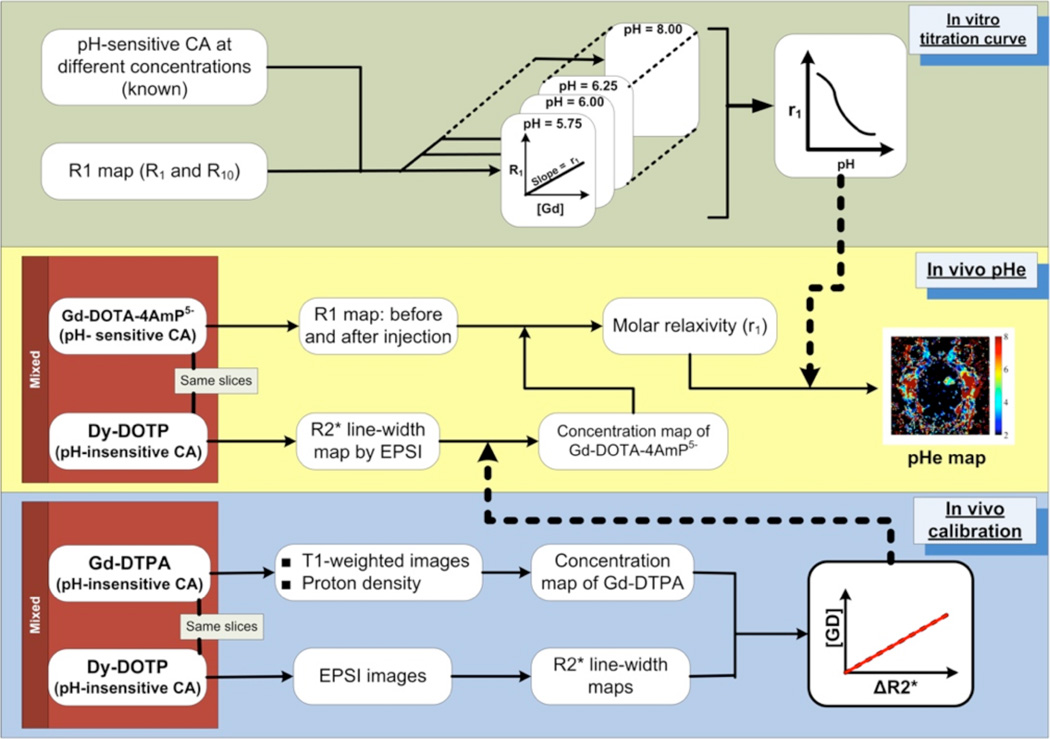
In the current work, we investigate the use of EPSI to measure simultaneously the pH-dependent inner sphere effects and the pH-independent outer sphere effects in order to generate quantitative values of pHe. This involved infusion of a cocktail containing both DyDOTP5- and GdDOTA-4AmP5-. While the effects of the Gd-CA on T1 and T2 exhibited similar pHe-dependence, the Dy-CA induced strong outer sphere effects on that were pH-independent with negligible effects on T1. The entire protocol is diagrammed in Fig. 1 and involved measurement of [Dy-CA] through its effects on and subsequently extrapolating the [Gd-CA] from the known ratio of [Dy-CA] to [Gd-CA]. This relationship assumed that Gd-CA and Dy-CA distributed to the tumors with identical pharmacokinetics. The calculated [Gd-CA] was then used to yield the spin lattice molar relaxivity (r1) and hence, a pHe map was generated based on an in vitro relaxivity titration curve. We have investigated these relationships in vivo in a pharmacokinetic time-series in intracranial rat gliomas, which is the first application of a CA cocktail single infusion method (SIM) for the determination of spin lattice and susceptibility induced transverse relaxation rates.
Fig. 1.
A schematic overview of the Single Infusion Protocol. In vitro calibrations (upper panel) are used to define a relationship between the molar relaxivity of GdDOTA-4AmP and pH. In vivo calibrations (lower panel) involve co-injection of pH-independent Gd- DTPA and Dy-DOTP. These data are used to define an in-vivo relationship between [Gd] and the EPSI-measured linewidth. In the in vivo pHe experiment (middle panel), the linewidth induced by the co-injected [Dy] is used to calculate the per-pixel [Gd-DOTA-4AmP], which is then combined with T1 values to calculate a molar relaxivity and hence, pH.
Materials and Methods
Cell lines and In Vivo Tumor Model
C6 glioma cells were stereotactically injected into female Wister rats with 105 C6 glioma cells in the right caudate nucleus to a depth of 5.5 mm (N = 8). Tumor growth was monitored with MRI to determine when the gliomas were of substantial volume of approximately 50% of the right hemisphere. Typically, the tumors were mature enough to observe enhancement from 10 to 14 days after injection.
Data Acquisition
Experiments were performed with a Bruker Biospec 4.7 T MRI scanner, with a preemphasis unit. The gradients are capable of 20 mT m−1 strength, with a maximum slew rate of 110 T m−1 s−1. A 73 mm ID volume coil was used for excitation, and an 18 mm diameter surface coil was used for signal reception. The surface coil was placed 1–2 mm above the rat brain, and active decoupling was used for switching between transmit and receive coils.
In vitro measurements were carried out on 96-well plates cut in half. GdDOTA-4AmP, DyDOTP, and GdDTPA were characterized at various concentrations and pH values in order to determine a titration curve between r1 and pH. Both PBS (Phosphase Buffered Saline) and FBS (Fetal Bovine Serum) were used as buffers for relaxation studies. Spin-lattice relaxation measurements were performed in imaging mode to determine spatially localized T1 values in each well of the plate. An ROI was drawn for each well where the mean value was used to generate a titration curve.
For the pH sensitive contrast agent, in vitro relaxation experiments were accomplished with variable GdDOTA-4AmP concentrations and pH values. Inversion recovery or progressive saturation experiments were performed to determine a parametric T1 value. After confirming agreement between the two, only progressive saturation was done. The data were fit to a 3 parameter equation I(tD) = M(1 − Ve−tD/T1), were V is the inversion (saturation) parameter and tD is the variable delay after the initial 180° inversion pulse or the repetition time in the case of progressive saturation.
In vivo T1-weighted images were scanned with a TR = 200 ms, and a TE = 6.4 ms. Proton density images were acquired with a TE = 6.4 ms and a TR = 7000 ms. T2-weighted images were acquired using a RARE pulse sequence with a RARE factor of 8, giving an effective TE = 72 ms. Fat suppression was not used. The EPSI experiments were performed with a single RF excitation pulse and trapezoidal echo planar readout (23), where the TE = 5 ms. The receiver bandwidth was 123–152 kHz, resulting in a spectroscopic bandwidth of 1.2 to 1.5 ppm. The data were collected with a matrix size of 128×128×128. The resulting in-plane resolution for all of the imaging and spectroscopic imaging experiments was 250 µm/pt on with a Field of View (FOV) of 3.5 cm on each side. A slice thickness of 1.25 mm was used throughout. The isotropic spectroscopic resolution was 1.8–2.3 Hz/pt.
MR Experimental Structure
Once the animal was placed in the magnet and under anesthesia, a series of pre-infusion images and spectroscopic images was acquired. These included: a scouting FLASH, RARE axial and coronal, proton density, T1-weighted spin echo, and EPSI. As a CA cocktail consisting of Magnevist: DyDOTP5- at a 1:2 ratio was gradually infused, an interleaved series of two separate pulse sequences, T1-weighted images and EPSI, was collected until a steady state was reached (50 – 100 minutes). The rate of i.v. infusion was 0.2 – 0.4 mmol kg−1 hr−1 (0.4 – 0.8 mmol kg−1 hr−1 for DyDOTP), although it was necessary to lower the infusion rate after 30 minutes to reach a steady state. In a subset of calibration animals, CPMG was interleaved with T1-weighted and EPSI scans. The parameters used for CPMG were: TR = 3 s, TE = 10.5 ms, a matrix size of 128 × 128, and 128 echoes. CPMG was not run on all animals. Instead, a correlation between R2 and was used to estimate R2 values.
In the pH measurement experiments, the same sequence of experiments was acquired except without CPMG. The CA cocktail in that case was GdDOTA-4AmP5-:DyDOTP5-1:2. The infusion was performed as mentioned above.
Data Processing and Analysis
Reconstruction of T1-weighted images, proton density images and EPSI spectroscopic images were performed with in-house programs written in MATLAB (The MathWorks, Inc., Natick, MA). All other images were reconstructed in ParaVision (Bruker BioSpin MRI GmbH, Ettlingen, Germany). T1-weighted images were reconstructed by direct Inverse Fast Fourier Transform (IFFT) of the k-space data in two dimensions. Volumes (V) of tumors were obtained by measuring the area (A) of the tumor in a single slice and using V = 4A3/2/3π1/2. EPSI data sets were processed by reducing the data in the spectroscopic dimension into odd echoes and even echoes. This yielded two separate 3D data sets that were independently apodized with a Hanning filter in the k-space, and a decaying exponential in the time domain; however, the even echo planar echoes were time reversed preceding apodization. Reconstruction was accomplished with a 2D IFFT and a 1D FFT to yield two spatial- and one spectroscopic dimensions. Zero order auto phasing was performed along the spectroscopic dimension. Finally, the odd-echo and even-echo experiments were added together to form a final data set.
The quantity νFWHM is the full width at half maximum of the water peak and is directly proportional to . νFWHM was determined by fitting EPSI spectra with a Lorentzian lineshape on a pixel-by-pixel basis. was calculated directly from the linewidth according to: . R2 values were obtained by a two-parameter fit of pixel intensity in the CPMG experiment to the equation: I(TE) = I0e−TER2, where I0 is the proton density. Smoothing of all data sets and parameter maps was accomplished using a 5 × 5 convolution kernel with a center value of 4 (the rest were ones).
Calculation of pHe
The spin lattice relaxation rate constant R1 was determined, as in previous work (12,13), from the proton density and T1-weighted images so that its measurement was accomplished throughout the course of the infusion with high temporal resolution. In the current, work we have empirically determined that TE is not much less than T2. However T2 was incorporated into the repetition time dependent signal equation to compensate for the apparent saturation of the intensity at higher concentrations of CA:
| (1) |
where I is the T1-weighted intensity at any time, I0 is the intensity of the proton density image, TR is the repetition time, and TE is the echo time. Rearranging eqn. (1), we obtain the relaxation rate constant R1:
| (2) |
The relaxation rate is a function of the [CA] and is given by:
| (3) |
where r1 is the spin lattice molar relaxivity in units mM−1s−1.
This rearranges to a form where we can experimentally obtain r1 given that we have R1, and R1,0,, and [CA]:
| (4) |
Combining eqns (2) and (4), the in vivo contrast agent concentration is given by:
| (5) |
where I0, IPre, and IPost are the proton density, pre-infusion T1-weighted signal, and post-infusion T1-weighted signal, respectively. A calibration was established between the two quantities and [Gd] for a CA cocktail of two pH insensitive agents GdDTPA/DyDOTP (1:2). It should be noted that in vivo calibration was chosen because the effect is highly dependent on the presence of mesoscopic field inhomogeneities in the tissue of interest (24,25). The is determined independently of R1 by measuring the linewidth of the water peak in an EPSI experiment. The calibration that was obtained is applicable to the current study assuming GdDOTA-4AmP and DyDOTP both perfuse and extravasate equivalently, which is based upon the fact these two molecules are of similar size and have identical charges at physiological pH values. This assumption then yields a linear relationship between [GdDOTA-4AmP] and .
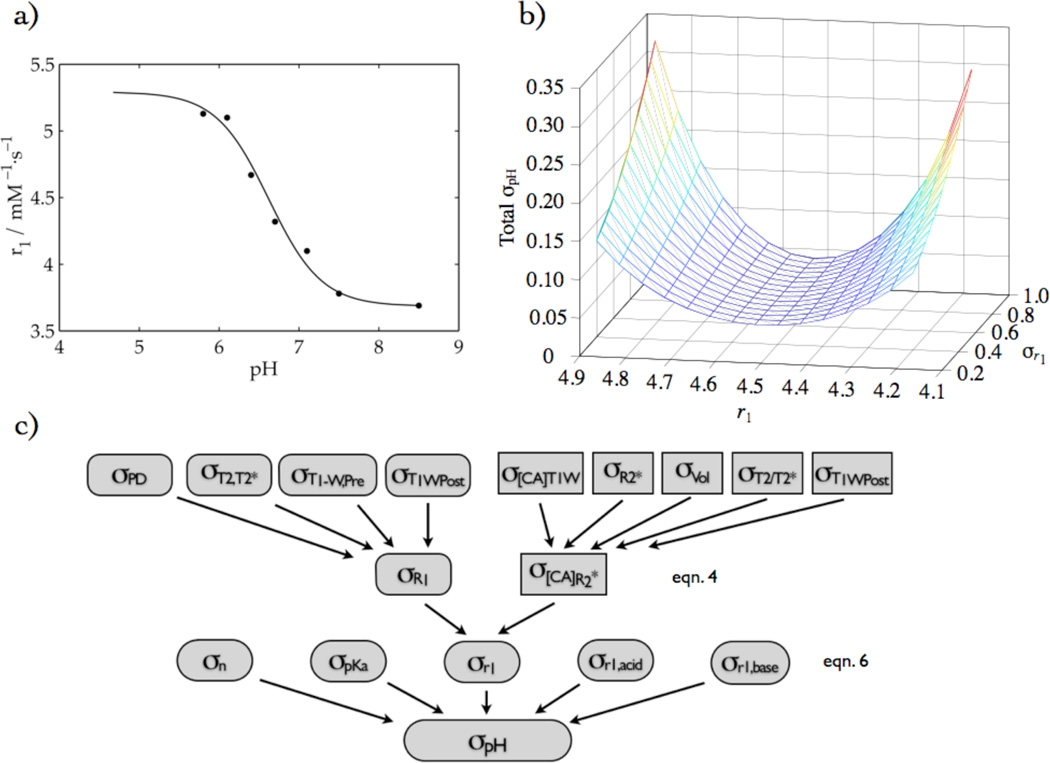
The relaxometric pHe imaging method requires knowledge of R1 to yield pHe. Data from in vitro phantoms (FBS) were fit using a Hill-modified Henderson-Hasselbach equation for multiple titratable groups. In Fig. 2a, a non-linear least squares fitting routine was used to fit the following relation for pHe:
| (6) |
Fig. 2.
(a) in vitro relaxivity titration of GdDOTA-4AmP fit to a Hill-modified Henderson-Hasselbach equation, (b) the corresponding total pH error as a function of r1 and σr1, and (c) the error propagation analysis scheme, giving rise to (b). It is based on eqn. 4, where the rounded rectangles represent the numerator and rectangles represent the denominator, and eqn. 6, where the five rounded shapes in the third row represent the five-fit parameters.
Overall, the T1-weighted experiment yields the relaxation rate through eqn. 2, while EPSI yields [GdDOTA-4AmP] from the water linewidths. Based on the apparent linear relationship between tumor volume and the slope of the relationship between concentration and (p = 2.2×10⁻⁴), a slope was determined (with zero offset) in order to calculate the concentration. The resulting values have been combined to yield the spin lattice molar relaxivity. Based on eqn. 4 and knowledge of the relaxivity, pHe was determined through eqn. 6 as outlined in Fig. 1.
Calculation of Error
The overall error in pH values was determined by propagating the error of individual measurements according to the error propagation equation (26). In images, the standard deviation of an ROI outside of the image was used, whereas the standard deviation of a homogeneous part of a parameter map was used to estimate the error for that image. The calculation of error in r1 in each point in the time-series was accomplished by including all error contributions in quadrature according to the variances in the independent variables in a numerical fashion, rather than using individual analytical error propagation formulae. As the mean value of r1, averaged over various time points in the series, was used to calculate pH, a mean-weighted error was used to calculate the error in r1. However, for the final error in pH due to the various parameters in eqn. 6, an analytical error formula was used as the computational method did not yield accurate values. The nonlinear least squares fit yielded the best fit parameters and their corresponding errors: pKa, σpKa, n, σn, r1,acid, σr1,acid, r1,base, and σr1,base. The overall error is expression is:
| (7) |
The error surface in Fig. 2b, was constructed using best fit parameters while varying r1 and σr1. In all computations, covariances were not included in the error calculations. The overall scheme is depicted in Fig. 2c.
Results
In vitro calibrations
In vitro relaxivities (r1 and r2) for CAs in this study are summarized in Table 1. Gd showed greater r1 and r2 relaxivities than Dy. GdDOTP is shown for reference.
Table 1.
Relevant lanthanide CA relaxivities (r1 and r2) in this study performed at 7 T and 37 °C.
| Contrast Agent | r1 (mM−1 s−1) | r2 (mM−1 s−1) |
|---|---|---|
| GdDTPA | 2.95 | – |
| GdDOTP | 3.17 | 4.75 |
| DyDOTP | 0.16 | 0.19 |
Spin-lattice relaxation data for Gd-DOTA-4AmP as a function of pH were fit to equation (6) and yielded the parameters: r1,acid = 5.39 ± 0.27, r1,base = 3.68 ± 0.10, pKa = 6.56 ± 0.15, and n = 0.88 ± 0.28, where the square of the correlation coefficient (r2) was 0.99. The fit is shown in Fig. 2a. Fig. 2b shows the surface of the total pH error generated by the Hill-modified Henderson-Hasselbach equation as a function of r1 and σr1, where the individual errors of all of the fitting parameters were included: σr1, σn, σpKa, σr1,acid, σr1,base. The total pH error was sensitive to r1 and σr1, in that the error is smallest in the part of the titration curve that is steepest, but also depended the value of σr1. Notably, the σpH is smallest in the region where tumor pixels are expected to be, which corresponds to pH 6 – 7.
In vivo studies
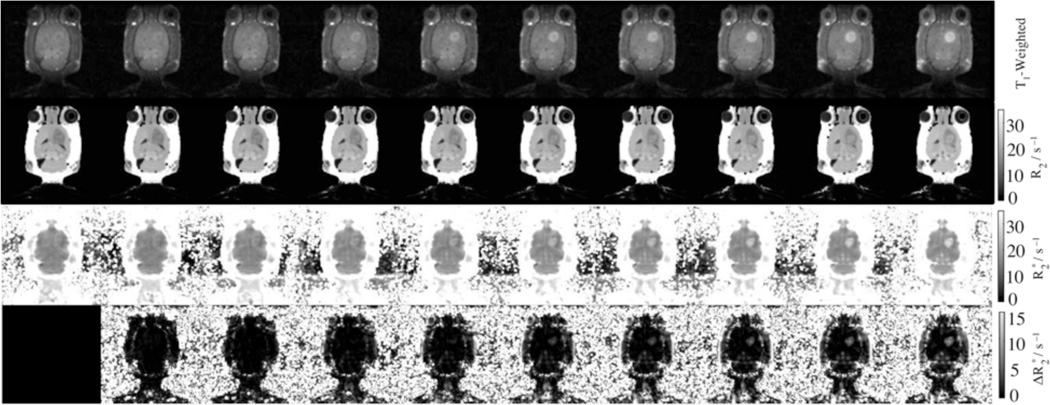
In vivo calibration studies were necessary because the effect of CA on cannot readily be recapitulated in vitro. Calibration experiments were performed with the CA cocktail GdDTPA/DyDOTP (1:2). In Fig. 3, the T1-weighted images showed an increase in intensity due to infusion of the CA cocktail into the glioma. Concomitant increases in transverse relaxation (R2, , and ) were also observed in Fig. 3 as a result of CA cocktail infusion.
Fig. 3.
Time-series of images and parameter-maps following the GdDTPA/DyDOTP infusion. The time from left to right are: 0, 13, 23, 33, 43, 53, 63, 73, 83, and 93 minutes.
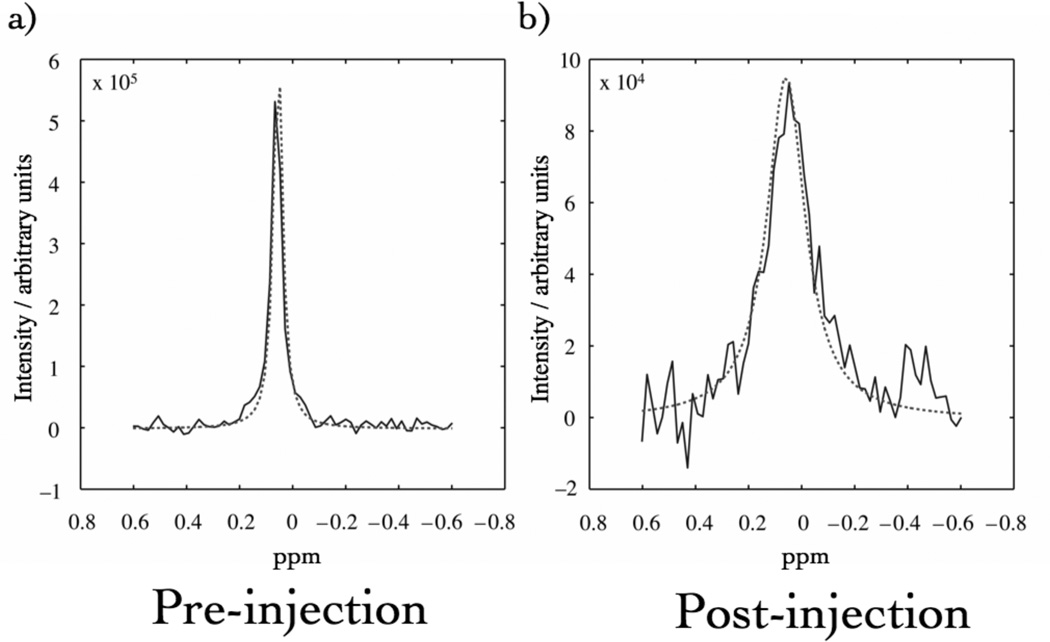
Fig. 4 shows a spectrum from a single EPSI redundant voxel prior to and after infusion of the CA cocktail. The CA caused an increase in the linewidth of the peak. These data could be fit with a Lorentzian lineshape model to yield νFWHM. The change in νFWHM was directly proportional to . Thus, fits of these data in each voxel were used to generate parametric maps of and (Fig. 3).
Fig. 4.
Representative Lorentzian curve-fits to a pixel of EPSI data before (a) and at a late stage (b) in the CA infusion. A concomitant drop in the intensity is seen in the peak.
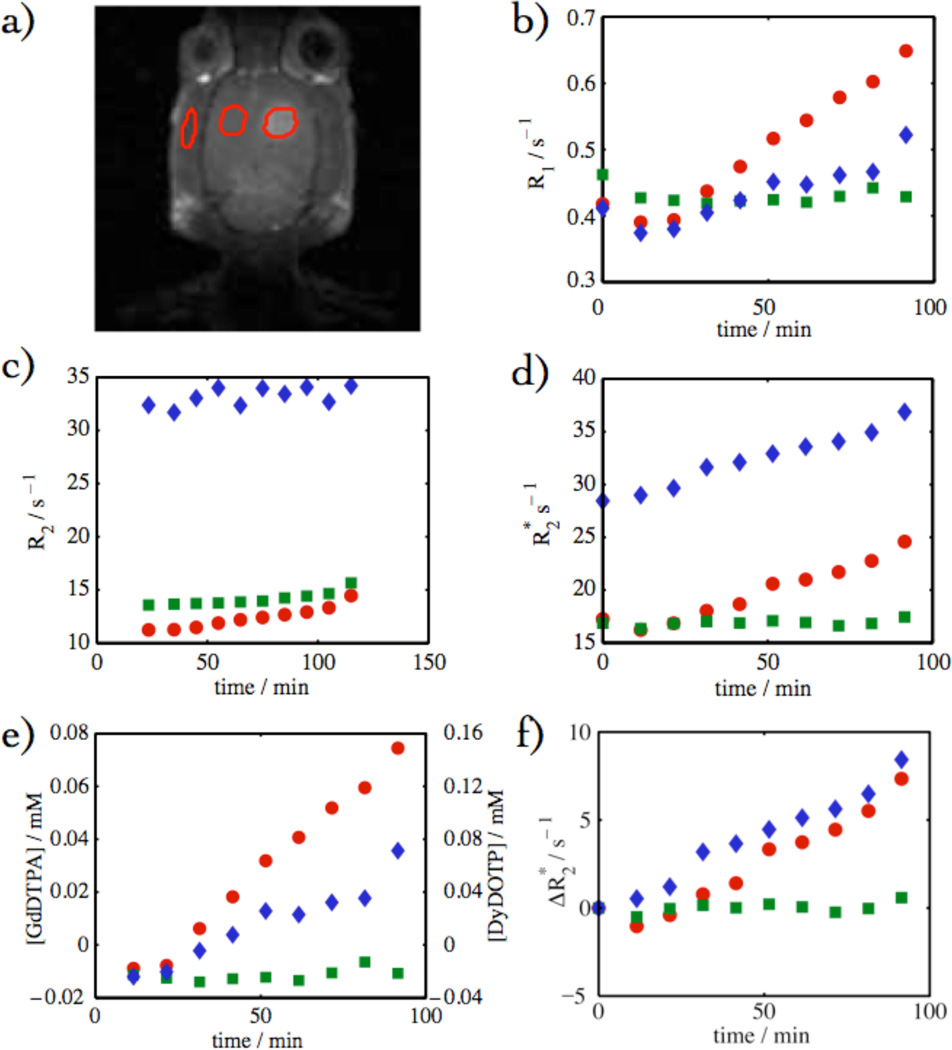
The analysis of the data was performed where CA breached the blood-brain barrier (within the glioma), in a contralateral ROI (control) and in the jaw muscle (ROIs depicted Fig. 5a). The glioma showed the largest relative enhancement, the jaw showed an intermediate enhancement, and the contralateral side showed almost no enhancement (Fig. 5b). This trend is mirrored in the response of the other parameter maps: R2, , [GdDTPA], [DyDOTP], and . The enhancement was largely contained within the glioma. The effect of T2 on the intensity of T1-weighted images was significant. If the T2 was not used to correct the signal equation, there was an apparent saturation of the intensity as the apparent [CA] reached ca. 0.2 mM.
Fig. 5.
(a) Depiction of three different ROIs in the head: the glioma (red filled circles), contralateral side (green squares), and jaw muscle (blue diamonds). (b) R1 vs. time, (c) R2 vs. time, (d) vs. time, (e) [GdDTPA or DyDOTP] vs. time, and (f) vs. time.
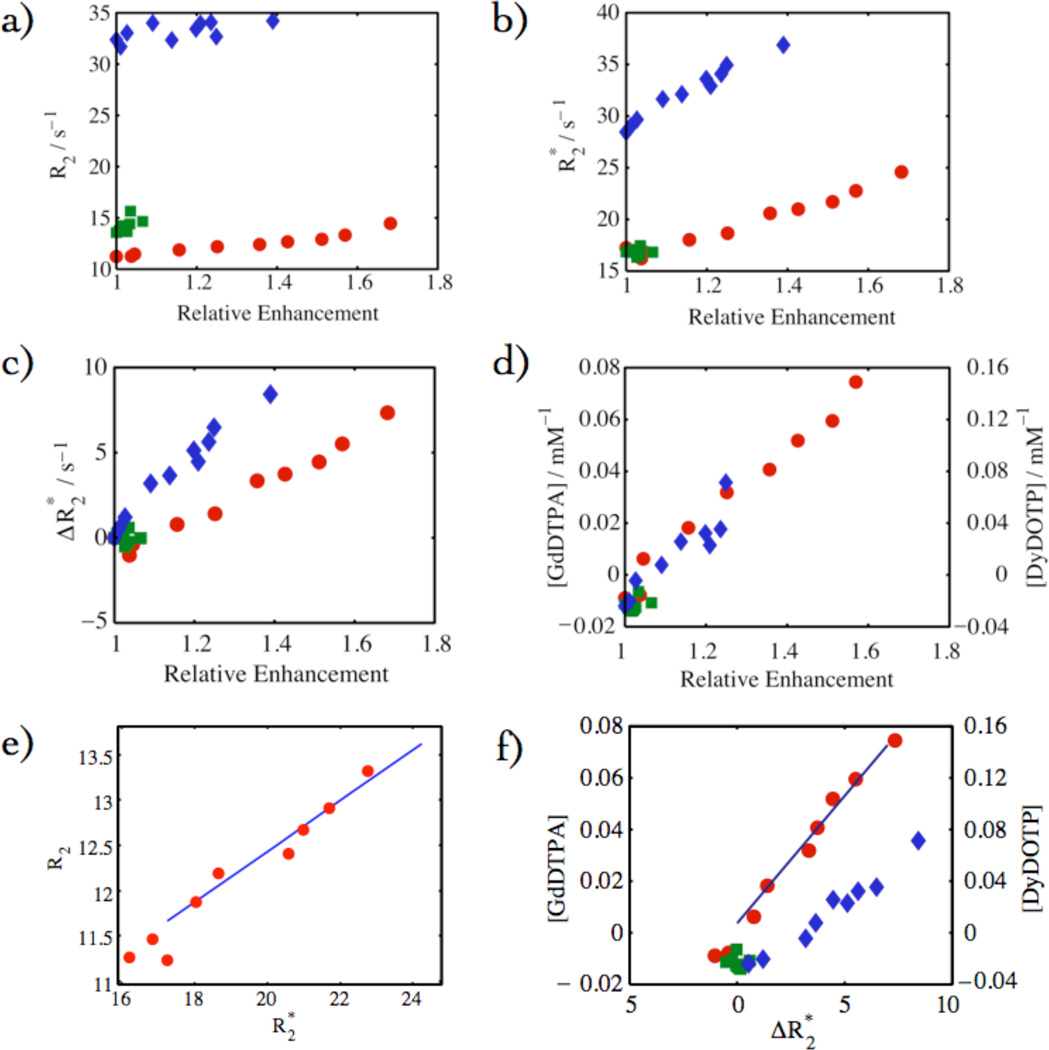
Figures 6 and 7 show data from the same ROIs depicted in Fig.5. Fig. 6 shows the response of different parameter maps compared to relative enhancement from T1-weighted images: R2, , and [GdDTPA and DyDOTP]. These plots establish the linearity of these parameters with relative enhancement. Of particular significance is the cross correlations of R2-derived parameters (Fig. 6a) and -derived parameters (Fig. 6b and 6c) with relative enhancement (T1-weighted spin echo) within the glioma. The linearity of the contrast agent concentration and the change in the transverse relaxation rate constant, , is fundamental to this method. Given that R1 and [CA] have been calculated from the same data set, a linear dependence was expected and was observed. In some experiments, R2 was extracted from CPMG and showed a linear dependence with [CA] in pixels within the glioma. Linearity was also observed for the dependence of R2, with in Fig. 6e and was of particular importance as this relationship was used to estimate R2 values in experiments where CPMG experiments were not conducted. Further correlations were observed between [GdDTPA and DyDOTP] with in Fig. 6f. The most significant of these was between [GdDTPA, DyDOTP cocktail] and since this relationship allowed [CA] to be calculated from EPSI spectroscopic imaging experiments.
Fig. 6.
Various parameters for the three different ROIs in Fig. 5 denoted as: the glioma (red filled circles), contralateral side (green squares), and jaw muscle (blue diamonds). Parameters in (a) – (d) are versus relative enhancement: (a) R2, (b) , (c) , (d) [GdDTPA/DyDOTP] (1:2), (e) R2 and (CPMG, EPSI), and (f) [GdDTPA or DyDOTP] vs. (T1-Weighted - EPSI).
Fig. 7.
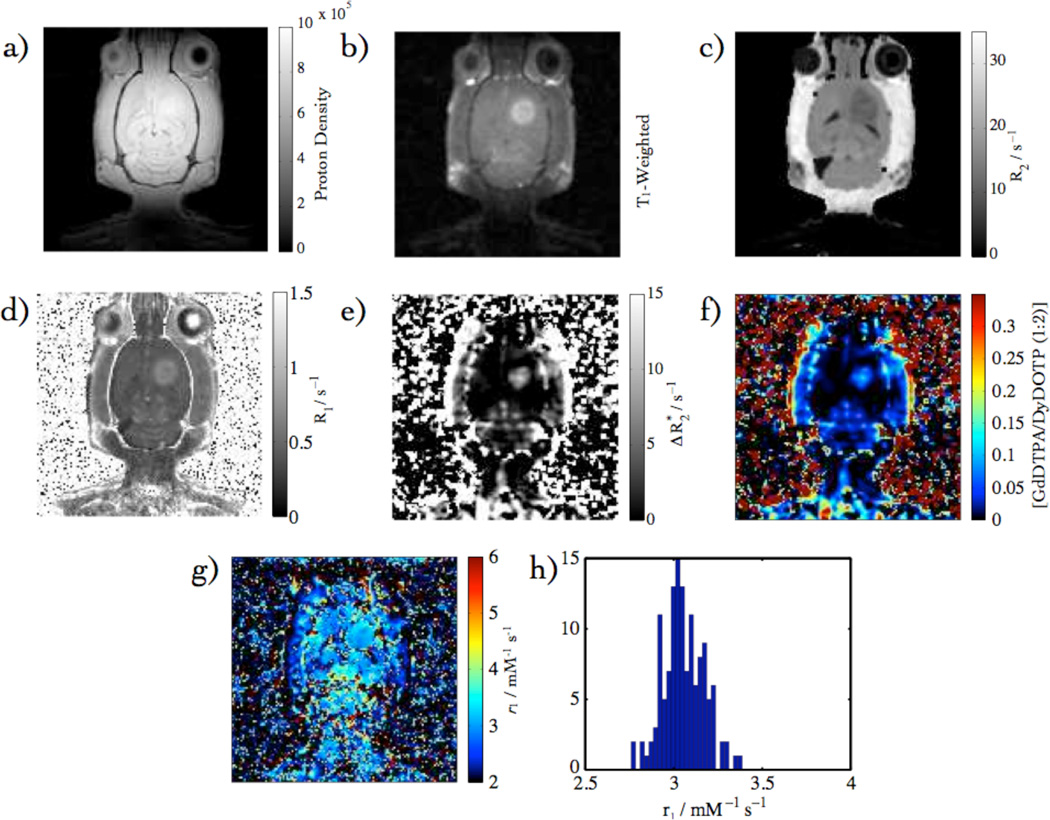
Calibration data overview: (a) T1-Weighted, (b) proton density, (c) R2 Map, (d) R1 Map (e) Map, (f) [GdDTPA] from , (g) r1 Map from (d) & (f), and (h) in vivo r1 histogram.
The Gd concentration remained relatively low throughout the course of the experiment (< 0.1 mM) (Fig. 6). It was consistently observed that for the first few points in the infusion, changes in were observed prior to any change in R1. We interpret this apparent discrepancy to be due to the intravascular localization of the CA in the early time points. If the CA were primarily intravascular, then the inner sphere (T1) effects will be confined to the vascular water and that water that can exchange during the MR lifetime. In contrast, the outer sphere effects are not spatially limited to direct contact and thus influences a much larger number of spin systems through direct susceptibility effects and spin diffusion. As the CA begins to extravasate, the influenced volumes become similar and the relationship is linear.
The images and parameter maps that have been used to determine the relaxivity are summarized in Fig. 7a – f: T1-weighted, proton density, R2, R1, , and [CA] determined from EPSI. That the two observables can be combined to yield an experimental r1, with the use of eqn. 4, is demonstrated in Fig. 7g & h, where the numerator was determined from R1 (pre-and post contrast) and the denominator was calculated from the .
The variability in the fitting parameters for the relationship between [GdDTPA] and was analyzed for the calibration cohort (Table 2). The correlation coefficient between tumor volume and slope was 0.91 with a p-value of 0.0002, indicating that there was a statistically significant relationship between tumor burden and slope.
Table 2.
Summary of relevant parameters for the calibration tumors investigated in this study. The enhancement is denoted by strong (S) or medium (M).
| Tumor | Matrix Size | Enh. | Volume / mm3 | Slope | Intercept | Mean r1 ± STD (mM−1 s−1) |
|---|---|---|---|---|---|---|
| 1 | 128 ×128 | S | 50.4 | 0.0059 | −0.0145 | 1.96 ± 4.93 |
| 2 | 128 ×128 | S | 124 | 0.0264 | −0.0654 | 3.04 ± 0.11 |
| 3 | 256 ×256 | S | 73.5 | 0.0037 | 0.0111 | 3.02 ± 0.080 |
| 4 | 256 ×256 | M | 100 | 0.0104 | 0.0018 | 3.04 ± 18.9 |
| 5 | 256 ×256 | M | 187 | 0.0255 | 0.0127 | 12.3 ± 68.3 |
| 6 | 256 ×256 | M | 65.1 | 0.0066 | 0.1409 | 3.22 ± 1.49 |
| 7 | 128 ×128 | S | 209 | 0.0386 | −0.0626 | 3.06 ± 0.12 |
| 8 | 128 ×128 | M | 70.8 | 0.0105 | −0.0329 | 3.06 ± 0.12 |
| 9 | 128 ×128 | S | 68.3 | 0.0099 | 0.0037 | 0.098 ± 20.1 |
| 10 | 128 ×128 | M | 41.0 | 0.0077 | 0.0039 | 3.4 ± 1.67 |
| Mean | 0.0101 | 0.0027 | ||||
The correlation coefficient between tumor volume and slope is 0.91 with a p-value of 2.2×10⁻⁴.
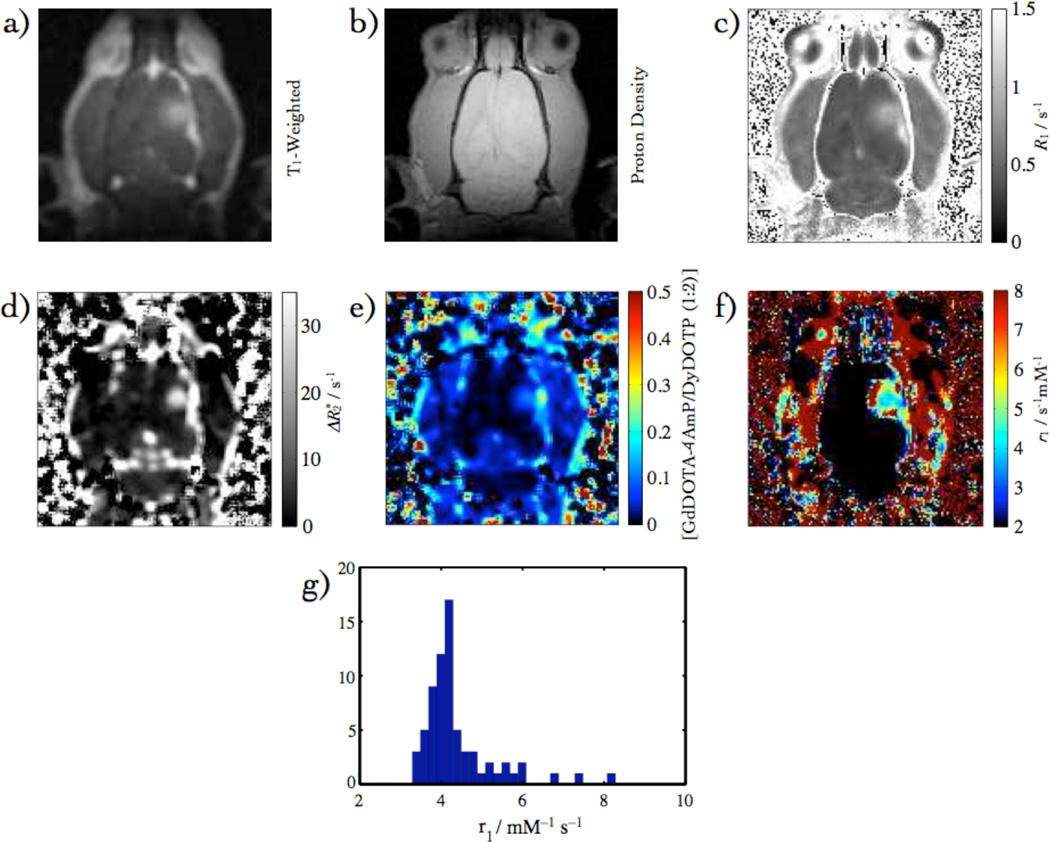
The pH measurement was acquired with the single infusion method. In this case, all of the data were acquired in the presence of GdDOTA-4AmP instead of GdDTPA. The combination of T1-weighted- (Fig. 8a) and proton density images (Fig. 8b), was used to determine R1 (Fig. 8c), where the range of CA concentrations, in which the relaxivity was constant in the [CA] range 0.02 to 0.1 mM. Hence, the R1 map was calculated using only data when the concentration was in this range. This also corresponds to the linear regime for the response of the relaxation rate R1. Fig. 8d is the map that was used to obtain the concentration map in Fig. 8e. The maps in Figs. 8c and 8e were used to calculate the relaxivity in Fig. 8f. The values of relaxivity within the ROIs depicted in Fig. 8a were used to generate a histogram in Fig. 8g. These relaxivity values are shown to be within a reasonable range from the pH titration. The values of GdDOTA-4AmP relaxivities are in agreement with phantom measurements of relaxivity (Fig. 2a). Equation (6) is sensitive to pixel drop-out as values outside the limiting relaxivities yielded complex values. The ROI fractions of pixels were calculated, as described in Materials and Methods, and are summarized in Table 3.
Fig. 8.
pH data overview: (a) T1-Weighted (b) proton density (c) R1 Map (d) Map (e) [GdDOTA-4AmP] from (f) r1 Map from (c) & (e), (g) r1 histogram.
Table 3.
Summary of relevant parameters including pH values when infusing GdDOTA-4AmP. The enhancement is denoted by strong (S) or medium (M).
| Tumor | Matrix Size | Enh. | ROI Fraction | Volume / mm3 |
Slope | Inter- cept |
Mean pH ± STD (mM−1 s−1) |
|---|---|---|---|---|---|---|---|
| 11 | 128 ×128 | M | 0.47 | 18.8 | 0.0030 | 0 | 6.65 ± 0.66 |
| 12 | 128 ×128 | M | 0.099 | 45.3 | 0.0072 | 0 | 6.32 ± 0.42 |
| 13 | 128 ×128 | M | 0.083 | 71.5 | 0.0114 | 0 | 6.28 ± 0.54 |
| 14 | 128 ×128 | M | 0.18 | 17.9 | 0.0028 | 0 | 6.38 ± 0.57 |
| 15 | 128 ×128 | W | 0.18 | 12.2 | 0.0019 | 0 | 6.41 ± 0.66 |
| 16 | 128 ×128 | M | 0.51 | 27.3 | 0.0043 | 0 | 6.58 ± 0.66 |
| 17 | 128 ×128 | M | 0.8022 | 26.5 | 0.0042 | 0 | 6.61 ± 0.55 |
| 18 | 128 ×128 | S | 0.8000 | 22.9 | 0.0037 | 0 | 6.66 ± 0.57 |
| Mean | 6.5 | ||||||
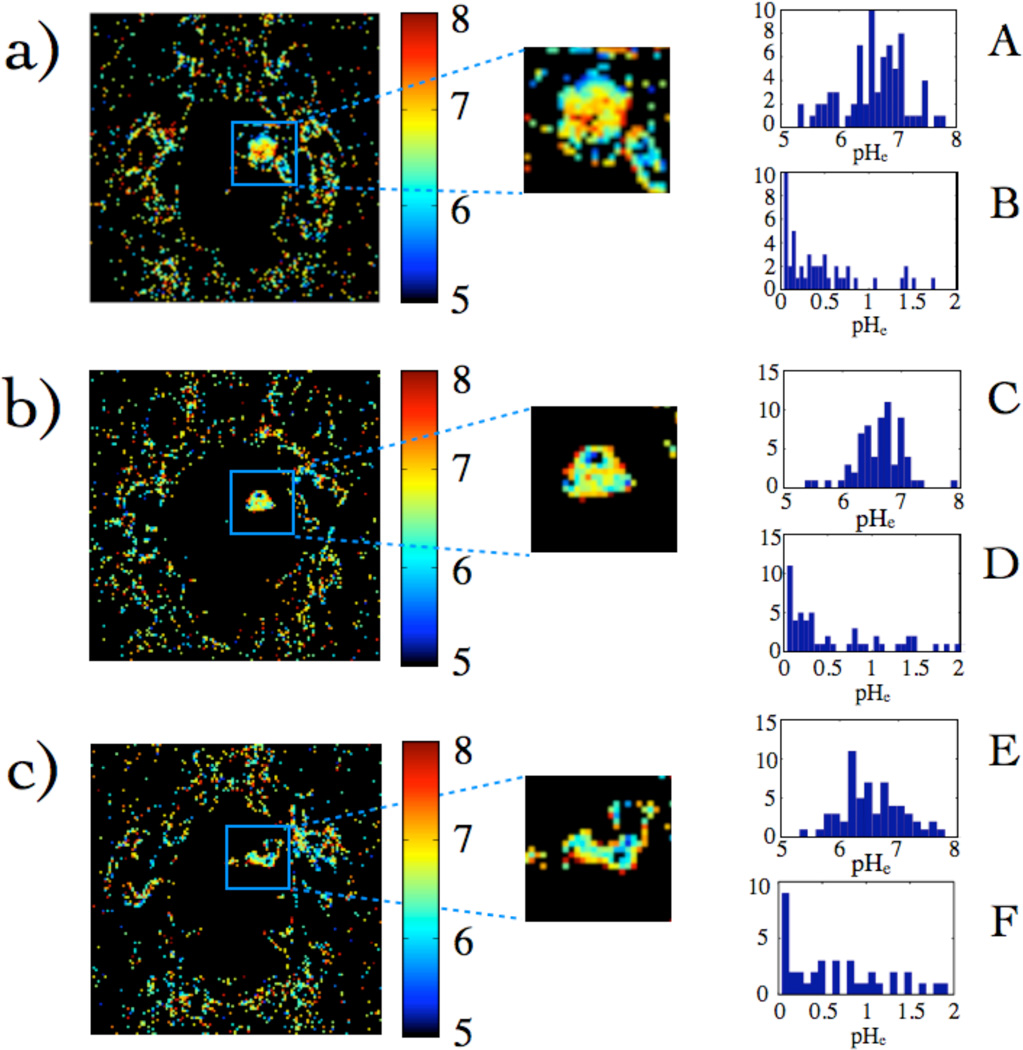
From Fig. 8, a pH map was obtained (Fig. 9). The histograms of values within three different gliomas are shown in Fig. 9A, C, and E and are distributed about a mean pH of 6.6. Figs. 9B, D, and F are histograms of uncertainties in the pH values determined by propagation of error from r1 values on a pixel-by-pixel basis, where r1 from different time points was used to calculate the uncertainty, which was typically 0.5 or less. Table 3 shows that the mean pHe values within the glioma are acidic relative to healthy tissue, and have relatively consistent mean values.
Fig. 9.
(a) pH maps calculated from Fig. 2 (a) and Fig. 8 (f). (b) and (c) are pH maps from two other subjects. (A), (C), and (E) are histograms of pH values, while (B), (D), and (F) are pH uncertainty histograms calculated by propagation of error from r1 averaged over several time-points. Pixels that had unreasonable r1 values yielded pH values that were complex and considered to be unreasonable and thus were set to 0. The percentage of pixels within the glioma that yielded reasonable pH values for these tumors were: 65%, 63%, and 67% respectively.
Discussion
In vivo calibration
From the array of images and parameter maps in Fig. 3, it is clear that the blood-brain barrier has been breached allowing CA to extravasate into the extracellular space of the tumor. The most obvious example of this is the T1-weighted enhancement. This has been corroborated by R2 and parameter maps. It is also clear from the images that not much CA entered the brain outside of the glioma, yet enhancement was noticeable in the jaw muscle.
EPSI was chosen for this study because the spatio-temporal resolution is very high for a slow infusion. In addition, EPSI was selected over a multiple gradient echo relaxation experiment because it has better time resolution along the FID due to rapid switching of the gradients in the echo planar readout. It also allowed for the interrogation of the complexity of the water lineshape. The transverse relaxation rate constant is affected by both mesoscopic and macroscopic magnetic field heterogeneity (24,25), as in regions of variable magnetic susceptibility. These two factors affect the relaxation and hence the linewidths. The maps from EPSI demonstrate an increase in linewidth over the time-series (Fig. 3). Upon closer inspection of spectra from individual pixels, it is clear that the CA had a dramatic effect on the width of the line (Fig. 4). It is this direct relationship between [CA] and , that is the essence of the SIM.
The infusion of the CA cocktail was slow and constant. The response of relative enhancement, R1, and was linear over the course of the experiment within the glioma (Fig. 5) where [CA] increased at a rate proportional to the total amount infused. The contralateral side showed negligible build-up, while the muscle showed some enhancement. Notably, the for both the glioma and muscle were on a similar scale over time whereas the muscle showed less relative enhancement compared to the glioma. This was probably due to differences in the extracellular volume fractions and relative vascular permeabilities of the two tissues (27,28). The change in mesoscopic heterogeneity was also mirrored by the bulk magnetic susceptibility changes caused by the CA. However, those changes were dominated by the static contributions, especially the air in the nasal passages, which masked any changes in the glioma.
In the calibration phase of the experiment, correlation of the imaging parameters with relative enhancement showed a correspondence with inner sphere relaxation, which is a function of concentration. R2 and correlations in Fig. 6 show that CPMG and EPSI may be used to determine concentration of a pH-insensitive CA. However, previous in vitro experiments with CPMG showed that R2 tracked closely to R1 when using GdDOTA-4AmP. Since operates on an outer-sphere mechanism, it is independent of R1 in the presence of GdDOTA-4AmP and may be used to determine concentration based on the linear response to [CA] in the glioma as observed in Fig. 6, and in particular, Fig. 6f. It is clear that in a rat glioma, yielded useful concentrations based on its relationship to [Gd].
The effects of transcytolemmel exchange on the intensities and spin lattice relaxation rates have been extensively studied (29,30). The effect of multiple compartments may have profound implications upon CA injection thereby affecting the relaxometric properties of water exchanging between compartments. However, it is important to note that this series of experiments was performed at CA concentrations low enough to remain within the fast exchange limit (29). Thus, the relaxation rates were not significantly affected by transcytolemmel water exchange.
R1--Permeability Surface
Tumor burden had a linear dependence on the slope of the relationship between R1 and (Table 2). This dependence was statistically significant with a p-value of 2.2×10⁻⁴ (correlation value of 0.91). Experiments were conducted several days after the blood-brain barrier had been breached leading to visual enhancement of the glioma upon infusion of CA. The fact that the tumor burden played a role is probably due to the observation that glioma vascular permeability increases with size (27). In the present study, permeability was not explicitly measured, but is considered to be the likely explanation. We can construct a view where the slope of the line is increasing as the tumor grows due to increased permeability, and hence decreased effect, leading to a useful relationship that is sensitive to vs. [CA] slope.
pH measurement
The r1 measurement of Fig. 8 demonstrated that this approach yielded consistent results when using GdDOTA-4AmP, where the range of relaxivities was within the pH titration range (Fig. 2). The relaxivities fell in the range where the pH may be obtained according to equation 6.
The pH maps in Fig. 9 reported a mean pH of 6.7 in this tumor, with a range of values from 6.0 to 7.2. The uncertainty in the pH values is typically below the range of pH values in the glioma. The majority of the pixels within the glioma were acidic relative to normal tissue pH. Other tumors have showed a similar mean and distribution of pH values. The standard error of measurement indicated the uncertainty in the mean value. Propagation of error from r1 to pH measurement showed that the error was typically smaller than the standard deviation of pH values. This tightness in the error distribution is required for meaningful pH values.
The pH could not be reliably measured for some pixels within the central core of the tumor. This was probably due to necrosis where the lack of intact cells largely affected the such that it was well below that observed in tissue. Decreased perfusion of CA to the necrotic core may also be responsible. This is an unfortunate drawback of this approach but, nonetheless, this can be addressed by obtaining an MRI diffusion map prior to infusion of CA that can assess cellularity, or a DCE-MRI map to assess contrast agent perfusion. In any case, the accurate determination of pH in a necrotic core is not of much interest, since pH plays a role in tumor progression by acidifying the surrounding tissue as it grows. Hence, we are primarily interested in measuring the pH in the viable parts of the tumor. Additionally pixel dropout in the calculation of pH may have been adversely affected where σpH is large, which are expected to be closer to either of the plateau regions of the titration curve.
Overall the mean pH values from all of these tumors is 6.5. Most of these tumors fell into a relatively tight range of volumes when compared to the set used for the calibration. Likewise the slopes showed a relatively small range in the pH group. Because of these small ranges, these results could not be used to assess a relationships between tumor burden, permeability, and the mean pH value. The approach of using volume as a criterion to localize tumors in the [CA]--burden space is justified. It yielded consistent mean pH values across the cohort. The 3-D relationship was useful, yet a greater understanding of the role that vascular permeability plays may be obtained with additional work.
The pH maps shown by this work are consistent with the general view that the tumor microenvironment is acidic, which may confer a competitive advantage to cancer cells. The further study of various tumors or pH sensitive CA with this method may provide additional details in cancer invasion and proliferation.
Conclusions
A single infusion protocol consisting of slow infusion of a CA cocktail has yielded high-resolution pHe maps of tumors. The current method is based on a calibration between [Gd] derived from T1-weighted SE and . The linear correlation is also a function of permeability. The primary advantage of this protocol over previous studies (4–6,9,10,12) is the rapidity of generating the pHe measurement, after the calibration curve has been obtained. The time-resolution of these experiments is the fastest thus far for a matrix size of 128 × 128. The time required for pre-infusion and infusion give rise to a total time of approximately 1 hour. The measured relaxivity in this method is a hybrid determination from two separate measurements, whereby R1 values are determined from T1-weighted intensities and [Gd] is determined from EPSI linewidths (ΔR2*). The linearity in these two separate observable quantities during the infusion indicates that the value of r1 is applicable to the determination of pHe, which is the crux of this approach. This high-resolution pHe map was achieved with a relatively modest concentration of GdDOTA-4AmP, which is ca. 0.10 – 0.20 mM at 16 minutes after infusion. This method is capable of yielding pHe maps within practical times in a clinical setting.
Acknowledgements
Thanks to Christy Howison and Brenda Baggett for technical assistance. This work was supported by NIH grants 5R01CA077575, and RR-02584 and a grant from the Robert A. Welch Foundation (AT-584).
References
- 1.Gatenby RA, Gillies RJ. Why do cancers have high aerobic glycolysis? NAT REV CANCER. 2004;4:891–899. doi: 10.1038/nrc1478. [DOI] [PubMed] [Google Scholar]
- 2.Gillies RJ, Robey I, Gatenby RA. Causes and consequences of increased glucose metabolism of cancers. J NUCL MED. 2008;49:24S–42S. doi: 10.2967/jnumed.107.047258. [DOI] [PubMed] [Google Scholar]
- 3.Robey IF, Baggett BK, Kirkpatrick ND, Roe DJ, Dosescu J, Sloane BF, Hashim AI, Morse DL, Raghunand N, Gatenby RA, Gillies RJ. Bicarbonate increases tumor ph and inhibits spontaneous metastases. Cancer Res. 2009;69:2260–2268. doi: 10.1158/0008-5472.CAN-07-5575. [DOI] [PMC free article] [PubMed] [Google Scholar]
- 4.Bhujwalla ZM, Artemov D, Ballesteros P, Cerdan S, Gillies RJ, Solaiyappan M. Combined vascular and extracellular ph imaging of solid tumors. NMR BIOMED. 2002;15:114–119. doi: 10.1002/nbm.743. [DOI] [PubMed] [Google Scholar]
- 5.Garcia-Martin ML, Herigault G, Remy C, Farion R, Ballesteros P, Coles JA, Cerdan S, Ziegler A. Mapping extracellular ph in rat brain gliomas in vivo by H-1 magnetic resonance spectroscopic imaging: Comparison with maps of metabolites. Cancer Res. 2001;61:6524–6531. [PubMed] [Google Scholar]
- 6.van Sluis R, Bhujwalla ZM, Raghunand N, Ballesteros P, Alvarez J, Cerdan S, Galons JP, Gillies RJ. In vivo imaging of extracellular ph using H-1 MRSI. Magn Reson Med. 1999;41:743–750. doi: 10.1002/(sici)1522-2594(199904)41:4<743::aid-mrm13>3.0.co;2-z. [DOI] [PubMed] [Google Scholar]
- 7.Gallagher FA, Kettunen MI, Day SE, Hu DE, Ardenkjaer-Larsen JH, Zandt R, Jensen PR, Karlsson M, Golman K, Lerche MH, Brindle KM. Magnetic resonance imaging of ph in vivo using hyperpolarized 13c-labelled bicarbonate. Nature. 2008;453:940–943. doi: 10.1038/nature07017. [DOI] [PubMed] [Google Scholar]
- 8.Mori S, Eleff SM, Pilatus U, Mori N, van Zijl PCM. Proton NMR spectroscopy of solvent-saturable resonances: A new approach to study ph effects in situ. Magn Reson Med. 1998;40:36–42. doi: 10.1002/mrm.1910400105. [DOI] [PubMed] [Google Scholar]
- 9.Zhou JY, Lal B, Wilson DA, Laterra J, van Zijl PCM. Amide proton transfer (APT) contrast for imaging of brain tumors. Magn Reson Med. 2003;50:1120–1126. doi: 10.1002/mrm.10651. [DOI] [PubMed] [Google Scholar]
- 10.Zhou JY, Payen JF, Wilson DA, Traystman RJ, van Zijl PCM. Using the amide proton signals of intracellular proteins and peptides to detect ph effects in MRI. NAT MED. 2003;9:1085–1090. doi: 10.1038/nm907. [DOI] [PubMed] [Google Scholar]
- 11.Kalman FK, Woods M, Caravan P, Jurek P, Spiller M, Tircso G, Kiraly R, Brucher E, Sherry AD. Potentiometric and relaxometric properties of a gadolinium-based MRI contrast agent for sensing tissue pH. INORG CHEM. 2007;46:5260–5270. doi: 10.1021/ic0702926. [DOI] [PMC free article] [PubMed] [Google Scholar]
- 12.Garcia-Martin ML, Martinez GV, Raghunand N, Sherry AD, Zhang SR, Gillies RJ. High resolution pH(e) imaging of rat glioma using ph-dependent relaxivity. MAGNETIC RESONANCE IN MEDICINE. 2006;55:309–315. doi: 10.1002/mrm.20773. [DOI] [PubMed] [Google Scholar]
- 13.Raghunand N, Howison C, Sherry AD, Zhang SR, Gillies RJ. Renal and systemic ph imaging by contrast-enhanced MRI. Magnetic Resonance in Medicine. 2003;49:249–257. doi: 10.1002/mrm.10347. [DOI] [PubMed] [Google Scholar]
- 14.Cron GO, Wallace JC, Stevens WD, Fortin T, Pappas BA, Wilkins RC, Kelcz F, Santyr GE. A comparison of T-2(*)-weighted magnitude and phase imaging for measuring the arterial input function in the rat aorta following intravenous injection of gadolinium contrast agent. MAGN RESON IMAGING. 2005;23:619–627. doi: 10.1016/j.mri.2005.02.016. [DOI] [PubMed] [Google Scholar]
- 15.Dimicoli JL, Patry J, Poupon J, Volk A. On the use of R-1 and R-2* for measurement of contrast agent concentration in isolated perfused rat liver. NMR BIOMED. 2003;16:276–285. doi: 10.1002/nbm.846. [DOI] [PubMed] [Google Scholar]
- 16.van Osch MJP, Vonken E, Viergever MA, van der Grond J, Bakker CJG. Measuring the arterial input function with gradient echo sequences. Magn Reson Med. 2003;49:1067–1076. doi: 10.1002/mrm.10461. [DOI] [PubMed] [Google Scholar]
- 17.Posse S, Decarli C, Lebihan D. 3-Dimensional echo-planar MR spectroscopic imaging at short echo times in the human brain. Radiology. 1994;192:733–738. doi: 10.1148/radiology.192.3.8058941. [DOI] [PubMed] [Google Scholar]
- 18.Posse S, Tedeschi G, Risinger R, Ogg R, Lebihan D. High-Speed H-1 Spectroscopic Imaging In Human Brain By Echo-Planar Spatial-Spectral Encoding. Magn Reson Med. 1995;33:34–40. doi: 10.1002/mrm.1910330106. [DOI] [PubMed] [Google Scholar]
- 19.Chu A, Alger JR, Moore GJ, Posse S. Proton echo-planar spectroscopic imaging with highly effective outer volume suppression using combined presaturation and spatially selective echo dephasing. Magnetic Resonance in Medicine. 2003;49:817–821. doi: 10.1002/mrm.10449. [DOI] [PubMed] [Google Scholar]
- 20.Du W, Karczmar GS, Uftring SJ, Du YP. Anatomical and functional brain imaging using high-resolution echo-planar spectroscopic imaging at 1.5 tesla. NMR Biomed. 2005;18:235–241. doi: 10.1002/nbm.952. [DOI] [PubMed] [Google Scholar]
- 21.Du W, Fan X, Foxley S, Zamora M, River JN, Culp RM, Karczmar GS. Comparison of high-resolution echo-planar spectroscopic imaging with conventional MR imaging of prostate tumors in mice. NMR Biomed. 2005;18:285–292. doi: 10.1002/nbm.954. [DOI] [PubMed] [Google Scholar]
- 22.Sarkar S, Heberlein K, Metzger GJ, Zhang XD, Hu XP. Applications of high-resolution echoplanar spectroscopic imaging for structural imaging. J MAGN RESON IMAGING. 1999;10:1–7. doi: 10.1002/(sici)1522-2586(199907)10:1<1::aid-jmri1>3.0.co;2-c. [DOI] [PubMed] [Google Scholar]
- 23.Nelson SJ, Vigneron DB, Star-Lack J, Kurhanewicz J. High spatial resolution and speed in MRSI. Nmr in Biomedicine. 1997;10:411–422. doi: 10.1002/(sici)1099-1492(199712)10:8<411::aid-nbm496>3.0.co;2-8. [DOI] [PubMed] [Google Scholar]
- 24.Yablonskiy DA, Haacke EM. Theory of NMR signal behavior in magnetically inhomogeneous tissues - the static dephasing regime. Magnetic Resonance in Medicine. 1994;32:749–763. doi: 10.1002/mrm.1910320610. [DOI] [PubMed] [Google Scholar]
- 25.Yablonskiy DA. Quantitation of intrinsic magnetic susceptibility-related effects in a tissue matrix. Phantom study. Magnetic Resonance in Medicine. 1998;39:417–428. doi: 10.1002/mrm.1910390312. [DOI] [PubMed] [Google Scholar]
- 26.Bevington PR, Robinson DK. Data reduction and error analysis for the physical sciences. McGraw-Hill. 1992 [Google Scholar]
- 27.Pike MM, Stoops CN, Langford CP, Akella NS, Nabors LB, Gillespie GY. High-Resolution longitudinal assessment of flow and permeability in mouse glioma vasculature: Sequential small molecule and SPIO dynamic contrast agent MRI. Magn Reson Med. 2009;61:615–625. doi: 10.1002/mrm.21931. [DOI] [PMC free article] [PubMed] [Google Scholar]
- 28.Vincensini D, Dedieu V, Renou JP, Otal P, Joffre F. Measurements of extracellular volume fraction and capillary permeability in tissues using dynamic spin-lattice relaxometry: Studies in rabbit muscles. Magn Reson Imaging. 2003;21:85–93. doi: 10.1016/s0730-725x(02)00638-0. [DOI] [PubMed] [Google Scholar]
- 29.Landis CS, Li X, Telang FW, Molina PE, Palyka I, Vetek G, Springer CS. Equilibrium transcytolemmal water-exchange kinetics in skeletal muscle in vivo. Magnetic Resonance in Medicine. 1999;42:467–478. doi: 10.1002/(sici)1522-2594(199909)42:3<467::aid-mrm9>3.0.co;2-0. [DOI] [PubMed] [Google Scholar]
- 30.Yankeelov TE, Rooney WD, Li X, Springer CS. Variation of the relaxographic "shutter-speed" for transcytolemmal water exchange affects the CR bolus-tracking curve shape. Magnetic Resonance in Medicine. 2003;50:1151–1169. doi: 10.1002/mrm.10624. [DOI] [PubMed] [Google Scholar]


