Abstract
Ovarian cancer is the fifth-leading cause of cancer-related deaths among women as a result of late diagnosis. For survival rates to improve, more sensitive and specific methods for earlier detection of ovarian cancer are needed. This study presents the development of rapid and specific one-step circulating tumor cell (CTC) detection using flow cytometry in a whole-blood sample with fluorescent silica nanoparticles. We prepared magnetic nanoparticle (MNP)-SiO2(rhodamine B isothiocyanate [RITC]) (MNP-SiO2[RITC] incorporating organic dyes [RITC, ëmax(ex/em) = 543/580 nm]) in the silica shell. We then controlled the amount of organic dye in the silica shell of MNP-SiO2(RITC) for increased fluorescence intensity to overcome the autofluorescence of whole blood and increase the sensitivity of CTC detection in whole blood. Next, we modified the surface function group of MNP-SiO2(RITC) from -OH to polyethylene glycol (PEG)/COOH and conjugated a mucin 1 cell surface-associated (MUC1) antibody on the surface of MNP-SiO2(RITC) for CTC detection. To study the specific targeting efficiency of MUC1-MNP-SiO2(RITC), we used immunocytochemistry with a MUC1-positive human ovarian cancer cell line and a negative human embryonic kidney cell line. This technology was capable of detecting 100 ovarian cancer cells in 50 μL of whole blood. In conclusion, we developed a one-step CTC detection technology in ovarian cancer based on multifunctional silica nanoparticles and the use of flow cytometry.
Keywords: circulating tumor cells, CTCs, fluorescent nanoprobe, MUC1, ovarian cancer
Introduction
Ovarian cancer is the fifth-leading cause of cancer-related deaths among women and the most lethal of the gynecological cancers.1 Symptoms of ovarian cancer are nonspecific, and most women have advanced (stage 3 or 4) disease at presentation. The high mortality rate in patients with ovarian cancer is primarily attributable to late diagnosis.2 Metastases occur due to peritoneal, lymphatic, or hematogenous spread of tumor, with the peritoneal route being the most common. Because they are primarily peritoneal rather than parenchymal in location, metastases from ovarian cancer are unlike most other tumors. They usually occur on the surfaces of the viscera rather than as masses within the viscera. These tumor implants can be military and isoattenuating relative to the viscera, which makes their detection challenging.
A number of approaches are used to detect recurrent metastatic lesions after initial surgery and chemotherapy for ovarian cancer. These approaches include physical examination, determination of serum cancer antigen-125 levels, and imaging. Computed tomography, magnetic resonance imaging, and positron emission tomography have all been used to evaluate affected patients. However, such modalities have limited sensitivity and accuracy in detecting recurrence in early stages.
The investigation of circulating tumor cells (CTCs) in peripheral blood or documented disseminated tumor cells in bone marrow has gained considerable attention. CTC detection could become a valuable tool for early-stage cancer diagnosis and could serve as a real-time tumor biopsy to assess tumor invasion.3 In ovarian cancer research, a relationship has been reported between CTCs or disseminated tumor cells and the diagnosis of metastases. The first studies, which used immunocytochemistry, were published in 1990.4 Since then, several studies have investigated the detection of CTCs in peripheral blood of ovarian cancer patients,5–8 mainly by applying cytological methods.
The most common approaches for the detection of CTCs consist of positive immunomagnetic enrichment based on frequently expressed surface markers, followed by reverse transcription polymerase chain reaction (RT-PCR) or immunocytochemistry for visualization and quantification. RT-PCR has a higher sensitivity than immunocytochemistry but a higher false-positive rate. Immunocytochemistry is regarded as having greater specificity, but the maximum sample size it can detect by one measurement is only 5 × 10⁵ cells, even though the ideal cell sample size is 2.5 × 10⁸ cells. For this reason, simple immunocytochemistry technology is limited in the detection of the CTCs.9
Recently, nanotechnology has been used to overcome the disadvantages of traditional CTC detection methods. For example, immunomagnetic nanoparticle (NP) enrichment has been reported to improve CTC separation rates 1000 to ~10,000 times.10 Moreover, modified immunomagnetic NPs and methods using both immunomagnetic NPs for isolation and quantum dots for identification have been developed for CTC detection.11,12
However, these assays require multiple sequential process steps, such as erythrocyte lysis, CTC enrichments with immunomagnetic NPs, recovery for molecular analysis, washing, and identification using quantum dots or RT-PCR. Every additional step increases time, requires reagents, involves fluid manipulation, and introduces variability. An opposite approach would be to develop an assay technology that is based on only a single biofunctional probe. For single-step detection, the probe must be capable of detection, visualization, and quantification. To achieve these requirements, it is essential to develop NPs with enhanced fluorescent ability, surface-modified target molecules such as an antibody, and quantifiable fluorescence. With these capabilities in place, one-step CTC detection will be rapid and accurate and will be useful in clinical application.
Here, we applied fluorescent NPs combined with mucin 1 (MUC1), cell surface-associated antibody in a one-step CTC detection method based on multifunctional silica NPs. To overcome the autofluorescence of the whole-blood sample, we developed a fluorescent nanoprobe with enhanced fluorescent intensity (magnetic NP [MNP]-SiO2[rhodamine B isothiocyanate (RITC)]) and then combined it with the MUC1 monoclonal antibody. The MUC1 monoclonal antibody was efficient in the detection of epithelial ovarian cancer cells from primary to metastatic disease.11,12 Using these NPs combined with the MUC1 monoclonal antibody, we experimentally detected ovarian cancer cells in prepared samples containing whole blood and various quantities of human ovarian cancer cells (OVCAR-3). We investigated the rapidity and accuracy of the fluorescent NPs combined with MUC1 in detecting CTCs. We hope that this report will contribute to the early diagnosis of metastases of ovarian cancer and to other biomedical fields.
Materials and methods
Preparation and modification of MNP-SiO2(RITC)
Synthesis of MNP-SiO2(RITC)
Water-soluble, bare cobalt ferrite MNPs of average size (about 9 nm) were synthesized with a slightly modified version of the coprecipitation method13,14 from FeCl3 · 6H2O and CoCl2 · 6H2O in a hot basic NaOH solution. The cobalt ferrite solution (34.7 mL, 20 mg/mL in H2O) was added to a polyvinylpyrrolidone solution (0.65 mL, 25.6 g/L in H2O), and the mixture was stirred for 24 hours at room temperature. The polyvinylpyrrolidone-stabilized cobalt ferrite NPs were then separated by the addition of aqueous acetone (H2O/acetone = 1/10, v/v) and centrifugation at 2500 × g for 10 minutes. The supernatant was removed and the precipitated NPs were washed with acetone and redispersed in ethanol (10 mL). We mixed 10 mL of cobalt ferrite solution (containing 0.5 g of cobalt ferrite in absolute ethanol), 0.75 mL of tetraethoxyorthosilicate, and 3-aminopropyltriethoxysilane-derivatized RITC solution, which was that RITC (2.08 mg, 4.17 mg, 8.35 mg, and 12.52 mg) reacted with 3-aminopropyltriethoxysilane (10 mg, 45.3 μmol) in 5 mL of absolute ethanol in the dark for 17 hours. The reaction was initiated by adding 8.0 mL of NH4OH (30 wt% NH3 in H2O). The mixture was stirred for 22 hours in a shaker at 25°C and 250 rpm. The total volume of the solution was then adjusted to 50 mL with ethanol. The mixture was then centrifuged (25,000 × g, 20 minutes) and the derivatized product was washed twice with ethanol.
Measurement of fluorescence intensity
For the measurement of the fluorescence intensity of MNP-SiO2(RITC), NPs were prepared in ethanol (2 mg/mL) and their emission spectra were measured by using Steady State Spectrometer (QuantaMaster, Photon Technology International, Birmingham, NJ, USA).
Preparation of MNP-SiO2(RITC)-PEG/COOH
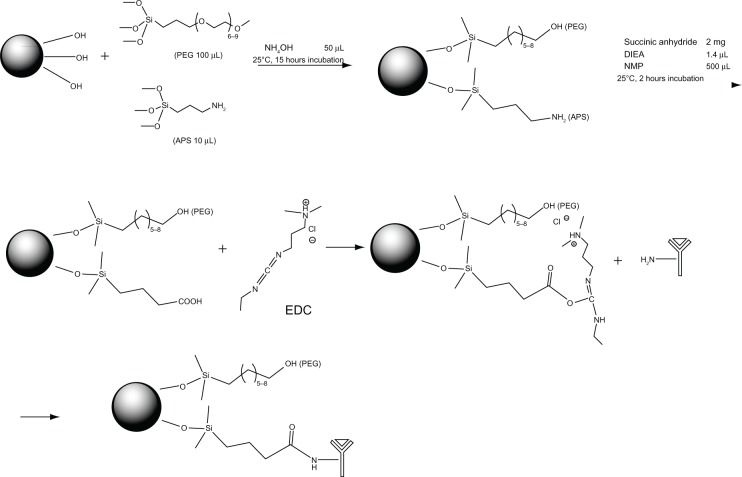
MNP-SiO2 (RITC) (2 mg/mL) was processed by centrifugation (16,000 × g, 20 minutes) and redispersed in ethanol solution. A dispersed ethanol solution of MNP-SiO2 (RITC) (1 mL, 2 mg/mL) was added to Si-PEG (2[methoxy(polyethyleneoxy)propyl] trimethoxysilane) (100 μl), APS (3-aminopropyl) triethoxysilane (10 μl), and ammonia solution (50 μL, 30 wt% by NH3). The mixture was stirred for 20 hours at room temperature. PEG/NH2 NPs were isolated from unreacted Si compounds by centrifugation and washing with ethanol several times and N-methyl-2-pyrrolidone (NMP) solution one time. Succinic anhydride (2 mg) and N,N-diisopropylethylamine (1.4 μL) were added to PEG/NH2-modified NPs redispersed in NMP solution and the mixture was stirred for 2 hours at room temperature. The product was isolated by centrifugation (16,000 × g, 20 minutes) and washed twice with NMP solution.
Coupling MUC1 antibody to the surface of MNP-SiO2(RITC)
MNP-SiO2(RITC)-PEG/COOH was mixed with methanol and separated by centrifugation at 16,000 × g for 20 minutes. The supernatant was removed, and methanol was added again. Precipitated particles were redispersed using a sonicator for 20 minutes. This process was repeated several times. Finally, the modified NPs were redispersed in anhydrous 2-(N-morpholino) ethanesulfonic acid (MES; 10 mL) solution. MNP-SiO2(RITC)-PEG/COOH solution (100 μL, 2 mg/mL) was added to 1-ethyl-3-(3-dimethyl aminopropyl) carbodiimide hydrochloride (10 mg), and MUC1 monoclonal antibody (Abcam plc, Cambridge, UK) (20 μL, 0.5 mg/mL) in 1 mL of MES buffer. The mixture was rotated for 2 hours at room temperature. The product was isolated by centrifugation (16,000 × g, 20 minutes) and washed twice with phosphate buffered saline (PBS).
Transmission electron microscopy
Transmission electron microscopy (TEM) images were obtained using a JEM 1010 transmission electron microscope (JEOL, Tokyo, Japan) at 100 keV. Diluted silica NPs in ethanol were deposited on a copper grid (300 mesh and covered with carbon).
Ultraviolet experiment
To confirm the MUC1 antibody binding on the MNP-SiO2(RITC), we used an S-3100 ultraviolet-visible (UV-Vis) spectrophotometer (Scinco Co, Ltd, Seoul, Korea). Samples of MNP-SiO2(RITC) and MUC1-MNP-SiO2(RITC) (1 mL, 0.2 mg/mL in PBS) were prepared and subjected to UV-Vis spectroscopy.
Specific targeting of MUC1-MNP-SiO2(RITC)
Cell culture
A human embryonic kidney cell line (HEK293T) and a human ovarian cancer cell line (OVCAR-3) were obtained from the Korean Cell Line Bank and cultured in Dulbecco’s Modified Eagle’s Minimum Essential Medium (Gibco®; Life Technologies, Carlsbad, CA, USA) (HEK293T) and RPMI 1640 (Gibco®; Life Technologies) (OVCAR-3) containing 10% fetal bovine serum (Gibco®; Life Technologies), 1% penicillin (Gibco®; Life Technologies), and 100 μg/mL streptomycin (Gibco®; Life Technologies) at 37°C in a 5% CO2 humidified atmosphere.
Immunocytochemistry using MUC1-MNP-SiO2(RITC)
The cells were harvested with trypsin (PAA Laboratories, Piscataway, NJ, USA) and resuspended in PBS. After rinsing in PBS, the cells were suspended at a concentration of 1000 cells/μL in 50 μL PBS and then incubated for 30 minutes at room temperature with 50 μL, 2 mg/mL MUC1-MNP-SiO2(RITC). The cells were then washed and fixed with 4% paraformaldehyde until analysis with fluorescence microscope imaging.
One-step detection of CTCs in a blood model
Immunocytochemistry in a blood model
OVCAR-3 cells were harvested with trypsin and resuspended in PBS. After rinsing in PBS, the cells were suspended at a concentration of 1000 cells/μL in 100 μL PBS, mixed with 50 μL normal human blood, incubated for 30 minutes at room temperature with the 50 μL, 2 mg/mL MUC1-MNP-SiO2(RITC), washed, and finally fixed until analysis with fluorescence microscope imaging.
Flow cytometry (FCM) in a blood model
OVCAR-3 cells were harvested with trypsin and resuspended in PBS. After rinsing in PBS, the cells were counted by using LSRFortessa cell analyzer (BD Biosciences, San Jose, CA, USA) and suspended at concentrations of 100, 1000, and 10,000 cells in 100 μL PBS. We made an indirect blood model that mixed OVCAR-3 cells and 50 μL normal human blood. The complete blood cell count was assessed for unspiked blood by an autoanalyzer (Advia-120, Siemens Healthcare Diagnostics, Deerfield, IL, USA). Next, we incubated the indirect blood models with 50 μL, 2 mg/mL of MUC1-MNP-SiO2(RITC) for 30 minutes at room temperature. After adding 2.8 mL PBS without washing, we analyzed with a LSRFortessa cell analyzer. Cell-associated fluorescence (107 cells/sample) was analyzed.
Specificity test of one-step detection
OVCAR-3 cells were harvested and suspended at concentrations of 100, 1000, and 10,000 cells in 100 μL PBS and fixed with 4% paraformaldehyde. We then stained nucleic acid with 4′,6-diamidino-2-phenylindole (DAPI) fluorescent stain (Life Technologies, Carlsbad, CA, USA). After rinsing in PBS, we made an indirect blood model that mixed stained cells and 50 μL normal human blood. Next we incubated the indirect blood model with 50 μL, 2 mg/mL of MUC1-MNP-SiO2(RITC) for 30 minutes at room temperature. After adding 2.8 mL PBS without washing, we analyzed with a LSRFortessa cell analyzer. Cell-associated fluorescence (107 cells/sample) was analyzed.
Results
Characterization of MNP-SiO2(RITC) and MUC1-MNP-SiO2(RITC)
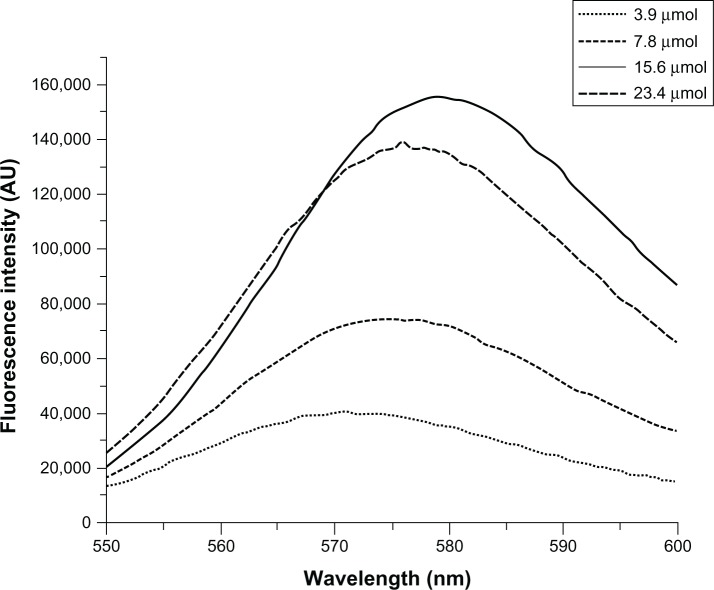
First, we prepared MNP-SiO2(RITC) incorporating organic dyes (RITC, ëmax(ex/em) = 543/580 nm) in the silica shell. We have previously reported the synthesis of organic dye-incorporated MNP-SiO2(RITC), which exhibited increased fluorescence intensity and photostability.15,16 In this study, we prepared NPs with various amounts of organic dye (2.08 mg, 4.17 mg, 8.35 mg, and 12.52 mg) to increase the fluorescent intensity and optimize the synthesis. After the successful preparation of fluorescent NPs, we measured their shape by TEM and their fluorescence intensity by fluorescent spectrometer. Figure 1 shows that with increasing organic dye content, the fluorescence intensity of MNP-SiO2(RITC) increased. However, the most enhanced fluorescent intensity was not observed in the case of NPs with 12.52 mg of organic dye. On the basis of these results, we prepared fluorescent NPs with 8.35 mg of organic dye in our experiment.
Figure 1.
Measurement of the fluorescent intensity of MNP-SiO2(RITC).
Notes: Measurement of the fluorescent intensity of MNP-SiO2(RITC) by GEN-2 Fluorescence Lifetime Spectrometer-Steady State Quanta Master (Photon Technology International, Birmingham, NJ, USA). We prepared nanoparticles with various amounts of organic dye (2.08 mg, 4.17 mg, 8.35 mg, and 12.52 mg) to increase the fluorescent intensity and optimize the synthesis.
Abbreviations: MNP-SiO2(RITC), magnetic nanoparticle-SiO2(rhodamine B isothiocyanate [RITC]); AU, absorbance units.
To combine the antibody, we modified the surface of the NPs with a functional moiety with PEG/COOH. The functional group PEG is reported to be useful to increase biocompatibility.17 It is well established that the functional group COOH can be conjugated with biomolecules just like the amine group of the antibody. Then, we conjugated MUC1 antibody on the surface of MNP-SiO2(RITC) for the CTC detection (Figure 2). We analyzed the size of MUC1-MNP-SiO2(RITC) by using TEM imaging (Figure 3). In TEM imaging of MNP-SiO2(RITC) and MUC1-MNP-SiO2(RITC), no difference in shape, such as that resulting from agglomeration, was evident after the antibody conjugation.
Figure 2.
Scheme of MUC1 antibody conjugation on the surface of MNP-SiO2(RITC) nanoparticles.
Abbreviations: MUC1, mucin 1 cell surface-associated antibody; MNP-SiO2(RITC), magnetic nanoparticle-SiO2(rhodamine B isothiocyanate); PEG, polyethylene glycol; APS, (3-aminopropyl)triethoxysilane; EDC, 1-ethyl-3-(3-dimethylaminopropyl) carbodiimide hydrochloride; DIEA, N,N-diisopropylethylamine; NMP, N-methyl-2-pyrrolidone.
Figure 3.
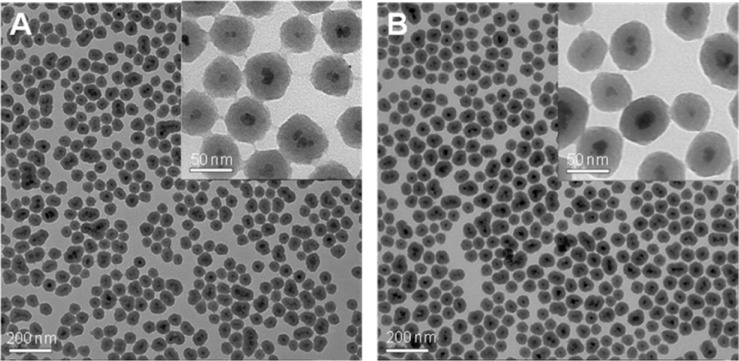
TEM images of MNP-SiO2(RITC) and MUC1-MNP-SiO2(RITC).
Notes: (A) MNP-SiO2(RITC). (B) MUC1-MNP-SiO2(RITC).
Abbreviations: TEM, transmission electron microscopy; MUC1, mucin 1 cell surface-associated antibody; MNP-SiO2(RITC), magnetic nanoparticle-SiO2(rhodamine B isothiocyanate).
To confirm the combination between MUC1 antibody and MNP-SiO2(RITC), we measured the UV-Vis spectra of MNP-SiO2(RITC) and MUC1-MNP-SiO2(RITC). Two peaks were observed in the UV-Vis spectra of MUC1-MNP-SiO2(RITC) in PBS at pH 7.4: one at 580 nm attributed to RITC and the other at 280 nm attributed to protein signal. These experimental results implied that MUC1 antibody was conjugated on the MNP-SiO2(RITC) (Figure 4).
Figure 4.
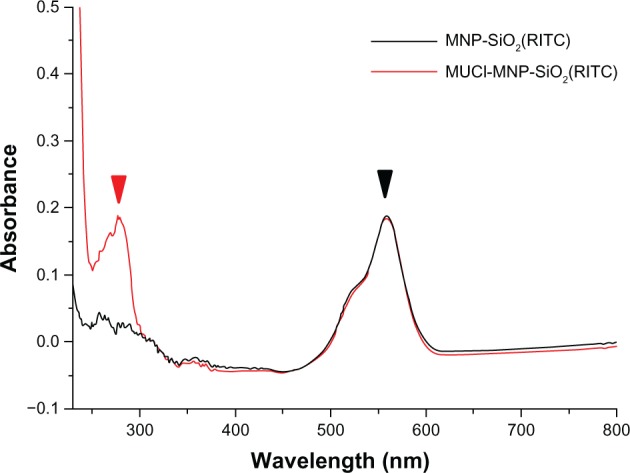
UV-Vis spectra of MNP-SiO2(RITC) and MUC1-MNP-SiO2(RITC).
Notes: Both MNP-SiO2(RITC) (black line) and MUC1-MNP-SiO2(RITC) (red line) show the same fluorescence peak of RITC (580 nm) (black arrow) but only MUC1-MNP-SiO2(RITC) shows a protein peak (280 nm) (red arrow).
Abbreviations: UV-Vis, ultraviolet-visible spectra; MNP-SiO2(RITC), magnetic nanoparticle-SiO2(rhodamine B isothiocyanate); MUC1, mucin 1 cell surface-associated antibody.
Specific targeting of MUC1-MNP-SiO2(RITC)
To confirm the MUC1 antibody function on the surface of the NPs, we incubated the MUC1-MNP-SiO2(RITC) with OVCAR-3 cells and HEK293T cells for 30 minutes. The OVCAR-3 cell line is a positive cell line against MUC1 and HEK293T is a negative cell line for control. A fluorescent signal was observed only in the OVCAR-3 cell lines, indicating that MUC1 antibody combined on the NPs performed well without nonspecific targeting with a negative cell line (Figure 5). To validate the clinical application, we designed an indirect blood model including the OVCAR-3 cell line and whole-blood cells. Each group of the indirect blood model included the OVCAR-3 cells. A red fluorescent signal was observed for the OVCAR-3 cell line without interference of autofluorescence from erythrocytes (Figure 6).
Figure 5.
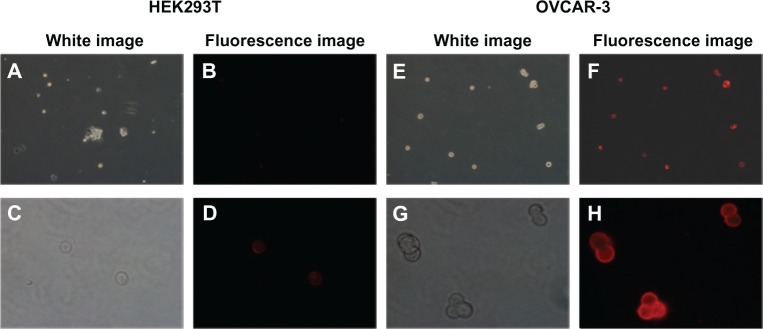
Fluorescence microscopy image of HEK293T and OVCAR-3 cells incubated with MUC1-MNP-SiO2(RITC) nanoprobe.
Notes: (A–D) HEK293T cells (MUC1 negative cell lines). (E–H) OCVCAR-3 cells (MUC1 positive cell lines). The magnification of the upper row of panels is 100×. The magnification of the lower row of panels is 400×.
Abbreviations: HEK293T, human embryonic kidney cell line; OVCAR-3, human ovarian cancer cell line; MUC1, mucin 1 cell surface-associated antibody; MNP-SiO2(RITC), magnetic nanoparticle-SiO2(rhodamine B isothiocyanate).
Figure 6.
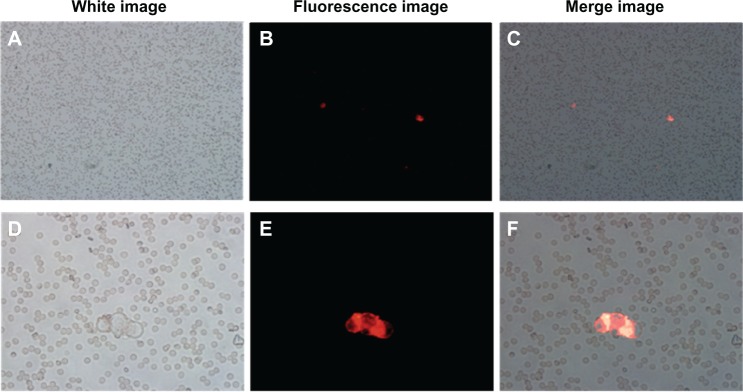
Fluorescence microscopy image of the indirect blood model including OVCAR-3 cells incubated with MUC1-MNP-SiO2(RITC).
Notes: (A–C) the magnification in these panels is 100× (D–F) the magnification in these panels is 400×. The magnification in these panels is 400×. The red signal detected on the surface of OVCAR-3 cells.
Abbreviations: OVCAR-3, human ovarian cancer cell line; MUC1, mucin 1 cell surface-associated antibody; MNP-SiO2(RITC), magnetic nanoparticle-SiO2(rhodamine B isothiocyanate).
One-step detection of CTCs by flow cytometry in a blood model
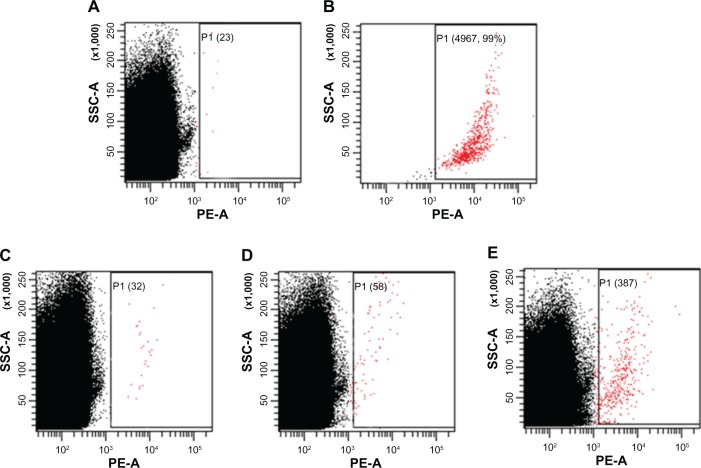
To define the detection limitation of our system, we modified the indirect blood model with various quantities of OVCAR-3 cells. We prepared three indirect blood models using 50 μL of whole-blood sample mixed with 100, 1000, and 10,000 OVCAR-3 cells. The total blood cell count, including red blood cells and white blood cells, was 5.3 × 10⁶/μL from unspiked whole blood measured by an autoanalyzer. Each sample was then analyzed by FCM until a total cell count of 107 was reached. The number of cells with a positive signal indicative of OVCAR-3 cells was counted as 23, 32, 58, and 387 in the unspiked sample and indirect blood models with 100, 1000, and 10,000 OVCAR-3 cells, respectively (Figure 7). In the group with 100 OVCAR-3 cells, the ratio of the detected cancer cells was higher than the estimated value.
Figure 7.
Flow cytometry analysis of the indirect blood samples including OVCAR-3 cells after incubation with MUC1-MNP-SiO2(RITC).
Notes: (A) Unspiked blood samples. (B) Positive control (5000 OVCAR-3 cells). (C) Indirect blood samples with 100 OVCAR-3 cells. (D) Indirect blood samples with 1000 OVCAR-3 cells. (E) Indirect blood samples with 10,000 OVCAR-3 cells. Numbers of positive cells are shown in parentheses and indicated by red dots.
Abbreviations: OVCAR-3, human ovarian cancer cell line; MUC1, mucin 1 cell surface-associated antibody; P1, population 1; MNP-SiO2(RITC), magnetic nanoparticle-SiO2(rhodamine B isothiocyanate); SSC-A, side scatter area; PE-A, phycoerythrin area.
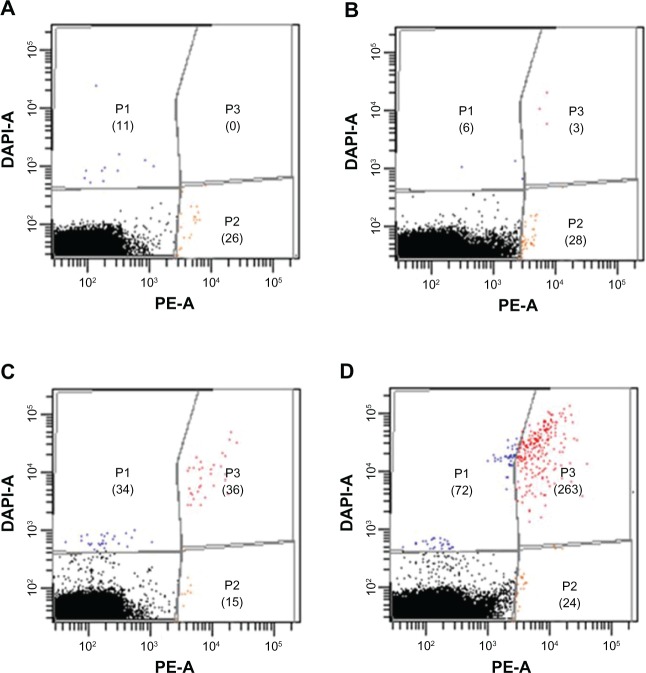
To confirm the specificity of our system, we prepared other indirect blood models with 100, 1000, and 10,000 DAPI-stained OVCAR-3 cells. Each indirect blood model was analyzed by FCM until a total cell count of 107 was reached. We set up the experimental template in three populations with a dot plot and used a gating tool. The number of cells in each population is shown in Figure 8. MUC1-MNP-SiO2(RITC) targeting is shown on the x-axis and DAPI staining on the y-axis. Populations 1 and 2 represented nonspecific detection. The number of nonspecific cells detected in population 2 was counted as 26, 24, 15, and 28 for the unspiked sample and the indirect blood models with 100, 1000, and 10,000 OVCAR-3 cells. This result means that the average number of nonspecific cells was counted as 23.3 ± 5.7 by our system. However, the number of cells with a positive signal in population 3 was 0, 3, 36, and 263 for the unspiked sample and the indirect blood models with 100, 1000 and 10,000 DAPI-stained OVCAR-3 cells, respectively. In our results, the detected cells in the indirect blood models (5.3 × 10⁶/μL) matched the designed ratio.
Figure 8.
Flow cytometry analysis of the indirect blood samples including DAPI staining of OVCAR-3 cells after incubation with MUC1-MNP-SiO2(RITC).
Notes: (A) Unspiked blood samples. (B) Indirect blood samples with 100 OVCAR-3 cells. (C) Indirect blood samples with 1000 OVCAR-3 cells. (D) Indirect blood samples with 10,000 OVCAR-3 cells. Numbers of positive cells are shown in parentheses.
Abbreviations: DAPI, 4′,6-diamidino-2-phenylindole fluorescent stain; OVCAR-3, human ovarian cancer cell line; MUC1, mucin 1 cell surface-associated antibody; MNP-SiO2(RITC), magnetic nanoparticle-SiO2(rhodamine B isothiocyanate); DAPI-A, 4’,6-diamidino-2-phenylindole area; PE-A, phycoerythrin area; P1, population 1; P2, population 2; P3, population 3.
Discussion
The early diagnosis of cancer is a challenging area in life science. Earlier detection is particularly important in the case of ovarian cancer, in order to improve therapeutic outcomes and decrease the mortality rate. Recently, the detection of CTCs has become a valuable tool for the early-stage detection and management of ovarian cancer. However, the exceedingly low number of CTCs in the blood, which can be as few as one per 109 hematological cells, has rendered CTC detection very difficult.
Generally, CTC detection involves several steps, including enrichment of CTCs in whole blood, washing, antibody incubation in a dark room, resuspension of cells and then detection by RT-PCR, immunocytometry, or fluorescence-activated cell sorting. However, this multistep detection is expensive and some target cells can be lost, leading to a higher false-negative rate. Because the enrichment of CTCs by using immunomagnetic methods requires antibody-conjugated magnetic carriers and a detection system using a fluorescence probe, we assumed that the fabrication of new nanoprobes combining antibody-conjugated magnetic carriers and a fluorescence probe would facilitate the development of a one-step CTC detection system. In whole blood, fluorescence intensity is increased to overcome the autofluorescence of the blood for CTC detection.
In our study, we successfully prepared a nanoprobe (MNP-SiO2[RITC]) with enhanced fluorescence. To increase the fluorescent intensity of the NPs, we prepared NPs with various concentrations of organic dye. In the case of fluorescent NPs such as MNP-SiO2(RITC), the quantum yield and brightness of the fluorescence correlated directly with the number of dye/NPs and the size. However, the overall improvement of fluorescence brightness was only marginal (homogenous fluorescence resonance energy transfer quenching).18 Therefore, we synthesized MNP-SiO2(RITC) with various concentrations of dye/NP. The size was maintained at 50 nm in order to maintain the water-solubility and dispersibility of MNP-SiO2(RITC), on the basis of previous studies (Figure 3).15,16 As a result of optimization, we successfully increased the fluorescence intensity of MNP-SiO2(RITC) fourfold, with an optimized organic dye concentration of 8.35 mg.
To successfully develop the one-step CTC detection system, it is very important to select a suitable biomarker. However, only a few studies have investigated CTCs of ovarian cancer and they have mainly applied cytological methods for the detection of CTCs, such as the CELLSEARCH CTC test system that uses epithelial cell adhesion molecule (EpCAM) antibody.19 However, EpCAM-based CTC detection may cause false-positive results from leukocytes and might even be lost during cancer progression.20 Therefore, EpCAM might not be suitable as a biomarker for the early detection of CTCs in patients with ovarian cancer. Mucins are high-molecular-weight glycoproteins widely expressed in low levels by epithelial cells, while a poorly glycosylated form is overexpressed by ovarian cancers.21 Especially, MUC1 are overexpressed in both early and late stages of most types of epithelial ovarian cancer.12,22 Therefore, we selected MUC1 antibody as a biomarker for CTCs. Moreover, MUC1 is overexpressed on most adenocarcinomas, including breast, lung, colon, pancreas, stomach, and prostate cancers.23–25 MUC1-MNP-SiO2(RITC) can be used to detect various cancers that are overexpressing MUC1. MUC1 is not a hallmark for ovarian cancer in general: one-step detection of CTC using MUC1 will be limited to the diagnosis of epithelial ovarian cancer. It may be necessary to adopt biomarkers such as cancer antigen-125, lysophosphatidic acid, and human epididymis protein 4 in order to develop and improve one-step detection of CTC in ovarian cancer.
We combined the MUC1 antibody with a fluorescence-enhanced nanoprobe (MNP-SiO2[RITC]) and confirmed the MUC1-MNP-SiO2(RITC) by using UV-Vis spectra. UV-Vis spectra data clearly showed a protein peak in MUC1-MNP-SiO2(RITC) but not in MNP-SiO2(RITC) (Figure 4). These data simply mean that MUC1 antibody was conjugated on the surface of our probe. We confirmed the specific binding capacity of our probe using immunocytochemistry. A fluorescent signal was observed only in the OVCAR-3 cell lines when treated by MUC1-MNP-SiO2(RITC) (Figure 5).
For one-step CTC detection using a whole-blood sample, the fluorescent intensity of the probe must be enough to overcome the autofluorescence derived from the erythrocyte. According to a study by Masilamani et al,26 blood auto-fluorescence occurs at excitation wavelengths of 400 nm, 590 nm, and 630 nm, which normally can interfere during the detection of other fluorophores. We therefore designed an indirect blood model with a mix of normal blood and OVCAR-3 cells to validate the possibility of one-step CTC detection using MUC1-MNP-SiO2(RITC). As shown in Figure 6, MUC1-MNP-SiO2(RITC) was targeted to the OVCAR-3 cells without interference of autofluorescence derived from the erythrocyte in the indirect blood model. Our results demonstrated the efficiency of our one-step detection system using fluorescence for detecting the target cells in the whole-blood sample without erythrocyte lysis.
Finally, we performed one-step detection of CTCs with MUC1-MNP-SiO2(RITC) using FCM. According to a study by Hu et al27 comparing the FCM method with RT-PCR methods, the in vitro FCM method has more specificity whereas the RT-PCR method has higher sensitivity. However, in in vivo assay, the FCM method is more important and sensitive because tumor cells may crack due to the presence of membrane fragments in the blood and inhibitors of the PCR reaction in body fluids. Moreover, the advantage of FCM is that a very large number of cells can be evaluated quickly, and single cells can be separated from whole blood. This capability makes FCM a valuable tool for analyzing rare events such as CTC detection. Therefore, we used FCM to try to detect CTCs with our probes. We prepared three indirect blood models with 100, 1000, and 10,000 OVCAR-3 cells and an unspiked sample without OVCAR-3 cells. The number of cells with a positive signal indicative of OVCAR-3 cells was counted as 23, 32, 58, and 387 for the unspiked sample and the indirect blood models with 100, 1000, and 10,000 OVCAR-3 cells, respectively (Figure 7). In the model with the fewest OVCAR-3 cells, the ratio of the detected cancer cells was higher than the expected value. However, when we considered the nonspecific cells detected among the positive cells, the number of detected cells in the indirect blood model matched the designed ratio. We therefore had to confirm the specificity of our one-step detection system using DAPI staining. In order to confirm the specificity of our system, we prepared another set of indirect blood models with 100, 1000, and 10,000 DAPI-stained OVCAR-3 cells and analyzed fluorescence signal in three populations using FCM until a total cell count of 107 was achieved. Population 2 (representing nonspecific detection) was related with cells bounded by MUC1-MNP-SiO2(RITC) (Figure 8). The numbers of nonspecific cells detected in population 2 were counted as 26, 24, 15, and 28 for the unspiked sample and the indirect blood models with 100, 1000, and 10,000 OVCAR-3 cells, respectively, or 23.3 ± 5.7 cells on average, representing the minimal value of limitation of our one-step detection system using FCM. However, the numbers of cells with a positive signal in population 3 were 0, 3, 36, and 263 for the unspiked sample and the direct blood models with 100, 1000, and 10,000 DAPI-stained OVCAR-3 cells, respectively. Considering the total blood cell number (5.3 × 10⁶/μL), these results matched the designed ratio.
Conclusion
Our results demonstrate the good performance of the proposed one-step detection of CTCs with fluorescence-enhanced nanoprobe MUC1-MNP-SiO2(RITC). In this study, we showed the possibility for one-step CTC detection using the fluorescence property of our probes. We hope that our research will contribute to the development of one-step CTC detection technology for application in clinical diagnosis.
Acknowledgments
This research was supported by the Nano R&D Program through the National Research Foundation of Korea (NRF) funded by the Korean Ministry of Education, Science and Technology (2009-082712, 2010-0008766), Korea Food and Drug Administration (13182KFDA606), and grant 2011-0580 from Seoul National University Hospital Research Fund.
Footnotes
Disclosure
The authors report no conflicts of interest in this work.
References
- 1.Jemal A, Bray F, Center MM, Ferlay J, Ward E, Forman D. Global cancer statistics. CA Cancer J Clin. 2011;61(2):69–90. doi: 10.3322/caac.20107. [DOI] [PubMed] [Google Scholar]
- 2.Clarke-Pearson DL. Clinical practice. Screening for ovarian cancer. N Engl J Med. 2009;361(2):170–177. doi: 10.1056/NEJMcp0901926. [DOI] [PubMed] [Google Scholar]
- 3.Paterlini-Brechot P, Benali NL. Circulating tumor cells (CTC) detection: clinical impact and future directions. Cancer Lett. 2007;253(2):180–204. doi: 10.1016/j.canlet.2006.12.014. [DOI] [PubMed] [Google Scholar]
- 4.Cain JM, Ellis GK, Collins C, et al. Bone marrow involvement in epithelial ovarian cancer by immunocytochemical assessment. Gynecol Oncol. 1990;38(3):442–445. doi: 10.1016/0090-8258(90)90088-3. [DOI] [PubMed] [Google Scholar]
- 5.Fan T, Zhao Q, Chen JJ, Chen WT, Pearl ML. Clinical significance of circulating tumor cells detected by an invasion assay in peripheral blood of patients with ovarian cancer. Gynecol Oncol. 2009;112(1):185–191. doi: 10.1016/j.ygyno.2008.09.021. [DOI] [PMC free article] [PubMed] [Google Scholar]
- 6.Marth C, Kisic J, Kaern J, Tropé C, Fodstad Ø. Circulating tumor cells in the peripheral blood and bone marrow of patients with ovarian carcinoma do not predict prognosis. Cancer. 2002;94(3):707–712. doi: 10.1002/cncr.10250. [DOI] [PubMed] [Google Scholar]
- 7.Wimberger P, Heubner M, Otterbach F, Fehm T, Kimmig R, Kasmir-Bauer S. Influence of platinum-based chemotherapy on disseminated tumor cells in blood and bone marrow of patients with ovarian cancer. Gynecol Oncol. 2007;107(2):331–338. doi: 10.1016/j.ygyno.2007.07.073. [DOI] [PubMed] [Google Scholar]
- 8.He W, Kularatne SA, Kalli KR, et al. Quantitation of circulating tumor cells in blood samples from ovarian and prostate cancer patients using tumor-specific fluorescent ligands. Int J Cancer. 2008;123(8):1968–1973. doi: 10.1002/ijc.23717. [DOI] [PMC free article] [PubMed] [Google Scholar]
- 9.Krebs MG, Hou JM, Ward TH, Blackhall FH, Dive C. Circulating tumor cells: their utility in cancer management and predicting outcomes. Ther Adv Med Oncol. 2010;2(6):351–365. doi: 10.1177/1758834010378414. [DOI] [PMC free article] [PubMed] [Google Scholar]
- 10.Martin VM, Siewert C, Scharl A, et al. Immunomagnetic enrichment of disseminated epithelial tumor cells from peripheral blood by MACS. Exp Hematol. 1998;26(3):252–264. [PubMed] [Google Scholar]
- 11.Wang L, Ma J, Liu F, et al. Expression of MUC1 in primary and metastatic human epithelial ovarian cancer and its therapeutic significance. Gynecol Oncol. 2007;105(3):695–702. doi: 10.1016/j.ygyno.2007.02.004. [DOI] [PubMed] [Google Scholar]
- 12.Singh AP, Senapati S, Ponnusamy MP, et al. Clinical potential of mucins in diagnosis, prognosis, and therapy of ovarian cancer. Lancet Oncol. 2008;9(11):1076–1085. doi: 10.1016/S1470-2045(08)70277-8. [DOI] [PMC free article] [PubMed] [Google Scholar]
- 13.Zins D, Cabuil V, Massart R. New aqueous magnetic fluids. J Mol Liq. 1999;83(1–3):217–232. [Google Scholar]
- 14.Sousa MH, Tourinho FA, Depeyrot J, da Silva GJ, Lara MCFL. New electric double-layered magnetic fluids based on copper, nickel, and zinc ferrite nanostructures. J Phys Chem B. 2001;105(6):1168–1175. [Google Scholar]
- 15.Yoon TJ, Yu KN, Kim E, et al. Specific targeting, cell sorting, and bioimaging with smart magnetic silica core-shell nanomaterials. Small. 2006;2(2):209–215. doi: 10.1002/smll.200500360. [DOI] [PubMed] [Google Scholar]
- 16.Park KS, Tae J, Choi B, et al. Characterization, in vitro cytotoxicity assessment, and in vivo visualization of multimodal, RITC-labeled, silica-coated magnetic nanoparticles for labeling human cord blood-derived mesenchymal stem cells. Nanomedicine. 2010;6(2):263–276. doi: 10.1016/j.nano.2009.07.005. [DOI] [PubMed] [Google Scholar]
- 17.Gao X, Cui Y, Levenson RM, Chung LW, Nie S. In vivo cancer targeting and imaging with semiconductor quantum dots. Nat Biotechnol. 2004;22(8):969–976. doi: 10.1038/nbt994. [DOI] [PubMed] [Google Scholar]
- 18.Sun G, Berezin MY, Fan J, et al. Bright fluorescent nanoparticles for developing potential optical imaging contrast agents. Nanoscale. 2010;2(4):548–558. doi: 10.1039/b9nr00304e. [DOI] [PubMed] [Google Scholar]
- 19.Obermayr E, Castillo-Tong DC, Pils D, et al. Molecular characterization of circulating tumor cells in patients with ovarian cancer improves their prognostic significance – a study of the OVCAD consortium. Gynecol Oncol. 2013;128(1):15–21. doi: 10.1016/j.ygyno.2012.09.021. [DOI] [PubMed] [Google Scholar]
- 20.Zhong XY, Kaul S, Eichler A, Bastert G. Evaluating GA733-2 mRNA as a marker for the detection of micrometastatic breast cancer in peripheral blood and bone marrow. Arch Gynecol Obstet. 1999;263(1–2):2–6. doi: 10.1007/s004040050251. [DOI] [PubMed] [Google Scholar]
- 21.Vlad AM, Kettel JC, Alajez NM, Carlos CA, Finn OJ. MUC1 immunobiology: from discovery to clinical applications. Adv Immunol. 2004;82:249–293. doi: 10.1016/S0065-2776(04)82006-6. [DOI] [PubMed] [Google Scholar]
- 22.Chauhan SC, Singh AP, Ruiz F, et al. Aberrant expression of MUC4 in ovarian carcinoma: diagnostic significance alone and in combination with MUC1 and MUC16 (CA125) Mod Pathol. 2006;19(10):1386–1394. doi: 10.1038/modpathol.3800646. [DOI] [PubMed] [Google Scholar]
- 23.Lau SK, Weiss LM, Chu PG. Differential expression of MUC1, MUC2, and MUC5AC in carcinomas of various sites: an immunohistochemical study. Am J Clin Pathol. 2004;122(1):61–69. doi: 10.1309/9R66-73QE-C06D-86Y4. [DOI] [PubMed] [Google Scholar]
- 24.Tamura Y, Higashi M, Kitamoto S, et al. MUC4 and MUC1 expression in adenocarcinoma of the stomach correlates with vessel invasion and lymph node metastasis: an immunohistochemical study of early gastric cancer. PLoS One. 2012;7(11):e49251. doi: 10.1371/journal.pone.0049251. [DOI] [PMC free article] [PubMed] [Google Scholar]
- 25.Torres MP, Chakraborty S, Souchek J, Batra SK. Mucin-based targeted pancreatic cancer therapy. Curr Pharm Des. 2012;18(17):2472–2481. doi: 10.2174/13816128112092472. [DOI] [PMC free article] [PubMed] [Google Scholar]
- 26.Masilamani V, Al-Zhrani K, Al-Salhi M, Al-Diab A, Al-Ageily M. Cancer diagnosis by autofluorescence of blood components. J Lumin. 2004;109(3–4):143–154. [Google Scholar]
- 27.Hu Y, Fan L, Zheng J, et al. Detection of circulating tumor cells in breast cancer patients utilizing multiparameter flow cytometry and assessment of the prognosis of patients in different CTCs levels. Cytometry A. 2010;77(3):213–219. doi: 10.1002/cyto.a.20838. [DOI] [PubMed] [Google Scholar]


