

Abstract
Objective
To determine the association between bone mineral density (BMD), inflammatory markers, and alterations in fat and lean mass in untreated HIV-infected individuals.
Design
Cross-sectional analysis of antiretroviral therapy (ART)-naïve persons enrolled into a randomized clinical trial
Methods
Dual energy x-ray absorptiometry (DXA) for BMD, lean and fat mass, and a laboratory assessment were performed. Soluble biomarkers included adipocytokines (leptin, adiponectin), inflammatory markers (hsCRP, IL-6), and markers related to bone metabolism (osteoprotegerin (OPG)), receptor activator of NFκB Ligand (RANKL)). BMD at the lumbar spine, total hip, and femoral neck was expressed as a Z-score (number of standard deviations away from an age-, race-, sex-matched reference population).
Results
331 subjects had a median (Q1, Q3) age of 36 (28,45) years, were 89% male, and 44% white. The prevalence of low BMD (Z-score ≤ −2 at any of the 3 sites) was 10%. No associations were detected between Z-scores and hsCRP, IL-6, or RANKL (P≥0.1). In a linear model adjusting for age, gender, race, and total fat mass, lower lumbar spine Z-scores were associated with lower total lean mass, higher serum adiponectin, and lower OPG. Results at the total hip or femoral neck were similar.
Conclusions
Among ART-naïve HIV-infected individuals, lower BMD was associated with lower lean mass, higher adiponectin, and lower OPG, but not HIV disease variables or any of the inflammatory markers. These findings may have implications for bone metabolism in untreated HIV, in which hypoadiponectinemia and higher OPG may mitigate bone loss.
Keywords: Bone mineral density, Body composition, Human Immunodeficiency Virus, Inflammation
Osteoporotic fractures are a major source of morbidity and mortality in aging populations1. Among HIV-infected populations, the prevalence of osteoporosis is several fold higher than HIV-uninfected control populations and likely accounts for the emerging data suggesting a higher than expected risk of fragility fracture in HIV-infected patients2–6. The etiology of osteoporosis is multifactorial. While traditional risk factors, such as hypogonadism, smoking, heavy alcohol use, and certain components of antiretroviral therapy (ART) are important contributors, chronic infection with HIV and the resulting inflammation and immune activation have been hypothesized to lead to decreased bone mineral density (BMD). In pre-clinical models, both high levels of HIV-viral proteins and inflammatory cytokines, such as TNF-α and IL-6, have been associated with decreased osteoblast function and increased osteoclast formation and activity7–10, potentially leading to an uncoupling of bone formation and bone resorption and net bone loss. In untreated HIV-infected patients, a similar pattern is observed with higher markers of bone resorption and relatively lower concentrations of markers of bone formation11. However, the extent to which systemic inflammation is related to lower BMD in untreated HIV-infected persons has not been clearly established.
Other factors may also influence BMD in untreated HIV-infected individuals. In the general population, lower lean body mass and lower fat mass have been independently associated with lower BMD 12;13. In HIV-infected populations, lower body mass index is a major contributor to the increased prevalence of osteoporosis 14. In addition, as in the general population15, relative higher levels of abdominal visceral fat have also been associated with lower BMD in HIV-infected populations16;17, although this has not been investigated to date in ART-naïve, HIV-infected patients. Part of the effect of adipose tissue on bone may be mediated through the adipose derived hormones, adiponectin and leptin, which may be altered in HIV-infected populations and have been associated with BMD independently of fat mass in the general population18.
Other biomarkers may also be associated with abnormal bone metabolism in untreated HIV-infected persons. Osteoprotegerin (OPG) and receptor activator of NFκB Ligand (RANKL) are osteoblast-secreted factors which have a major role in the coupling of bone formation and resorption. Secreted RANKL binds to RANK on the cell surface of osteoclast precursors, leading to osteoclast activation and bone resorption. As a control mechanism, OPG is also secreted by osteoblast precursors to bind to RANKL, thereby preventing the interaction of RANK and RANKL and slowing bone resorption19. Although these proteins act locally in the bone microenvironment, circulating concentrations of these markers and their ratio have been associated with osteoporosis in the general population 19. Interestingly, both of these cytokines are produced by activated immune cells20;21 and decrease with ART-initiation 11.
To date most studies evaluating factors associated with BMD in HIV-infected populations have focused on patients receiving ART. In the current report, we assessed the prevalence of low BMD among ART-naïve patients and determined the associations between soluble markers of inflammation, body composition, adipocytokines, and OPG/RANKL and site-specific BMD.
Methods
This was a cross-sectional, baseline evaluation of ART-naïve, HIV-infected individuals who enrolled in a randomized ART treatment trial AIDS Clinical Trials Group Study (ACTG) A5257 and agreed to undergo testing for subclinical cardiovascular disease (CVD), BMD, body composition, and specialized serum biomarkers as part of a cardiovascular/metabolic substudy ACTG A5260s. The parent study and substudy (clinicalTrials. gov Identifier NCT00851799) were approved by the Institutional Review Boards of all participating institutions and all subjects provided written informed consent. Study entry criteria included: 1) 18 years of age or older, 2) documented HIV-1 infection, 3) ART-naïve (defined as ≤10 days of ART at any time prior to entry), and 4) screening HIV-1 ribonucleic acid (RNA) ≥1000 copies/mL within 90 days prior to study entry. Because the primary endpoint of A5260s was subclinical CVD, the major exclusion criteria were known CVD, diabetes mellitus, uncontrolled thyroid disease, or use of lipid-lowering medications.
For all subjects, information regarding demographics, health-related behaviors, medical conditions and prescribed medications were obtained. Physical activity was assessed using the International Physical Activity Questionnaire (IPAQ) –Short Form and activity was stratified into low, medium, and high activity based on IPAQ definitions22. BMD was assessed by dual energy x-ray absorptiometry (DXA) at the lumbar spine, total hip, and femoral neck using Hologic or Lunar scanners. All scans were read centrally using a standardized protocol at the Body Composition Analysis Center, Tufts University (Boston, MA, USA). Z-scores were calculated from the site-specific BMD measures using normative data matched for age, gender and race. The Z-score is the number of standard deviations a participant’s BMD falls from the mean BMD of a gender-, age-, and race-matched population. Low BMD was defined as Z-score ≤ −2 at any of the three sites. Given the relatively young age of the population, Z- scores were used as the primary outcome measurement in accordance with National Osteoporosis Foundation guidelines 23. Single slice abdominal quantitative computed tomography (CT) at the L4–L5 level was used to assess visceral adipose tissue (VAT) and scans were read centrally at the Los Angeles Biomed (Harbor-UCLA, Torrance, CA). Total body fat, limb fat, and lean mass were measured by whole body DXA and analyzed centrally (Tufts University, Boston, MA, USA).
Laboratory Assessment
Fasting (at least 8 hours) blood samples were obtained by phlebotomists and sent to core laboratories for analysis. Inflammatory biomarkers and adipocytokines were measured on plasma stored at −70 degrees at the University of Vermont Laboratory for Clinical Biochemistry Research lab (Burlington, VT, USA), and included high-sensitivity C-reactive protein (hsCRP) by nephelometry (Inter-Assay CV range 2.96–6.24%) and interleukin-6, total adiponectin, leptin, OPG, and RANKL by enzyme-linked immunosorbent assay (Inter-Assay CV range 5.26–12.45%).
Statistical Analysis
Continuous variables are described as medians (1st-3rd quartile, Q1–Q3); categorical variables are presented as percentages. The prevalence of low BMD in our sample was compared to the expected prevalence of low BMD in a simulated reference population including 100,000 variants from a standard (zero mean and variance of one) trivariate normal distribution with correlation as observed in the study sample (Figure 1). Univariate associations between demographic variables, HIV-related measures, body composition measurements, biomarkers and BMD Z-scores (continuous) at the lumbar spine, total hip, and femoral neck were assessed by non-parametric k-sample tests and tests of non-zero Spearman correlation. Associations that were nominally significant (p<0.05) were included in adjusted analyses. Adjusted analyses used multivariable linear regression modeling with candidate variable selection based on the Akaiki Information Criterion. Final model selection was done manually with clinical input and consideration of collinearity and final model R2. Parameters estimates (95% confidence intervals) represent average difference in BMD Z-scores per unit changes or population subgroups as described. All models included age, sex, and race. In order to determine the associations between body composition compartments and BMD Z-scores, body mass index was replaced in the models with total lean mass and total fat mass.
Figure 1.

Distribution of Z-scores at Hip, Femoral Neck, and Lumbar Spine in ART-naïve persons compared to the expected distribution of Z-scores. Pair-wise Correlation of Z-scores at the 3 BMD sites.
Because strong associations between lean body mass and BMD Z-score in the above analyses, a post-hoc, exploratory, multivariable regression analysis was conducted to determine whether lean body mass was associated with inflammatory (hsCRP and IL-6) and HIV disease related variables (HIV-1 RNA level, CD4, and known HIV duration). To a model which included age, race, and sex, each of the above covariates was added to evaluate their association with total lean body mass.
Results
Subject Characteristics (Table 1)
Table 1.
Subject Characteristics (n=331)
| Parameter | Median (Q1, Q3) or Percent |
|---|---|
| Age (years) | 36 (28, 45) |
| Sex | 89% Male, 11% Female |
| Race/ethnicitya | 44% White, 32% Black, 20% Hispanic |
| Smoking statusa | 38% Current, 40% Never |
| Alcohol Use (≥ 3/drinks per day)a | 29% |
| Current Proton Pump Inhibitor Use | 6% |
| Physical Activitya | 23% Low, 60% Moderate, 18% High |
| HIV-1 RNA (log10 copies/mL) | 4.5 (4.0, 5.1) |
| CD4+ cell count (/mm3) | 349 (207, 455) |
| Time since HIV diagnosis (months) | 5.7 (2.4 - 31.5) |
| Prior AIDS | 23% |
| Nadir CD4 cell count (/mm3) | 311 (195, 417) |
| Hepatitis C | 7% |
| Body Composition | |
| Body-mass index (kg/m2) | 25 (22, 28) |
| Visceral Adipose Tissue (cm2) | 73 (39, 107) |
| Total body fat mass (kg) | 17 (11, 24) |
| Total body lean mass (kg) | 56 (50, 63) |
| Biomarkers | |
| C-reactive protein(mg/L) | 1.4 (0.7, 3.0) |
| Interleukin-6 (pg/mL) | 1.8 (1.2, 3.0) |
| Adiponectin (ng/mL) | 7780 (5355, 11540) |
| Leptin (pg/mL) | 5288 (3017, 9558) |
| OPG (pmol/L) | 4.2 (3.3, 5.1) |
| RANKL (pg/mL) | 34 (16, 57) |
| Bone Parameters | |
| Lumbar Spine T-score | −0.5 (−1.2, 0.3) |
| Lumbar Spine Z-score | −0.4 (−1.2, 0.4) |
| Lumbar Spine Z-score ≤ −2 N (%)a | 29 (9%) |
| Total Hip T-score | −0.3 (−0.8, 0.4) |
| Total Hip Z-score | −0.1 (−0.6, 0.6) |
| Total Hip Z-score ≤ −2.0 a | 4 (1%) |
| Femoral Neck T-score | −0.5 (−1.1, 0.2) |
| Femoral Neck Z-score | −0.1 (−0.7, 0.5) |
| Femoral Neck Z-score ≤ −2 a | 7 (2%) |
Percentages are calculated for participants with data; 1 participant is missing race/ethnicity, 1 participant is missing smoking history; 28 participants are missing alcohol use; 14 participants are missing physical activity; 9 participants are missing hip and femoral neck BMD Z scores; and 7 participants are missing lumbar spine BMD Z scores.
Of the 331 participants, 89% were male, 44% were non-Hispanic white, 32% were black, and 20% were of Hispanic race/ethnicity. Twenty-three percent had a prior clinical AIDS diagnosis. The median (Q1, Q3) HIV-1 RNA level was 4.5 (4.0, 5.1) log10copies/mL and CD4 cell counts were 349 (207, 455)/mm3. There were 38% current smokers and 20% former smokers; 29% reported alcohol intake ≥ 3 drinks/day and 6% reported current proton pump inhibitor use. The median BMI was 25 (22, 28) kg/m2. None of the subjects had a history of osteoporosis treatment.
Bone Mineral Density
The median of total hip Z-score of was −0.1 (−0.6, 0.6); of femoral neck Z-score was −0.1(−0.7, 0.5) and the lumbar spine Z-score was −0.4 (−1.2, 0.4). These three endpoints were correlated with each other (r≥0.59, p<0.001). In particular, the estimated correlation (Spearman) between hip and femoral neck Z-score was 0.89 (Figure 1). The prevalence of low BMD at the lumbar spine, total hip, and femoral neck were 9%, 1%, and 2%, respectively. With low BMD defined as Z-score ≤ −2.0 at any of the 3 sites, the observed prevalence of 10% (33 of 331) [95% CI: 6.7%–13.2%] was higher than expected under the standard trivariate normal assumption (16 cases expected, P<0.001).
Univariate Associations with BMD Z-scores
In univariate analyses (Table 2), CD4 cell count, HIV-1 RNA levels, hsCRP, or IL-6, were not associated with BMD Z-score at any site. Associations with smoking, heavy alcohol use, physical activity, hepatitis C, or current proton pump inhibitor use were also not detected (data not shown). All body composition parameters (limb fat, VAT, total body lean mass, total body fat mass) were associated with higher BMD Z-scores at all sites. Lower adiponectin and higher leptin concentrations were associated with higher Z-score BMD. Higher OPG was associated with higher BMD Z-scores, but no association was observed with RANKL or the OPG/RANKL (data not shown). Of the covariates with statistically significant associations with BMD Z-score, the magnitude of these associations was relatively small.
Table 2.
Univariate Relationships Demographic Variables, Body Composition Data, and Biomarker Concentrations and Bone Mineral Density Z-scores at the Lumbar Spine, Total Hip, and Femoral Neck
| Covariates | Lumbar Spine Z | Total Hip Z | Femoral Neck Z | |||
|---|---|---|---|---|---|---|
| rho | P | rho | P | rho | P | |
| CD4+ cell count (/mm3) | −0.02 | 0.68 | −0.02 | 0.66 | −0.02 | 0.67 |
| HIV-1 RNA (log10 copies/ml) | 0.02 | 0.77 | 0.04 | 0.50 | 0.02 | 0.66 |
| Time since 1st HIV+ diagnosis (months) | 0.11 | 0.049 | 0.05 | 0.36 | 0.09 | 0.13 |
| VAT (cm2) | 0.14 | 0.014 | 0.18 | 0.001 | 0.14 | 0.010 |
| Total body lean (kg) | 0.24 | <0.001 | 0.31 | <0.001 | 0.28 | <0.001 |
| Total body fat (kg) | 0.26 | <0.001 | 0.26 | <0.001 | 0.27 | <0.001 |
| CRP (log10 ug/ml) | 0 | 0.96 | 0.02 | 0.69 | 0.02 | 0.68 |
| IL-6 (log10 pg/ml) | 0.01 | 0.84 | 0.05 | 0.38 | 0.06 | 0.28 |
| Adiponectin (log10 ng/ml) | −0.12 | 0.037 | −0.18 | 0.001 | −0.19 | <0.001 |
| Leptin (log10 pg/ml) | 0.17 | 0.002 | 0.22 | <0.001 | 0.21 | <0.001 |
| OPG (log10 pmol/L) | 0.2 | <0.001 | 0.14 | 0.011 | 0.15 | 0.006 |
| RANKL (log10 pg/ml) | 0.04 | 0.52 | 0.04 | 0.48 | 0.05 | 0.40 |
Multivariable Associations with BMD Z-scores (Figure 2)
Figure 2.

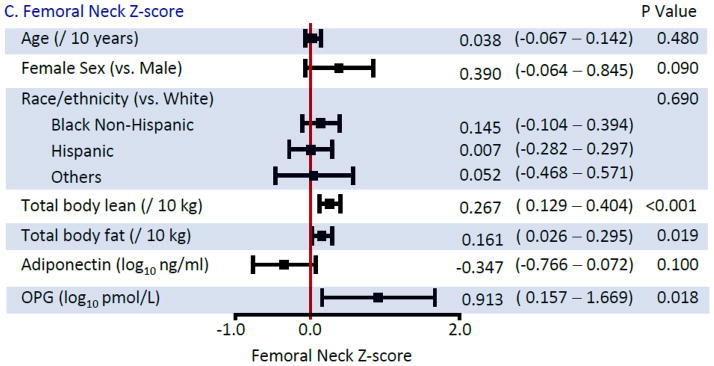
Multivariable Linear Regression Models for Bone Mineral Density Z-scores
In multivariable analyses, females had higher BMD than males, compared to their respective reference populations. Lean body mass was more strongly associated with BMD Z-score, than total fat mass. For the latter, although associations of similar magnitude were estimated across all sites, only the association at the femoral neck achieved formal statistical significance (P=0.13 for lumbar; P=0.08 for hip; P=0.019 for femoral neck). The association of VAT with BMD Z-score at any of the 3 sites was no longer statistically significant after adjustment for total fat mass (data not shown, all p>0.15).
After adjustment for fat mass, an inverse association of adiponectin with BMD Z-score was still detected although the magnitude of the effect size was reduced. In contrast, associations with leptin were no longer statistically significant in multivariable analysis (p=0.17 at the lumbar spine; p=0.51 at the total hip; p=0.30 at the femoral neck). Higher levels of OPG were associated with higher BMD Z-score at all sites, whereas the associations with RANKL or the OPG/RANKL ratio (data not shown) were not detected.
Exploratory Analysis Investigating the Associations between Lean Body Mass and Inflammatory and HIV Disease-Related Variables
Because of the consistent association between lean body mass and BMD Z-score at all 3 sites and lack of association between inflammatory and HIV disease-related variables and BMD Z-score, associations between lean body mass and hsCRP, IL-6, HIV-1 RNA level, or CD4 cell count were examined. In separate multivariable linear regression models which included age, race, and sex, residual associations lean body mass with IL-6 (p=0.006), CD4 cell count (p=0.03), and HIV-1 RNA level (p=0.002) and were observed, but association with hsCRP (p=0.24) was not apparent.
Discussion
In this cohort of ART-naïve HIV-infected persons ready to start HIV therapy, we found a higher than expected prevalence of low BMD, particularly at the lumbar spine. Lower BMD was related to lower lean body mass and two soluble biomarkers, adiponectin and OPG, which have been associated with BMD and fracture in the general population. However, associations between BMD and HIV disease parameters, such as HIV-1 RNA or CD4 cell count, or the inflammatory markers, hsCRP or IL-6 were not detected. However, some of these HIV disease parameters and IL-6 were associated with lower lean mass. Our findings provide insight into the balance of bone metabolism in the setting of untreated HIV infection.
Our finding regarding the higher than expected prevalence of low BMD in a population of ART-naïve HIV-infected patients was also observed in ACTG 5224s, in which 31% of subjects prior to ART-initiation had osteopenia (median age 38 years)24. It has been speculated that systemic inflammation and immune activation associated with untreated HIV is an important contributor to low BMD among HIV-infected patients, as in other inflammatory conditions, such as rheumatoid arthritis or inflammatory bowel disease29;30. In the absence of longitudinal data in untreated HIV-infected persons, however, it is impossible to determine the extent to which chronic untreated HIV contributes to bone loss. Low BMD in ART-naïve populations could also have pre-dated HIV-infection, as was suggested in studies examining high risk, HIV-uninfected men in the CDC pre-exposure prophylaxis (PrEP) trial and men with primary HIV infection29;30. In the PreP trial, for example, the prevalence of low BMD (Z-score ≤ −2) was almost identical to our study25. Taken together, these findings may suggest that the impact of untreated HIV-infection on BMD may be less than anticipated.
Consistent with the hypothesis that untreated HIV infection does not have a markedly negative effect on BMD, we did not detect any association between low BMD and inflammatory markers (hsCRP and IL-6) or HIV disease related variables (CD4 cell count or HIV-RNA). This is somewhat surprising in that IL-6, for example, has been shown to increase osteoclast activity in pre-clinical models 21 and in epidemiologic studies in post-menopausal women, higher concentrations of IL-6 have been associated with BMD loss26;27. However, these results extend the findings of other studies which similarly have shown no relation between inflammatory markers and BMD or bone turnover in untreated HIV-infected patients11;28. One limitation of the current analysis was that we measured only two inflammatory markers. In future studies, other soluble and cellular inflammatory markers should be examined for their relationship with BMD in untreated HIV-infected patients.
We also investigated the relative contribution of lean and fat mass to BMD in this population and found strongest association with lean mass, which is an independent predictor of fracture in the general population29. Possible explanations include mechanical effects of muscle contraction of bone mass and strength, secreted factors that may allow metabolic communication between muscle and bone, and genetic, hormonal, and behavioral factors that may affect both muscle and bone. In general, HIV-infected populations have lower BMI and lean mass than HIV-uninfected control populations38;30. One possible explanation for differences in lean mass by HIV serostatus is the effect of chronic HIV-infection on muscle metabolism. Inflammatory cytokines, such as TNF-alpha and IL-6 have direct effects on muscle breakdown and these markers have been associated with sarcopenia in the general elderly population31;32. Indeed, in our exploratory analysis, higher IL-6 was associated with lower lean body mass independent of age, sex, and race in these HIV-infected, ART-naïve individuals, although the direction of this association cannot be determined in this cross-sectional study. Longitudinal studies are required to understand the contributors to lower lean mass in HIV-infected populations, including chronic inflammation, and the relationship between lean mass and bone mineral density and fracture.
Total fat mass also was associated with femoral neck BMD even after adjustment for lean mass, with similar trends at the other sites. In the general population, there is conflicting data in the general population regarding the relative effect of fat mass on BMD12;13. It is hypothesized that increased adipose tissue contributes to the mechanical effect on bone mass. In addition, adipose tissue may secrete hormonal factors which affect bone metabolism. We investigated whether two fat-derived hormones, adiponectin and leptin, were associated with BMD in untreated HIV-infected persons. In the general population, lower adiponectin and higher leptin have been associated with increased BMD, although the associations appear to be stronger for adiponectin compared to leptin and are independent of fat-mass18. Similarly, we found that both adiponectin and leptin were associated with BMD in the expected directions in univariate analyses, but after adjustment for fat mass and the other covariates, only adiponectin showed independent associations, with a statistically significant association at the total hip and a similar trend at the other sites.
Adiponectin is a protein secreted by adipocytes in high concentration and adiponectin receptors have also been found in osteoblasts and osteoclasts33. Activation of these receptors is thought lead to increased bone turnover. Perhaps thorough this mechanism, higher concentrations of adiponectin have been associated with lower BMD18 and have been associated with an increased risk of fracture, even independent of BMD, in some34;35, but not all studies36. Among HIV-infected populations, relative hypoadiponectinemia has been described 37. We speculate that lower circulating levels of adiponectin may also serve to protect BMD in HIV-infected populations.
Other secreted factors may influence the balance of bone formation and resorption in our population, including osteoprotegerin and RANKL. In some epidemiologic studies in the general population, however, higher levels of OPG have been associated with lower BMD, which is thought to be a compensatory mechanism for abnormal bone metabolism38;39, but these findings have not been consistent40.
We found that higher concentrations of OPG were associated with increased BMD at all three sites. In addition to osteoblasts, other cell types including activated T-cells and B-cells produce OPG41. In a small previous study of OPG and other markers of inflammation and bone turnover in various disease states, the median OPG concentration in under-treated HIV-infected persons was 50% greater than the concentration observed in age- and sex-matched healthy controls, and was related to TNF-α levels, but not to bone turnover markers42. These findings suggest that OPG, which is a member of the TNF superfamily, is upregulated in untreated HIV-infection. Indeed, the mean OPG concentration among men in our study, adjusted for age, race, and BMI, was 31% higher than the adjusted mean OPG concentration in 141 HIV-uninfected men participating in the Multicenter AIDS Cohort Study cardiovascular substudy, which used an identical assay from the same laboratory (Wendy Post, personal communication). We speculate that higher concentrations of OPG, derived from activated immune cells in the untreated HIV-infected persons may help protect from increased bone resorption, as initially proposed by Seminari43.
Osteoporosis and fracture risk in HIV-infected persons results from a complicated interaction between HIV-disease related factors, antiretroviral therapy, and traditional risk factors for bone loss found in high prevalence in HIV-infected persons. In order to begin to disentangle these multiple etiologies, it is useful to examine an untreated HIV-infected population for factors that may affect bone metabolism. To our knowledge, this is the largest study of BMD in ART-naïve persons with concomitant measures of body composition, adipocytokines, and OPG/RANKL.
Our study had several limitations. Similar to other ART-naïve treatment studies with specialized procedures24, our study comprised mostly men. Further studies should focus on the bone health in HIV-infected women given the high burden of osteoporosis in women with aging. Second, we did not measure parathyroid hormone, 25 hydroxyvitamin D, free testosterone, bone turnover markers, or other markers of immune activation, systemic inflammation, or immune senescence as this was the baseline analysis of a clinical trial. We plan to examine these factors in further analyses. Next, the prevalence of some traditional osteoporosis risk factors was low in our population, such as hepatitis C and proton pump inhibitor use, limiting our ability to detect associations with BMD. Finally, our study was cross-sectional in nature and it is impossible to determine causality. Longitudinal studies in ART-naive persons will be critical to establish temporality.
In conclusion, we found a high prevalence of low BMD in this ART-naïve cohort, which was strikingly similar to men with primary HIV-infection or at risk men starting PrEP. Our findings suggest a delicate balance of factors affecting bone formation and bone resorption in untreated HIV-infected persons. While lower lean body mass, perhaps impacted by systemic inflammation, was associated with lower BMD, lower adiponectin and higher OPG appeared to have protective effects. In ongoing follow-up with this cohort, we will be able to carefully monitor whether the factors that we found to be associated with BMD at baseline predict changes in BMD with initiation, since the first 48–96 weeks after ART initiation are consistently associated with BMD losses and compromised bone health.
Acknowledgments
Financial Support: This research was supported by NIH grants HL095132, HL095126, AI 068636, AI068634, AI69471, and AI56933. Study drug and additional support were provided by Gilead, BMS, Jansen and Merck.
Footnotes
Conflicts of Interest
Dr Brown has served as a consultant for BMS, GSK, Merck, Abbott, Gilead, ViiV Healthcare and has received research funding from Merck and GSK. Dr. Currier has served as a consultant for Gilead and has received research funding from Merck. Dr. Murphy has served as a consultant for Gilead and serves on a Data Safety Monitoring Board for Gilead. Dr Stein serves on a Data Safety Monitoring Board for Abbott, Lilly, and Takeda. Dr McComsey has served as a consultant or received research grants from BMS, Pfizer, and GSK. Dr Ribaudo and Ms Chen and Rothenberg have no Duality of Interest disclosures.
Reference List
- 1.Burge R, Dawson-Hughes B, Solomon DH, Wong JB, King A, Tosteson A. Incidence and economic burden of osteoporosis-related fractures in the United States, 2005–2025. J Bone Miner Res. 2007;22:465–75. doi: 10.1359/jbmr.061113. [DOI] [PubMed] [Google Scholar]
- 2.Brown TT, Qaqish RB. Antiretroviral therapy and the prevalence of osteopenia and osteoporosis: a meta-analytic review. AIDS. 2006;20:2165–74. doi: 10.1097/QAD.0b013e32801022eb. [DOI] [PubMed] [Google Scholar]
- 3.Triant VA, Brown TT, Lee H, Grinspoon SK. Fracture prevalence among human immunodeficiency virus (HIV)-infected versus non-HIV-infected patients in a large U.S. healthcare system. J Clin Endocrinol Metab. 2008;93:3499–504. doi: 10.1210/jc.2008-0828. [DOI] [PMC free article] [PubMed] [Google Scholar]
- 4.Young B, Dao CN, Buchacz K, Baker R, Brooks JT. Increased rates of bone fracture among HIV-infected persons in the HIV Outpatient Study (HOPS) compared with the US general population, 2000–2006. Clin Infect Dis. 2011;52:1061–68. doi: 10.1093/cid/ciq242. [DOI] [PubMed] [Google Scholar]
- 5.Hansen AB, Gerstoft J, Kronborg G, Larsen CS, Pedersen C, Pedersen G, Obel N. Incidence of low and high-energy fractures in persons with and without HIV infection: a Danish population-based cohort study. AIDS. 2012;26:285–93. doi: 10.1097/QAD.0b013e32834ed8a7. [DOI] [PubMed] [Google Scholar]
- 6.Womack JA, Goulet JL, Gibert C, Brandt C, Chang CC, Gulanski B, Fraenkel L, Mattocks K, Rimland D, Rodriguez-Barradas MC, Tate J, Yin MT, Justice AC. Increased Risk of Fragility Fractures among HIV Infected Compared to Uninfected Male Veterans. PLoS ONE. 2011;6:e17217. doi: 10.1371/journal.pone.0017217. [DOI] [PMC free article] [PubMed] [Google Scholar]
- 7.Axmann R, Bohm C, Kronke G, Zwerina J, Smolen J, Schett G. Inhibition of interleukin-6 receptor directly blocks osteoclast formation in vitro and in vivo. Arthritis Rheum. 2009;60:2747–56. doi: 10.1002/art.24781. [DOI] [PubMed] [Google Scholar]
- 8.Vikulina T, Fan X, Yamaguchi M, Roser-Page S, Zayzafoon M, Guidot DM, Ofotokun I, Weitzmann MN. Alterations in the immuno-skeletal interface drive bone destruction in HIV-1 transgenic rats. Proc Natl Acad Sci U S A. 2010;107:13848–53. doi: 10.1073/pnas.1003020107. [DOI] [PMC free article] [PubMed] [Google Scholar]
- 9.Gibellini D, De CE, Ponti C, Cimatti L, Borderi M, Tschon M, Giardino R, Re MC. HIV-1 triggers apoptosis in primary osteoblasts and HOBIT cells through TNFalpha activation. J Med Virol. 2008;80:1507–14. doi: 10.1002/jmv.21266. [DOI] [PubMed] [Google Scholar]
- 10.Gibellini D, De CE, Ponti C, Borderi M, Clo A, Miserocchi A, Viale P, Re MC. HIV-1 Tat protein enhances RANKL/M-CSF-mediated osteoclast differentiation. Biochem Biophys Res Commun. 2010;401:429–34. doi: 10.1016/j.bbrc.2010.09.071. [DOI] [PubMed] [Google Scholar]
- 11.Brown TT, Ross AC, Storer N, Labbato D, McComsey GA. Bone turnover, osteoprotegerin/RANKL and inflammation with antiretroviral initiation: tenofovir versus non-tenofovir regimens. Antivir Ther. 2011;16:1063–72. doi: 10.3851/IMP1874. [DOI] [PMC free article] [PubMed] [Google Scholar]
- 12.Douchi T, Kuwahata R, Matsuo T, Uto H, Oki T, Nagata Y. Relative contribution of lean and fat mass component to bone mineral density in males. J Bone Miner Metab. 2003;21:17–21. doi: 10.1007/s007740300003. [DOI] [PubMed] [Google Scholar]
- 13.Reid IR, Plank LD, Evans MC. Fat mass is an important determinant of whole body bone density in premenopausal women but not in men. J Clin Endocrinol Metab. 1992;75:779–82. doi: 10.1210/jcem.75.3.1517366. [DOI] [PubMed] [Google Scholar]
- 14.Bolland MJ, Grey AB, Gamble GD, Reid IR. CLINICAL Review #: low body weight mediates the relationship between HIV infection and low bone mineral density: a meta-analysis. J Clin Endocrinol Metab. 2007;92:4522–28. doi: 10.1210/jc.2007-1660. [DOI] [PubMed] [Google Scholar]
- 15.Gilsanz V, Chalfant J, Mo AO, Lee DC, Dorey FJ, Mittelman SD. Reciprocal relations of subcutaneous and visceral fat to bone structure and strength. J Clin Endocrinol Metab. 2009;94:3387–93. doi: 10.1210/jc.2008-2422. [DOI] [PMC free article] [PubMed] [Google Scholar]
- 16.Huang JS, Rietschel P, Hadigan CM, Rosenthal DI, Grinspoon S. Increased abdominal visceral fat is associated with reduced bone density in HIV-infected men with lipodystrophy. AIDS. 2001;15:975–82. doi: 10.1097/00002030-200105250-00005. [DOI] [PubMed] [Google Scholar]
- 17.Brown TT, Ruppe MD, Kassner R, Kumar P, Kehoe T, Dobs AS, Timpone J. Reduced bone mineral density in human immunodeficiency virus-infected patients and its association with increased central adiposity and postload hyperglycemia. J Clin Endocrinol Metab. 2004;89:1200–1206. doi: 10.1210/jc.2003-031506. [DOI] [PubMed] [Google Scholar]
- 18.Biver E, Salliot C, Combescure C, Gossec L, Hardouin P, Legroux-Gerot I, Cortet B. Influence of adipokines and ghrelin on bone mineral density and fracture risk: a systematic review and meta-analysis. J Clin Endocrinol Metab. 2011;96:2703–13. doi: 10.1210/jc.2011-0047. [DOI] [PubMed] [Google Scholar]
- 19.Vega D, Maalouf NM, Sakhaee K. CLINICAL Review #: the role of receptor activator of nuclear factor-kappaB (RANK)/RANK ligand/osteoprotegerin: clinical implications. J Clin Endocrinol Metab. 2007;92:4514–21. doi: 10.1210/jc.2007-0646. [DOI] [PubMed] [Google Scholar]
- 20.Chakravarti A, Marceau AA, Flamand L, Poubelle PE. Normal human primary CD4+ T lymphocytes synthesize and release functional osteoprotegerin in vitro. Lab Invest. 2008;88:171–84. doi: 10.1038/labinvest.3700701. [DOI] [PubMed] [Google Scholar]
- 21.Kwan TS, Padrines M, Theoleyre S, Heymann D, Fortun Y. IL-6, RANKL, TNF-alpha/IL-1: interrelations in bone resorption pathophysiology. Cytokine Growth Factor Rev. 2004;15:49–60. doi: 10.1016/j.cytogfr.2003.10.005. [DOI] [PubMed] [Google Scholar]
- 22.Craig CL, Marshall AL, Sjostrom M, Bauman AE, Booth ML, Ainsworth BE, Pratt M, Ekelund U, Yngve A, Sallis JF, Oja P. International physical activity questionnaire: 12-country reliability and validity. Med Sci Sports Exerc. 2003;35:1381–95. doi: 10.1249/01.MSS.0000078924.61453.FB. [DOI] [PubMed] [Google Scholar]
- 23.National Osteoporosis Foundation. Clinician’s Guide to Prevention and Treatment of Osteoporosis. Ref Type: Generic. [Google Scholar]
- 24.McComsey G, Kitch D, Daar E, Tierney C, Jahed N, Tebas P, Myers L, Melbourne K, Ha B, Sax P. Bone mineral density and fractures in antiretroviral-naïve subjects randomized to abacavir/lamivudine or tenofovir disoproxil fumarate/emtricitabine along with efavirenz or atazanavir/ritonavir: AIDS Clinical Trials Group A5224s, a substudy of ACTG A5202. J Infect Dis. 2011 doi: 10.1093/infdis/jir188. in press. [DOI] [PMC free article] [PubMed] [Google Scholar]
- 25.Liu AY, Vittinghoff E, Sellmeyer DE, Irvin R, Mulligan K, Mayer K, Thompson M, Grant R, Pathak S, O’Hara B, Gvetadze R, Chillag K, Grohskopf L, Buchbinder SP. Bone mineral density in HIV-negative men participating in a tenofovir pre-exposure prophylaxis randomized clinical trial in San Francisco. PLoS ONE. 2011;6:e23688. doi: 10.1371/journal.pone.0023688. [DOI] [PMC free article] [PubMed] [Google Scholar]
- 26.Ding C, Parameswaran V, Udayan R, Burgess J, Jones G. Circulating levels of inflammatory markers predict change in bone mineral density and resorption in older adults: a longitudinal study. J Clin Endocrinol Metab. 2008;93:1952–58. doi: 10.1210/jc.2007-2325. [DOI] [PubMed] [Google Scholar]
- 27.Scheidt-Nave C, Bismar H, Leidig-Bruckner G, Woitge H, Seibel MJ, Ziegler R, Pfeilschifter J. Serum interleukin 6 is a major predictor of bone loss in women specific to the first decade past menopause. J Clin Endocrinol Metab. 2001;86:2032–42. doi: 10.1210/jcem.86.5.7445. [DOI] [PubMed] [Google Scholar]
- 28.Brown TT, McComsey GA, King MS, Qaqish RB, Bernstein BM, da Silva BA. Loss of Bone Mineral Density After Antiretroviral Therapy Initiation, Independent of Antiretroviral Regimen. J Acquir Immune Defic Syndr. 2009;51:554–61. doi: 10.1097/QAI.0b013e3181adce44. [DOI] [PubMed] [Google Scholar]
- 29.Ensrud KE, Lipschutz RC, Cauley JA, Seeley D, Nevitt MC, Scott J, Orwoll ES, Genant HK, Cummings SR. Body size and hip fracture risk in older women: a prospective study. Study of Osteoporotic Fractures Research Group. Am J Med. 1997;103:274–80. doi: 10.1016/s0002-9343(97)00025-9. [DOI] [PubMed] [Google Scholar]
- 30.Yarasheski KE, Scherzer R, Kotler DP, Dobs AS, Tien PC, Lewis CE, Kronmal RA, Heymsfield SB, Bacchetti P, Grunfeld C. Age-related skeletal muscle decline is similar in HIV-infected and uninfected individuals. J Gerontol A Biol Sci Med Sci. 2011;66:332–40. doi: 10.1093/gerona/glq228. [DOI] [PMC free article] [PubMed] [Google Scholar]
- 31.Schaap LA, Pluijm SM, Deeg DJ, Harris TB, Kritchevsky SB, Newman AB, Colbert LH, Pahor M, Rubin SM, Tylavsky FA, Visser M. Higher inflammatory marker levels in older persons: associations with 5-year change in muscle mass and muscle strength. J Gerontol A Biol Sci Med Sci. 2009;64:1183–89. doi: 10.1093/gerona/glp097. [DOI] [PMC free article] [PubMed] [Google Scholar]
- 32.Hsu FC, Kritchevsky SB, Liu Y, Kanaya A, Newman AB, Perry SE, Visser M, Pahor M, Harris TB, Nicklas BJ. Association between inflammatory components and physical function in the health, aging, and body composition study: a principal component analysis approach. J Gerontol A Biol Sci Med Sci. 2009;64:581–89. doi: 10.1093/gerona/glp005. [DOI] [PMC free article] [PubMed] [Google Scholar]
- 33.Shinoda Y, Yamaguchi M, Ogata N, Akune T, Kubota N, Yamauchi T, Terauchi Y, Kadowaki T, Takeuchi Y, Fukumoto S, Ikeda T, Hoshi K, Chung UI, Nakamura K, Kawaguchi H. Regulation of bone formation by adiponectin through autocrine/paracrine and endocrine pathways. J Cell Biochem. 2006;99:196–208. doi: 10.1002/jcb.20890. [DOI] [PubMed] [Google Scholar]
- 34.Barbour KE, Zmuda JM, Boudreau R, Strotmeyer ES, Horwitz MJ, Evans RW, Kanaya AM, Harris TB, Bauer DC, Cauley JA. Adipokines and the risk of fracture in older adults. J Bone Miner Res. 2011;26:1568–76. doi: 10.1002/jbmr.361. [DOI] [PMC free article] [PubMed] [Google Scholar]
- 35.Johansson H, Oden A, Lerner UH, Jutberger H, Lorentzon M, Barrett-Connor E, Karlsson MK, Ljunggren O, Smith U, McCloskey E, Kanis JA, Ohlsson C, Mellstrom D. High serum adiponectin predicts incident fractures in elderly men: Osteoporotic fractures in men (MrOS) Sweden. J Bone Miner Res. 2012;27:1390–1396. doi: 10.1002/jbmr.1591. [DOI] [PubMed] [Google Scholar]
- 36.Michaelsson K, Lind L, Frystyk J, Flyvbjerg A, Gedeborg R, Berne C, Zethelius B, Mallmin H, Soderberg S, Melhus H. Serum adiponectin in elderly men does not correlate with fracture risk. J Clin Endocrinol Metab. 2008;93:4041–47. doi: 10.1210/jc.2008-0617. [DOI] [PubMed] [Google Scholar]
- 37.Kosmiski LA, Bacchetti P, Kotler DP, Heymsfield SB, Lewis CE, Shlipak MG, Scherzer R, Grunfeld C. Relationship of fat distribution with adipokines in human immunodeficiency virus infection. J Clin Endocrinol Metab. 2008;93:216–24. doi: 10.1210/jc.2007-1155. [DOI] [PMC free article] [PubMed] [Google Scholar]
- 38.Jorgensen HL, Kusk P, Madsen B, Fenger M, Lauritzen JB. Serum osteoprotegerin (OPG) and the A163G polymorphism in the OPG promoter region are related to peripheral measures of bone mass and fracture odds ratios. J Bone Miner Metab. 2004;22:132–38. doi: 10.1007/s00774-003-0461-3. [DOI] [PubMed] [Google Scholar]
- 39.Grigorie D, Neacsu E, Marinescu M, Popa O. Circulating osteoprotegerin and leptin levels in postmenopausal women with and without osteoporosis. Rom J Intern Med. 2003;41:409–15. [PubMed] [Google Scholar]
- 40.Trouvin AP, Goeb V. Receptor activator of nuclear factor-kappaB ligand and osteoprotegerin: maintaining the balance to prevent bone loss. Clin Interv Aging. 2010;5:345–54. doi: 10.2147/CIA.S10153. [DOI] [PMC free article] [PubMed] [Google Scholar]
- 41.Kearns AE, Khosla S, Kostenuik PJ. Receptor activator of nuclear factor kappaB ligand and osteoprotegerin regulation of bone remodeling in health and disease. Endocr Rev. 2008;29:155–92. doi: 10.1210/er.2007-0014. [DOI] [PMC free article] [PubMed] [Google Scholar]
- 42.Ueland T, Bollerslev J, Godang K, Muller F, Froland SS, Aukrust P. Increased serum osteoprotegerin in disorders characterized by persistent immune activation or glucocorticoid excess--possible role in bone homeostasis. Eur J Endocrinol. 2001;145:685–90. doi: 10.1530/eje.0.1450685. [DOI] [PubMed] [Google Scholar]
- 43.Seminari E, Castagna A, Soldarini A, Galli L, Fusetti G, Dorigatti F, Hasson H, Danise A, Guffanti M, Lazzarin A, Rubinacci A. Osteoprotegerin and bone turnover markers in heavily pretreated HIV-infected patients. HIV Med. 2005;6:145–50. doi: 10.1111/j.1468-1293.2005.00278.x. [DOI] [PubMed] [Google Scholar]