

Summary
Endoribonuclease footprinting is an important technique for probing RNA•protein interactions with single nucleotide resolution. The susceptibility of RNA residues to enzymatic digestion gives information about the RNA secondary structure, the location of protein binding sites, and the effects of protein binding on the RNA structure. Here we present a detailed protocol for using RNase T2, which cleaves single stranded RNA with a preference for A nucleotides, to footprint the protein Hfq on the rpoS mRNA leader. This protocol covers how to form the RNP complex, determine the correct dose of enzyme, footprint the protein, and analyze the cleavage pattern using primer extension.
Keywords: Footprinting, primer extension, RNA, RNA protein interactions, RNase T2, sequencing gel
1. Introduction
In bacteria, non-coding small RNAs (sRNAs) play a critical role in post-transcriptional gene regulation (1). These sRNAs bind target mRNAs directly to either activate or repress translation. The major class of sRNAs requires the ubiquitous and abundant RNA binding protein Hfq as a cofactor for regulation (2). In the best studied cases, such as OxyS inhibition of fhlA (3,4), Spot42 inhibition of galK (5), and DsrA activation of rpoS (6,7) it is clear that Hfq binding to both the sRNA and its mRNA target is important for correct regulation. Unlocking the mechanism behind the formation and function of these RNPs is a growing area of research.
“Footprinting” methods are important tools for probing the structures and composition of RNPs (8), including those containing sRNAs or their mRNA targets (9–11). These methods assay the ability of a specific protein or cellular extract to protect an RNA of interest from cleavage or modification by chemicals or endonucleases (12). An important advantage of footprinting methods is that they can have single nucleotide resolution, allowing for a very accurate determination of where proteins are binding and how that binding affects the RNA.
A variety of endonucleases with different cleavage specificities have been widely used to probe the structure and protein binding properties of RNAs (13). Different endonucleases have different nucleotide specificities, and probing all the residues in an RNA of interest requires using combinations of multiple enzymes. Commonly used enzymes for structure probing include RNase A, which cleaves 3' of single stranded U and C nucleotides; RNase T1, which cleaves 3' of single stranded G nucleotides; RNase T2, which cleaves 3' of all single stranded nucleotides with a preference for A nucleotides; and RNase V1, which, in contrast to the enzymes above, cleaves double-stranded RNA (13). As these enzymes are much larger than chemical footprinting reagents such as dimethylsulfate or hydroxyl radical, their cleavage pattern is less affected by dynamic “breathing” of the RNA structure.
Here we describe nuclease footprinting of the Hfq protein on the rpoS mRNA leader, which is a regulatory target of the sRNA DsrA (14,15). RNase T2 was chosen for this example because Hfq has a preference for single stranded A and U rich RNA, and the putative Hfq binding site in the rpoS leader is an (AAN)4 repeat element (6). However, the protocol can be easily adapted for other ribonucleases.
For RNAs around 100 bp or less, it is common to footprint 5'-end labeled RNAs and resolve the cleavage products directly with a polyacrylamide sequencing gel. An example of this approach is the use of RNase T1 and RNase T2 to footprint the sRNA DsrA (87 nt) and a short (140 nt) section of the rpoS mRNA leader (10). Because of the length of the rpoS RNA we used in the following protocol (324 nt), we analyzed the RNase T2 cleavage pattern by extension of a 32P-labeled primer to generate cDNAs that were then resolved on a sequencing gel (Figure 1). The methods we present for 5'-end labeling, determining the RNase T2 dose response and footprinting of the Hfq•rpoS RNP complex work whether the cleaved RNA is resolved directly or used as a template for primer extension.
Figure 1. Protocol for RNase footprinting analyzed by primer extension.
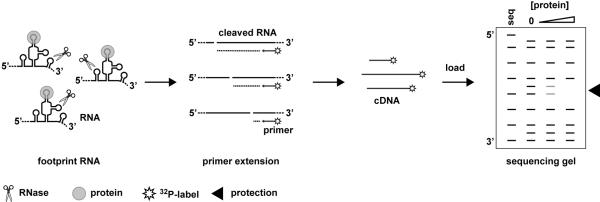
The accessible single stranded regions of assembled RNPs are exposed to RNase under single-cleavage conditions. cDNAs are generated by primer extension of the RNase treated RNA using 32P-labeled primers. The cDNAs are resolved on a polyacrylamide sequencing gel and regions of protection from RNase cleavage are identified
The primer extension protocol we present here uses 32P-labeled primers and resolves the cDNAs with a traditional polyacrylamide sequencing gel. However, by using fluorescent dye labeled primers, the cDNAs may be analyzed with a DNA sequencer (16,17). The DNA sequencer provides longer reads (≥400 bp) and more automated quantitation of footprinting products.
Correct dosing is vital for RNase footprinting experiments. Useful data requires that each RNA that is cleaved by RNase be cleaved no more than once, but that there are sufficient cleavage events for robust detection. These conditions are met when 80–85% of the RNA remains undigested (18). Therefore the first step in an endoribonuclease footprinting experiment is establishing the dose-response for the particular RNA and RNase being used.
Here we describe methods to label primers and use primer extension to generate cDNA for analysis on sequencing gels, how to generate a dose response curve to determine the optimal concentration of RNase T2, and how to footprint a protein on an RNA with RNase T2.
2. Materials
2.1. RNP footprinting components
5X Tris sodium potassium (TNK) RNA folding buffer: 50 mM Tris•HCl pH 7.5, 250 mM NaCl, 250 mM KCl
Protein storage buffer: 50 mM Tris•HCl pH 7.5, 250 mM NH4Cl, 1 mM EDTA, 10% glycerol (v/v)
Tris EDTA (TE) buffer: 10 mM Tris•HCl pH 7.5, 1 mM EDTA
50 μM Hfq6 protein in storage buffer (see Note 1)
1.25 μM in vitro transcribed rpoS RNA in TE (see Note 2)
RNase T2 (Bocca Scientific) (see Note 3)
0.05 mg/mL yeast carrier tRNA (Sigma).
2.2. Primer labeling components
10X Polynucleotide kinase buffer: 700 mM Tris•HCl pH 7.5, 100 mM MgCl2, 50 mM DTT (see Note 4)
3.3 μM gel purified custom DNA primer (see Note 5)
γ 32P-ATP (Perkin Elmer)
T4 Polynucleotide kinase (NEB)
2.3. Primer extension components
Superscript III first strand buffer (provided with enzyme)
0.1 mM DDT (provided with enzyme)
10 mM dNTPs
2.5 mM ddNTPs
200 nM 32P-labeled primer
1.25 μM rpoS RNA for sequencing
RNase T2 treated rpoS RNA samples
Superscript III reverse transcriptase (Invitrogen)
2.4. Polyacrylamide sequencing gel components
10X Tris borate EDTA (TBE) buffer: 1 M Tris, 830 mM boric acid, 10 mM EDTA
40% 29:1 acrylamide:bisacrylamide solution (see Note 6)
Urea pellets
45cm × 35cm glass plate, 43cm × 35cm offset glass plate, 0.2mm spacers, comb (Fisher Scientific)
Medium binder clips (see Note 7)
10% APS
TEMED
2X Formamide/TBE dye: 9.50 mL deionized formamide, 400 μL 10X TBE, 50 μL 2% bromophenol blue (BP) dye, 50 μL 2% xylene cyanol (XC) dye (see Note 8).
3. Methods
All reactions should use RNase-free deionized water purified to 18 MΩ of resistivity.
3.1. Primer labeling
Mix 3 μL of 3.3 μM gel-purified primer, 1 μL 10X PNK buffer, and 5 μL γ 32P-ATP in a 1.5 mL microcentrifuge tube. Vortex and spin. (see Note 9)
Add 1 μL (10 U) T4 polynucleotide kinase (NEB). Mix by gentle tapping and spin.
Incubate 30 minutes at 37ºC.
Incubate reaction for 10 minutes at 65ºC to inactivate the enzyme. Add 40 μL of H2O. Vortex and spin.
Purify with a size exclusion column such as a TE-10 column (Clontech).
Store labeled primer at −20ºC.
3.2. RNase T2 dose response
For each reaction, mix 2 μL TNK buffer, 2 μL protein storage buffer, 1 μL TE and 1 μL H20 in a 1.5 mL microcentrifuge tube.
Renature 1.25 μM rpoS transcript by heating at 80ºC for one minute followed by 5 minutes at room temperature.
Add 2 μL renatured 1.25 mM rpoS RNA to salt mix from step 1. Incubate RNA 5–10 minutes at room temperature. (see Note 10)
Create serial dilutions of RNase T2. It is best to start with a decadal series, for instance: 0.0, 0.005, 0.05, 0.5, and 5 U/μL RNase T2. Keep the RNase dilutions on ice. (see Note 11)
Add 2 μL of each RNase T2 dilution to a reaction tube from step 3. Incubate at room temperature for 1 minute.
Quench the reactions by adding 10 μL buffered phenol, and immediately vortexing vigorously (see Note 12).
For each reaction, add 189 μL H2O, 1 μL 0.05 mg/mL yeast carrier tRNA, and 190 μL phenol to bring the volume to a level suitable for extraction. Vortex vigorously and spin at 15,000 RPM for 5 minutes to separate layers (see Note 13).
For each reaction, transfer the aqueous layer to a clean 1.5 mL microcentrifuge tube and add 200 μL 24:1 chloroform:isoamyl alcohol. Vortex vigorously and spin as in step 7.
For each reaction, transfer aqueous layer to a clean 1.5 mL microcentrifuge tube and precipitate the RNA with 20 μL 3 M sodium acetate and 600 μL cold 100% ethanol, overnight at −20ºC (see Note 14).
Spin down precipitated RNA in a microcentrifuge at 15,000 RPM for 30 minutes at 4 °C. Decant the supernatant.
Wash the pellets with 500 μL cold 70% ethanol and spin again for 5 minutes. Decant the supernatant.
Dry the pellets under vacuum (e.g. SpeedVac Concentrator or equivalent), then resuspend the pellets in 10 μL H2O
Perform primer extension reactions on 2 μL from each nuclease digestion reaction, and run the cDNAs on a sequencing gel according to the protocols in sections 3.3 and 3.4.
3.3. Primer extension
Primer extension reactions should be assembled on ice.
Make a sequencing cocktail by mixing 10 μL γ 32P labeled primer from section 3.1, 5 μL 10 μM dNTP mix, 2 μL 1.25 μM rpoS RNA, and 29 μL H2O. This cocktail will go into 4 sequencing reactions and a pausing control, each containing 0.5 pmol RNA. (see Note 15)
Add 3.8 μL of each ddNTP to a separate 0.5 mL thick walled PCR tube. Add 3.8 μL of H2O to a 5th tube.
Add 9.2 μL of sequencing cocktail to each sequencing tube and the pausing control. Vortex and spin.
Make a reaction cocktail by mixing 2 μL γ 32P labeled primer, 1.5 μL 10 mM dNTP mix and 7.5 μL H2O for each sample to be reverse transcribed.
Add 2 μL of experimentally treated RNA from either section 3.2 or 3.6 to a 0.5 mL thick walled PCR tube.
Add 11 μL of reaction cocktail to each tube. Mix by vortexing and spin.
Anneal the sequencing and experimental reactions from steps 3 and 6 by incubating at 65ºC for 5 minutes and then returning to ice.
Make a reverse transcription (RT) cocktail by mixing 4 μL 5X first strand buffer (provided by supplier with the reverse transcriptase), 1 μL 0.1 M DTT, 1.75 μL H2O and 0.25 μL Superscript III reverse transcriptase for each primer extension reaction to be performed (total number of sequencing and experimental reactions).
Add 7 μL of RT cocktail to each reaction. Mix by tapping and spin.
Incubate reactions at 55ºC for 30 minutes.
Precipitate the reactions with 2 μL 3M sodium acetate and 60 μL cold 100% ethanol, overnight at −20ºC.
Spin, wash, and dry the precipitated cDNA as in steps 10–12 in section 3.2 (see Note 16).
3.4. Run sequencing gel
Make 100 mL of 8% acrylamide gel solution by mixing 48 g of urea pellets, 10 mL 10X TBE, and 20 mL 40% 29:1 acrylamide:bis-acrylamide. Bring up to 100 mL with H2O, dissolve the urea by incubating at 65ºC, then degas 10 minutes (see Note 17). (I do 10min at least.)
Add 350 μL 10% APS and 35 μL TEMED to the gel solution, mix gently, and use a 60 mL syringe to inject it between clamped sequencing gel plates separated by 0.2 mm spacers. Insert comb (see Note 18).
Mount the sequencing gel on a gel electrophoresis apparatus and add 1 L 1X TBE running buffer. Pre-run the gel at 55 watts for 30 minutes.
Resuspend the cDNA from section 3.3, step 12 in 5 μL of formamide/TBE dye. Vortex and spin.
Heat cDNA samples at 95ºC for 30 seconds then load them onto the 8% sequencing gel.
Run the gel at 55 watts until the bromophenol blue is at the bottom of the gel (about two hours).
Separate the plates and pull the gel off the plates with piece of 3 mm Whatman filter paper cut to size. Cover the gel with plastic wrap and dry it under vacuum. Expose the gel to a phosphor screen, and then scan it with a phosphorimager (see Note 19).
3.5. Dose response data analysis
After scanning the gel, use image analysis software such as ImageQuant (Molecular Dynamics) or NIH Image J (19) to quantify the intensity (pixel volume) of the full-length primer extension product (FL). Separately quantify the volume of all other bands in the lane, but excluding full-length product and the unextended primer. These bands are cDNA fragments derived from RNase T2 cleavage products (P) (Figure 2A).
For each lane, calculate the fraction full-length cDNA with the following formula:. This is taken to represent the amount of uncleaved RNA.
Divide the fraction of full-length cDNA for each RNase T2 concentration by the fraction of full-length cDNA in the zero T2 lane to obtain the normalized fraction of full-length cDNA.
Plot the logarithm of the normalized fraction full-length against RNase T2 concentration (a semi-log plot; Figure 2B). Fitting the data with an exponential decay function will give a straight line. Use the line to determine the nuclease concentration that gives ~80% full-length (uncleaved) RNA. For example, in Figure 1B, this would correspond to 3 U/μL RNase T2. Use this concentration in future experiments.
Figure 2. RNase T2 footprinting of Hfq•rpoS complex.

A) Representative sequencing gel showing the RNase T2 dose response for the rpoS mRNA leader. An RNA-only pausing control (P) is followed by ddNTP generated sequencing lanes (A,G,C, and U). The next seven lanes are folded rpoS RNA reacted for one minute with increasing concentration (U/μL) of RNase T2. The positions of cDNAs generated from the full-length or cleaved RNAs, as well as the primer, are indicated. B) Semi-log plot of the dose response, calculated by dividing the counts in the full-length band by the total counts in the cleaved bands, omitting the primer. Full-length percentages are normalized to the zero RNase T2 lane. The data are fit with an exponential decay function. The RNase concentration that gives ~80% full-length (dashed line) is used in future experiments. C) Footprinting Hfq on the rpoS leader. Folded rpoS RNA is incubated with increasing concentrations of Hfq hexamer for 5–10 minutes then reacted with 3 U/μL RNase T2 for one minute. Boxed bands indicate representative nucleotides that are protected (filled triangles) or deprotected (empty triangles) with increasing Hfq6.
3.6. Footprinting Hfq protein on the rpoS mRNA
Make an Hfq hexamer dilution series consisting of: 50, 25, 15, 5, and 0.5 μM Hfq6 in Hfq storage buffer. Add 2 μL of each dilution or 2 μL buffer (no Hfq control) to a separate 1.5 ml microcentrifuge tube. The final reaction volume will be 10 μL, so that the final Hfq hexamer concentrations will be: 10, 5, 3, 1, 0.1 and 0 μM Hfq6. Keep protein stocks and dilutions on ice.
Assemble a cocktail of rpoS RNA as in section 3.2 steps 1–3, omitting the Hfq buffer.
Add 6 μL RNA cocktail to each protein dilution and incubate for 5–10 minutes at room temperature.
Add 2 μL 3 U/μL RNase T2 (as determined by the dose response experiment) to each reaction tube and incubate for 1 minute at room temperature.
Quench the RNase with phenol and extract the reactions with phenol and chloroform as in section 3.2 steps 6–10.
Reverse transcribe 2 μL each digestion reaction and run the cDNA on a sequencing gel according to the protocols in sections 3.3 and 3.4.
Scan the gel and analyze to find changes in cleavage levels as a function of Hfq. Bands whose intensity decreases as [Hfq6] increases are considered to be protected, for example the bands marked with filled triangles in Figure 2C. Protections can be due either direct Hfq binding or to structural changes in rpoS RNA as a result of Hfq binding. Hfq binding can also increase cleavage in some bands, for example those marked with empty triangles in Figure 2C. These enhancements are due to structural changes in rpoS. To quantify changes in band intensity, use ImageQuant or Image J as in section 3.5, or use the program Semi-Automated Footprinting Analysis (SAFA) (20).
4. Notes
Hfq hexamers used in these experiments were purified by passing lysate containing untagged protein over a Co2+ column (21,22).
RNAs were transcribed with T7 RNA polymerase from plasmid or PCR DNA templates containing T7 promoter sequences according to the protocol found in (6) and purified by denaturing gel electrophoresis according to (23).
RNase T2 has optimal activity at pH 4.5 (13). However, it is active and stable at physiological pH (13). The experiments detailed here were conducted at pH 7.5 and the RNase T2 was diluted into the pH 7.5 TNK buffer.
To keep the DTT fresh, remake this buffer often and avoid large numbers of freeze/thaw cycles.
We find it most cost effective to gel purify primers in the lab. We run 1–5 nmol of primer on a 10% acrylamide preparative gel, visualize the band by UV shadowing, cut it out of the gel, and elute the primer by rocking in TEN (10 mM Tris•HCl pH 7.5, 1 mM EDTA, 250 mM NaCL) 16–24 hours at 4º C. The eluted primer is removed from the gel slice and precipitated.
To prepare this solution, mix 116 g of acrylamide powder (Research Organics), 4 g bis-acrylamide powder (Research organics) and bring the volume up to 300 mL with RNase-free water. Acrylamide is a neurotoxin, so wear a mask, gloves and a lab coat when working with powdered acrylamide, and take care to avoid spilling or dispersing the powder.
These are sold by most office supply stores.
Deionizing the formamide in the loading dye improves the quality of band resolution in the sequencing gel. To deionize formamide, add 1–2 g of AG501-X8 Resin (Bio-Rad) to 10 mL formamide and shake 4–16 hours at 4ºC.
To label a smaller RNA for direct readout of RNase cleavage, use 40 pmol of in vitro transcribed RNA, dephosphorylated with Calf Intestinal Phosphatase (NEB).
Two μL of 1.25 μM RNA is 2.5 pmol of RNA. The protocol presented here uses 0.5 pmol of RNA per primer extension reaction, so that one cleavage reaction will contain enough material for 5 primer extensions. Primer extension reactions should use 0.25–1.0 pmol of RNA. In the case of a smaller RNA that doesn't require primer extension to read out the cleavages, use 1 μL of 32P-labeled RNA, with the concentration depending on binding properties of the protein of interest but containing at least 105 cpm/μL.
More accurate dose information will be obtained by repeating the dose response as well as using the initial results to refine the range of RNase T2 concentrations tested.
If a labeled RNA is being cleaved and analyzed directly without primer extension, quench the reaction with 2 μL of 10 mM aurin tricarboxcylic acid (ATA; Sigma), add an equal volume of formamide/TBE dye, load the RNA directly on to the gel, and proceed from step 17 of section 3.3. Do not use ATA if proceeding to primer extension because the ATA will quench the reverse transcriptase and is hard to remove from the reaction.
Adding carrier tRNA increases the amount of total RNA in the reaction, improving the precipitation efficiency.
For a faster precipitation step, use 30 minutes at −80ºC.
When directly analyzing labeled RNA, sequencing is generated by nuclease digestion of denatured RNA.
Pellets can be stored 1–2 days at −20ºC. Once they are resuspended in loading buffer, proceed directly to the sequencing gel.
The gel solution must be cooled to room temperature or below or else polymerization will be too fast to cast a usable gel. In our experience, degassing for 10 minutes cools the solution sufficiently.
To prevent leaking gel solution, tape the bottom and sides of the plates before clamping them with binder clips. The comb should also be clamped to ensure proper well formation.
A thin spatula works well for separating the plates. Remove the spacers then insert the spatula blade from the bottom and slowly apply leverage. After covering the gel with plastic wrap it is usually necessary to trim away excess filter paper and plastic. Depending on the number of counts loaded and the sensitivity of the phosphorimager, gels can be exposed from 3–24 hours. It is useful to save the gel after scanning in case rescanning is required.
Acknowledgement
We would like to acknowledge Richard Lease, Subrata Panja and Sarah Soper for providing reagents, technical advice, and useful discussions.
References
- 1.Gottesman S, Storz G. Bacterial Small RNA Regulators: Versatile Roles and Rapidly Evolving Variations. Cold Spring Harb Perspect Biol. 2010 doi: 10.1101/cshperspect.a003798. [DOI] [PMC free article] [PubMed] [Google Scholar]
- 2.Valentin-Hansen P, Eriksen M, Udesen C. The bacterial Sm-like protein Hfq: a key player in RNA transactions. Mol Microbiol. 2004;51:1525–1533. doi: 10.1111/j.1365-2958.2003.03935.x. [DOI] [PubMed] [Google Scholar]
- 3.Zhang A, Wassarman KM, Ortega J, Steven AC, Storz G. The Sm-like Hfq protein increases OxyS RNA interaction with target mRNAs. Mol Cell. 2002;9:11–22. doi: 10.1016/s1097-2765(01)00437-3. [DOI] [PubMed] [Google Scholar]
- 4.Salim NN, Feig AL. An upstream Hfq binding site in the fhlA mRNA leader region facilitates the OxyS-fhlA interaction. PLoS One. 2010;5 doi: 10.1371/journal.pone.0013028. [DOI] [PMC free article] [PubMed] [Google Scholar]
- 5.Moller T, Franch T, Hojrup P, Keene DR, Bachinger HP, Brennan RG, Valentin-Hansen P. Hfq: a bacterial Sm-like protein that mediates RNA-RNA interaction. Mol Cell. 2002;9:23–30. doi: 10.1016/s1097-2765(01)00436-1. [DOI] [PubMed] [Google Scholar]
- 6.Soper TJ, Woodson SA. The rpoS mRNA leader recruits Hfq to facilitate annealing with DsrA sRNA. RNA. 2008;14:1907–1917. doi: 10.1261/rna.1110608. [DOI] [PMC free article] [PubMed] [Google Scholar]
- 7.Soper TJ, Doxzen K, Woodson SA. Major role for mRNA binding and restructuring in sRNA recruitment by Hfq. RNA. 2011;17:1544–1550. doi: 10.1261/rna.2767211. [DOI] [PMC free article] [PubMed] [Google Scholar]
- 8.Ruskin B, Green MR. Specific and stable intron-factor interactions are established early during in vitro pre-mRNA splicing. Cell. 1985;43:131–142. doi: 10.1016/0092-8674(85)90018-2. [DOI] [PubMed] [Google Scholar]
- 9.Brescia CC, Mikulecky PJ, Feig AL, Sledjeski DD. Identification of the Hfq-binding site on DsrA RNA: Hfq binds without altering DsrA secondary structure. RNA. 2003;9:33–43. doi: 10.1261/rna.2570803. [DOI] [PMC free article] [PubMed] [Google Scholar]
- 10.Lease RA, Woodson SA. Cycling of the Sm-like protein Hfq on the DsrA small regulatory RNA. J Mol Biol. 2004;344:1211–1223. doi: 10.1016/j.jmb.2004.10.006. [DOI] [PubMed] [Google Scholar]
- 11.Geissmann TA, Touati D. Hfq, a new chaperoning role: binding to messenger RNA determines access for small RNA regulator. EMBO J. 2004;23:396–405. doi: 10.1038/sj.emboj.7600058. [DOI] [PMC free article] [PubMed] [Google Scholar]
- 12.Parker KA, Steitz JA. Determination of RNA-protein and RNA-ribonucleoprotein interactions by nuclease probing. Methods Enzymol. 1989;180:454–468. doi: 10.1016/0076-6879(89)80117-x. [DOI] [PubMed] [Google Scholar]
- 13.Ehresmann C, Baudin F, Mougel M, Romby P, Ebel JP, Ehresmann B. Probing the structure of RNAs in solution. Nucleic Acids Res. 1987;15:9109–9128. doi: 10.1093/nar/15.22.9109. [DOI] [PMC free article] [PubMed] [Google Scholar]
- 14.Lease RA, Cusick ME, Belfort M. Riboregulation in Escherichia coli: DsrA RNA acts by RNA:RNA interactions at multiple loci. Proc Natl Acad Sci U S A. 1998;95:12456–12461. doi: 10.1073/pnas.95.21.12456. [DOI] [PMC free article] [PubMed] [Google Scholar]
- 15.Majdalani N, Cunning C, Sledjeski D, Elliott T, Gottesman S. DsrA RNA regulates translation of RpoS message by an anti-antisense mechanism, independent of its action as an antisilencer of transcription. Proc Natl Acad Sci U S A. 1998;95:12462–12467. doi: 10.1073/pnas.95.21.12462. [DOI] [PMC free article] [PubMed] [Google Scholar]
- 16.Mitra S, Shcherbakova IV, Altman RB, Brenowitz M, Laederach A. High-throughput single-nucleotide structural mapping by capillary automated footprinting analysis. Nucleic Acids Res. 2008;36:e63. doi: 10.1093/nar/gkn267. [DOI] [PMC free article] [PubMed] [Google Scholar]
- 17.Vasa SM, Guex N, Wilkinson KA, Weeks KM, Giddings MC. ShapeFinder: a software system for high-throughput quantitative analysis of nucleic acid reactivity information resolved by capillary electrophoresis. RNA. 2008;14:1979–1990. doi: 10.1261/rna.1166808. [DOI] [PMC free article] [PubMed] [Google Scholar]
- 18.Brenowitz M, Senear DF, Shea MA, Ackers GK. Quantitative DNase footprint titration: a method for studying protein-DNA interactions. Methods Enzymol. 1986;130:132–181. doi: 10.1016/0076-6879(86)30011-9. [DOI] [PubMed] [Google Scholar]
- 19.Abramoff MD, Magalhaes PJ, Ram SJ. Image Processing with ImageJ. Biophotonics International. 2004;11:36–42. [Google Scholar]
- 20.Das R, Laederach A, Pearlman SM, Herschlag D, Altman RB. SAFA: semi-automated footprinting analysis software for high-throughput quantification of nucleic acid footprinting experiments. RNA. 2005;11:344–354. doi: 10.1261/rna.7214405. [DOI] [PMC free article] [PubMed] [Google Scholar]
- 21.Soper T, Mandin P, Majdalani N, Gottesman S, Woodson SA. Positive regulation by small RNAs and the role of Hfq. Proc Natl Acad Sci U S A. 2010;107:9602–9607. doi: 10.1073/pnas.1004435107. [DOI] [PMC free article] [PubMed] [Google Scholar]
- 22.Hopkins JF, Panja S, Woodson SA. Rapid binding and release of Hfq from ternary complexes during RNA annealing. Nucleic Acids Res. 2011 doi: 10.1093/nar/gkr062. [DOI] [PMC free article] [PubMed] [Google Scholar]
- 23.Zaug AJ, Grosshans CA, Cech TR. Sequence-specific endoribonuclease activity of the Tetrahymena ribozyme: enhanced cleavage of certain oligonucleotide substrates that form mismatched ribozyme-substrate complexes. Biochemistry. 1988;27:8924–8931. doi: 10.1021/bi00425a008. [DOI] [PubMed] [Google Scholar]