

Abstract
An understanding of the relationship between functional and structural measures in primary open angle glaucoma (POAG) is necessary for both grading the severity of disease and for understanding the natural history of the condition. This article outlines the current evidence for the nature of this relationship, and highlights the current mathematical models linking structure and function. Large clinical trials demonstrate that both structural and functional change are apparent in advanced stages of disease, while, at an individual level, detectable structural abnormality may precede functional abnormality in some patients whilst the converse in true in other patients. Although the exact nature of the ‘structure-function’ relationship in POAG is still the topic of scientific debate and the subject of continuing research, this article aims to provide the clinician with an understanding of the past concepts and contemporary thinking in relation to the structure-function relationship in POAG.
Keywords: Structure, function, glaucoma
What is the ‘structure-function relationship’ in glaucoma?
Glaucoma is a family of chronic, progressive and potentially blinding optic neuropathies characterised by distinctive morphological (or ‘structural’) changes of the optic nerve head (ONH) and retinal nerve fibre layer (RNFL) associated with visual field changes. 1 Primary open angle glaucoma (POAG) is the commonest subtype. Both structural and functional changes result from loss of retinal ganglion cells (RGCs) and their axons. The degree of structural (neuroretinal rim, RNFL) and visual field loss is used to grade the likelihood and severity of POAG both in the clinical setting 2 and in large scale clinical trials 3–5. Broadly speaking, “functional change” in POAG can indicate a disturbance of any test of visual function, although often used synonymously with visual field change. Clinical measurements of structure and function, at any stage of glaucoma, exhibit a wide variability between individuals and on repeated measurements, so the true extent of damage is often difficult to ascertain. Consequently, clinicians use measurements in one domain (structure or function) to support the interpretation of measurements in the other domain. The relationship between structure and function measurements is, therefore, of considerable importance.
Given that both structural and functional parameters decline with progressive glaucoma 4, 6 and that both arise from a common pathophysiological process, namely death of RGCs with loss of related axons 7, 8, it would be expected that both structural and functional measurements in glaucoma should be related over the course of the disease. However, the exact nature of the ‘structure-function’ relationship in POAG is still the topic of scientific debate and the subject of continuing research.
Importance of the structure function relationship
An understanding of the structure-function relationship in POAG is necessary for both grading the severity of disease and for understanding the natural history of the condition. In the clinical setting, patients with apparently the same degree of neuroretinal rim loss can have different amounts of visual field loss. Further, some patients have evidence of glaucomatous optic neuropathy without a detectable visual field abnormality whilst others have a glaucomatous visual field without detectable structural abnormality. For the clinician, this poses a diagnostic dilemma regarding the likelihood of disease and as to whether the severity of POAG should be primarily gauged on the basis of structure or function or a combination of both.
The natural history of POAG is one of progressive neuroretinal rim loss, visual field loss 6 and in a subset of patients, blindness. 9 The relationship between ganglion cell loss and visual field loss for a given stage of disease is still inadequately understood. It is likely that a better understanding of the rates of structural and functional changes in relation to the underlying neuronal counts will develop as improvements in vivo imaging techniques in human eyes lead to a better understanding of the disease processes.
Measuring structure and function
Clinical measurements of structure and function are attempts to quantify the integrity of the anatomical pathway subserving vision, in particular the neural elements damaged in glaucoma, namely the RGCs and their axons. Many factors may confound the measurement of these neural elements and these are discussed below.
Visual function measures can drop to zero (no perception of light), while anatomical measures have a residual non-neural component that can be substantial even in blind eyes. Estimates of the non-neural component for a given individual, from a group mean, may be erroneous. Aside from error in estimating the neural contribution to measurements of structure and function, one needs to consider other factors that may affect the apparent relationship between the number of RGCs and visual function (as measured by perimetry). The nature of the structure-function relationship in glaucoma is influenced by the scale for measurements. 10, 11 Imaging devices in common clinical use for measuring the structure of the ONH and RNFL include confocal scanning laser ophthalmoscopy (SLO), scanning laser polarimetry (SLP) and ocular coherence tomography (OCT). These devices provide a quantification of neuroretinal rim area (in mm2) or RNFL thickness (in μm) and, more recently, of macular and “ganglion cell complex” thickness (in μm), usually in reference to normative values. Both mm2 and μm are linear metrics of measurement, and should be linearly related to local ganglion cell density.
Standard automated perimetry (SAP) typically utilises a constant size stimulus, the Goldmann size III (0.43 degrees in diameter), at all test locations. Visual field sensitivity or differential light sensitivity is recorded in logarithmic units or decibels (dB) which are related to the luminance of the stimulus relative to the background. The dB is relative to a reference level. Specifically, dBs are used to express a ratio (in reference to the maximum luminance of the perimeter) rather than an absolute quantity. As the maximum luminance differs on different perimeters, a given dB value is not interchangeable on different perimeters with different background and maximum stimulus brightness. Decibels are a non-linear measure: a change by 3 dB represents a doubling or halving of light intensity. When dB increments are plotted against a linear scale, it becomes apparent that identical dB increments at different levels of sensitivity are very different sized increments on a linear scale. Figure 1 shows the relationship between visual field sensitivity, in linear units plotted against visual field sensitivity in dB. A 2 dB decrement from 38 dB to 36 dB is ten-fold greater change in linear units than the same dB change at a sensitivity of 28 dB. The units of measurement for structural and functional parameters are confounding factors in the study of the structure-function relationship.
Figure 1. The non-linear relationship between dB units and linear (L−1) metrics of differential light sensitivity for standard automated perimetry.

A decline of 2 dB from a sensitivity of 32 dB is ten-fold greater, on a linear scale, than a decline of 2 dB from 22 dB.
There is strong evidence that perimetric sensitivity, when expressed in linear units, is linearly related to ganglion cell density in the local retinal region being tested. 10–13 That is, when ganglion cell density is halved, perimetric sensitivity in linear units is also halved. Physiological evidence comes from massed evoked potentials dominated by ganglion cell responses: the multifocal Visual Evoked Potential (mVEP) which reflects summed ganglion cell input to visual cortex, and the Pattern Electroretinogram (PERG) which reflects the summed activity of retinal ganglion cells. Hood and colleagues found that linear visual perimetric sensitivity was linearly related to the signal portion of the amplitude of the mVEP. 14 Garway-Heath and colleagues found that linear visual field measures were linearly related to the amplitude of the PERG amplitude, 10, 15 and this was confirmed independently by Yang & Swanson.15 Garway-Heath and colleagues also found that linear visual field measures were linearly related to the area of neuroretinal rim; this was confirmed independently by Shafi et al.16 Hood and colleagues found that linear visual field measures were linearly related to the neural component of RNFL thickness 17; this was confirmed independently by Leite and colleagues. 18
Psychophysical factors influencing the structure-function relationship
Spatial summation describes the relationship between stimulus area (and the number of underlying RGCs) and visual field sensitivity. Studies support the conclusion that linear perimetric sensitivity is linearly related to ganglion cell number. Consider spatial summation for circular luminance (‘brightness’) increments like the SAP stimuli: the long-established ‘Ricco’s law’ states that, when small areas of retina are stimulated, the area of retina stimulated and the visual sensitivity are linearly related (a slope of 1 on log-log axes). In healthy eyes under photopic conditions, this small area (‘Ricco’s area’) increases with distance from fixation and within 15° from fixation it is smaller than the Goldmann size III stimulus used in SAP. This has traditionally been attributed to summation within the receptive field of a retinal ganglion cell 19, but subsequent studies have indicated that Ricco’s area is determined by optical factors at fixation 20 and by cortical factors across the central visual field 21. The assumption that detection is determined by responsiveness of an individual ganglion cell would lead one to expect that perimetric sensitivity for this stimulus would be relatively unaffected by modest amounts of ganglion cell loss 22. By comparison, assessment of cortical pooling effects on spatial summation concluded that sensitivity to the size III stimulus declines with even modest amount of ganglion cell loss 21, 23, 24, and that this is seen even for the much larger stimuli used in frequency-doubling perimetry 25.
Cortical pooling of ganglion cell responses can be characterized in terms of multiple spatial mechanisms or multiple cortical detectors with peak responses at different spatial frequency 26, where Ricco’s area is determined by the spatial mechanism with the greatest sensitivity to small luminance increments 21. Perimetric sensitivity across the central visual field is relatively constant when the stimulus is scaled to Ricco’s area, consistent with spatial mechanisms varying in spatial scale with eccentricity 27. Cortical pooling provides a new understanding of the well-established result that effects of spatial summation for perimetric stimuli can be altered in patients with glaucoma 28–30. A recent study of spatial summation in early glaucoma suggested that decline in ganglion cell density reduces the sensitivity of higher-frequency cortical spatial mechanisms mediating detection in normal eyes, so that the mechanism mediating detection in a glaucomatous defect pools the same number of ganglion cells as the corresponding higher-frequency mechanism that mediates detection at that visual field location in normal eyes. 31 Cortical pooling analysis demonstrates that such a reduction in sensitivity of higher-frequency mechanisms would result in a linear decline in sensitivity with decline in ganglion cell density, a slope of 1 on log-log axes 21. For the central 15°, the slope of the relationship is no longer 1, so that a unit increase in area gives rise to less than a unit increase in sensitivity (figure 2).
Figure 2. The ‘Hockey-Stick’ model relating sensitivity and ganglion cell (GC) receptive field number (both in log units).

The datapoints from Garway-Heath et al. (2000) 12 and empirical plot of Swanson et al. (2004)38 is indicated by the black symbols and solid black line respectively. Anderson & Knighton’s (1988) function 66, with RGC receptive field number derived from acuity perimetry, is approximated by the grey solid line. The size of the stimulus in relation to the critical area may explain the change in slope at 15 degrees eccentricity. The spatial summation curve predicted by a model of cortical pooling is shown for comparison 21. See text for details.
The ‘Structure-function timeline’ and the linear structure-function model
Raed and Spaeth studied the relationship between optic disc cupping and visual field change 6. They found that many eyes had visual field damage when masked ‘expert’ evaluation of the optic disc did not expect field damage; they hypothesized from these cross-sectional data that minimal visual field change occurred when the cup-disc ratio (CDR) enlarged from 0.3 to 0.6 and that more marked visual field loss occurred when the CDR enlarged from 0.6 to 1.0. The notion of ‘preperimetric glaucoma’ was subsequently popularised in the early 1980’s by reports which demonstrated clinically detectable ONH changes in eyes without detectable visual field damage 32, 33. This clinical observation received support from the interpretation of comparisons of histological ganglion cell data with prior perimetric data from post-mortem eyes, concluding that visual field sensitivity declines after ganglion cell loss 7, 34. The concept of a ‘functional reserve’ followed, which described a functional latency period in the natural history of glaucoma where structural change occurred without functional change 22. A number of successive investigators showed that the relationship between visual field measurements (in dB) and structural measures of glaucomatous optic neuropathy (in linear units) is curvilinear 10, 35–37. That is, in early POAG, structural loss appears greater than functional loss, whilst in more advanced disease, it appears as if function changes at a greater rate than structure. Garway-Heath demonstrated that this curvilinear relationship may be a consequence of measuring visual function in logarithmic units, whilst ganglion cell measures are measured in linear units 10, 12. In addition, the structure-function relationship became more linear when sensitivity was plotted in linear units and spatial summation affects were accounted for 10. This ‘linear’ model of the ‘structure-function relationship (i.e. a linear relationship when both structure and function are recorded in linear units) has been supported by studies of the relationship between visual field sensitivity and PERG amplitude 10, 15, and the signal portion of the amplitude of the multifocal VEP 14. Swanson and colleagues developed an empirical model to simulate the neural response of ganglion and cortical cells to perimetric stimuli and found this could explain a linear relationship between depth of visual field defect relative to normal (in %) and percentage of ganglion cells damaged 38.
The Hood-Kardon model (described below) extrapolates the linear structure-function model to define the relationship between visual field sensitivity (in dB) and RNFL thickness (in μm) and accounts for a ‘non-neural’ structural component 17. In other words, in eyes blind with glaucoma, visual field sensitivity can drop to zero, whilst RNFL thickness reaches a basement effect around 44–60 μm. 39 This residual has been attributed to the presence of presence of glial supportive tissue and blood vessels within the RNFL. The Hood-Kardon model has been extended to rim area, where the non-neural residual appears to be smaller. 16
Which goes first- Structure or function?
It is often asserted that structural abnormalities precede visual field changes in the development of glaucoma. In fact, there is substantial evidence to suggest that abnormalities of the visual field can precede detectable abnormalities of the ONH or RNFL. The contemporary opinion is that detectable structural and function changes can occur concurrently in some patients, whilst either structural or functional change is apparent first in others.40 Many clinicians will be familiar with the statement ‘at least 25% to 35% RGC loss is associated with abnormalities in visual field testing’, a conclusion arising largely from interpretation of the work of Quigley and colleagues 7, 41. In fact, Quigley’s articles on this topic are amongst the most frequently cited articles in the literature in Ophthalmology 42. However, their data do not fully support the aforementioned conclusion. In their 1989 study, Quigley et al established normal ranges for RGC density at each visual field test location from only 5 eyes 7. When normal confidence limits for healthy eyes are considered, all but four datapoints had RGC density below normal confidence limits for healthy eyes and also had perimetric defects. Consider figure 3, which has been adapted from a later publication by the same group 41. This shows the relationship between mean deviation, MD (dB) and percentage retinal ganglion cell count. Using the regression line on this plot, a patient with an RGC count equal to an ‘average healthy eye’ (RGC count of 100%) would be expected to have an MD of −6 dB (solid grey lines, figure 3). On inspecting the data, it is apparent that many eyes with normal RGC counts had abnormal MD on automated perimetry. Three eyes had RGC counts greater than 100% with MD worse than −5 dB (dark grey shaded box), as if some healthy eyes had perimetric abnormalities. Indeed, when they grouped test locations by probability score for perimetric defect, the locations with p < 5% on perimetry had ganglion cell counts averaging 97% of mean normal. In other words, many of the locations with perimetric sensitivity below the normal range must have had ganglion cell counts above the mean normal value. Even for locations with more severe perimetric damage (p < 0.5%), the average value for ganglion cell number was 71% of mean normal, well within normal limits based on the means and SDs given in their Figure 1. Overall, most locations had ganglion cell numbers in the normal range yet still had statistically significant perimetric defects.
Figure 3. Adapted from Kerrigan-Baumrind et al. (2000) 41.
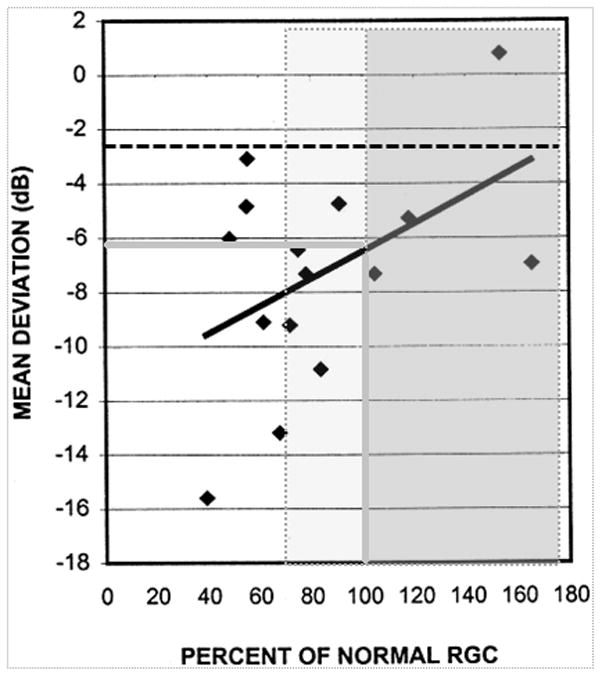
A percentage retinal ganglion cell (RGC) count of 100% (i.e. mean normal) corresponds to a Mean Deviation, MD, value of nearly −6 dB (solid grey lines). The grey shaded box shows points which correspond to a percentage RGC of 100% or greater (Three of these eyes have a MD of less than −5 dB). The lighter grey shaded box shows additional points which lie have a RGC count of greater than 67% and correspond to points which are statistically within confidence limits for normality (at p=5%, one tailed). The black dotted line corresponds to the MD value corresponding to a (one-tailed) p=5% for their data.
Similarly, Harwerth’s histological data from monkey eyes show that perimetric defects can be present in early glaucoma and a sensitivity loss of greater than 5 dB can be present for minimal amounts of ganglion cell loss 8. Histological studies, albeit in monkey eyes, allow a more precise quantification of ganglion cell number than use of an imaging surrogate, and permit quantification of ‘ganglion cell loss’ from fellow non-glaucomatous eyes of the same animal. Consequently, correlations between sensitivity and ganglion cell density are typically higher than correlations reported between sensitivity and structural surrogates of ganglion cell density made in clinical studies. Harwerth’s study has often been incorrectly cited as supporting the idea that structure precedes function.43–48.
Data from large clinical trials illustrate that perimetric damage can precede ONH changes in 35% to 86% of patients, figure 4. In the Ocular Hypertension Treatment Study (OHTS), a visual field endpoint was reached first in 35% of patients (structural change in 55%) 3, 49 whilst this figure was 60% and 86% for the European Glaucoma Prevention Study (EPGS) and Early Manifest Glaucoma Trial (EMGT) respectively 5, 50.
Figure 4. Percentage of patients who had the first detectable glaucomatous change on structural or functional testing or both tests in 3 major Clinical Trials;

OHTS = Ocular Hypertension Treatment Study; EMGT = Early Manifest Glaucoma Trial; EGPS = European Glaucoma Prevention Study
Identification of the relative frequency of structural and functional change within a study cohort depends on the reference standard used to assess this change and the relative specificity and sensitivity (true negative and true positive rates) of the criteria to define that change has taken place. A good illustration of the importance of an appropriate reference standard and of identifying criterion specificity is given by two papers published back-to-back in a journal in 2006 51, 52. The first study aimed to establish the sensitivity of imaging devices to identify glaucoma and, appropriately, used visual function as the reference standard for classification of eyes as glaucomatous or healthy 53. The second study aimed to establish the sensitivity of various vision function tests to identify glaucoma and, appropriately, used a structural definition of glaucoma as the reference standard. Both studies presented the sensitivity of the tests under consideration for a specificity of 80% (false flagging of glaucoma in 20% of healthy subjects). The studies found that the imaging devices had a sensitivity to identify early glaucoma of about 70 to 75% and the vision function tests had a sensitivity of about 50 to 65%. Thus, in the first study, 25 to 30% of subjects with glaucomatous visual field loss had no detectable structural defect with the criterion applied and, in the second study, 35 to 50% of subjects with glaucomatous optic neuropathy had no detectable vision function loss. Thus, the evidence points to either structural or functional loss being the first detectable sign of glaucoma in different subjects.
Similarly, Strouthidis et al evaluated data from 198 patients with ocular hypertension followed prospectively over seven years with serial SLO (HRT, Heidelberg Retina Tomograph, Heidelberg Engineering) and SAP. With test specificity fixed at 90%, approximately 20% of patients were identified progressing on HRT alone and a similar proportion progressing on visual field alone, whilst 12% deteriorated with both tests. When test specificity was increased to 97%, the corresponding percentages fell to 9, 15 and 4% 54. This indicates that when criteria for change are matched for similar levels of specificity, the proportions of patients with early disease progressing by structure and function are similar. A corresponding result was obtained in a study of progression in patients with manifest glaucoma55.
The concept of ‘ganglion cell dysfunction’ (rather than death) may explain why, in some patients, perimetric defects precede identifiable structural changes. In early stages of ganglion cell insult, cells may become dysfunctional leading to a reduction in visual field sensitivity, so that ‘measured structure’ may not be representative of functioning ganglion cell or axonal number. Measured functional deficit can exceed functional impairment predicted from structural measurement alone 56. Harwerth’s lab translated clinical visual field and RNFL thickness data to a common neuronal count and found that although the two were in general agreement, neuronal deficits predicted from function were often greater than those predicted from structure.
Further evidence for ganglion cell dysfunction arises from studies of electrophysiology. Investigations of the PERG show that the reduction in RGC signal is greater than predicted from RNFL thickness measurements alone 57 and that a reversible reduction of PERG amplitude can be induced by elevating intraocular pressure 58. Psychophysical evidence of RGC dysfunction is consistent with shrinkage of dendritic fields 59.
The Structure-Function Relationship – Current concepts
At present, there are four quantitative models relating structure (or ganglion cell number) and function in glaucoma:
1. The Hood-Kardon Model
The Hood-Kardon model adopts the linear structure-function relationship, but predicts RNFL thickness (μm) from dB visual field measurements 17. There are several underlying assumptions of this model, made explicit by the authors. Firstly, that RNFL thickness is related to linear visual field sensitivity in a linear manner with a slope of 1 (i.e., curvilinear relationship between visual field sensitivity in dB). This would seem to be a valid assumption for the peripheral visual field, based on the evidence outlined previously, but may not be accurate for the central visual field. Secondly, RNFL thickness is independent of sensitivity at normal levels of visual field sensitivity; in other words, there is no structure-function relationship in healthy eyes. There is limited evidence in the literature concerning this assumption at present. Thirdly, the ‘non-neural’ component of RNFL thickness can be approximated as a third of mean normal RNFL thickness in all eyes. This may be an oversimplification and, although there is a paucity of data regarding RNFL thickness in eyes severely damaged by glaucoma, Sihota et al. showed that RNFL thickness in 17 eyes blind with glaucoma varied from about 35 μm to 55 μm 39. Despite the potential limitations of the model, clinical data fit the model well 17,60.
2. The Harwerth Model
Harwerth’s observations were based on comparisons of perimetric data with histological data in monkey eyes, and found a linear relationship with visual field sensitivity and ganglion cell number when both are plotted in decibels, with the slope of the relationship increasing with eccentricity 61, 62. Harwerth’s model has been validated against human histological data 63, with fair agreement between measured SAP sensitivity and sensitivity predicted from RGC counts, and extended for clinical application to describe the relationship between visual field sensitivity and RNFL thickness from OCT 56, 62.
3. The Drasdo model
Drasdo et al 64 developed an improved map of normal ganglion cell density within the central visual field, using histological data on lateral displacement of RGC bodies from foveal cones. Subsequently, Drasdo et al65 used this map to develop a model relating ganglion cell receptive field densities to perimetric sensitivities. This model has linear contrast sensitivity linearly related to ganglion cell densities for perimetric values of 0 to 29 dB, then becoming nonlinear at higher sensitivities. In the macula, this nonlinearity means that substantial declines in ganglion cell density will cause only moderate perimetric losses for this model.
4. The ‘Hockey-Stick’ model
Anderson and Knighton found that the relationship between sensitivity and ganglion cell receptive field density (measured from grating acuity) was linear with a slope of 1 at greater eccentricities and with a slope of 0.16 in the macula.66 Similarly, Swanson and colleagues replotted empirical data from Garway-Heath et al. on visual field sensitivity against log ganglion cell number 12, using normal estimates of sensitivity 67 and histological ganglion cell counts 68, and showed that a two-line or ‘hockey stick’ fit gives a reasonable fit to the the data; Pan & Swanson produced a model which approximated the hockey-stick but avoids a sharp break in slope, see figure 2. This plot bears a striking resemblance to spatial summation curves which predict a shallower slope for test locations nearer fixation and a steeper slope peripherally 28, 31, 69. The change in slope can be explained by the size of the (Goldmann size III) test stimulus in relation to the critical area (Ricco’s area). The critical area is the largest stimulus size for which a one to one relationship holds for this relationship. For stimulus areas larger than critical area, sensitivity changes less with stimulus size and the 1:1 relationship no longer holds. Although probability summation of neural detectors 70 is the most widely accepted explanation for the shallower slope between sensitivity stimulus size in the macula, an alternative explanation, in terms of detection of the stimulus by multiple cortical spatial filters has also been provided 21.
The Hockey-Stick model, Drasdo’s model and Harwerth’s model all predict a shallower structure-function slope (with both structure and function in log units) within the macula and an increase in slope with retinal eccentricity. Harwerth’s data show a wide variation in sensitivity (typically spanning more than 10 dB) for a given ganglion cell density (dB), standard errors around the mean slopes are not given 61.
The ‘structure-function dissociation’
Data from large clinical trials shows that in some patients structural changes may precede functional changes whilst in others the converse is true. In fact, both change together only in a small percentage of patients 5, 49, 50. At first glance, this would seem surprising given that structure and function are related by the models described. However, this is in fact what would be predicted for equal loss with expected sources of variability: normal between-subject variability, measurement imprecision, different measurement (dynamic) ranges and different statistical boundaries for defining ‘abnormality’ all contribute to this dissociation. 60
Sources of imprecision in the study of the structure-function relationship
Imaging measurements of neuroretinal rim in the ONH and of thickness of the RNFL include non-neural elements such as glial tissue and blood vessels. Nevertheless, structural parameters, such as neuroretinal rim area measured by the HRT, correlate with ganglion cell counts in animal eyes, and, therefore, provide a surrogate measure of ganglion cell loss in the glaucomatous eye. A caveat is that studies of the relationship between disc topography and optic nerve fibres have included fewer than 15 eyes 71, 72 and correlations between rim area parameters and optic nerve fibres are, at best, of the order of (Pearson’s) r=0.85, indicating that rim area itself is an imperfect marker for ganglion cell number. The morphology of the ONH varies considerably between individuals, confounding attempts to quantify RGC/axon integrity from measurements of the neuroretinal rim, and measurements may be influenced also by changes to non-neural support tissue, such as the lamina cribrosa, in the glaucomatous process.
Regarding RNFL measurements, there are uncertainties concerning the extent of the non-neural components of the RNFL and how these may change with ageing and in disease. Furthermore, axon diameter and density vary around the ONH, so that relationship between axon number and RNFL thickness likely changes around the ONH circumference. An approach which may overcome some of these difficulties is to image a structure more directly related to RGC numbers – the RGC layer in the macula. This is now possible with spectral-domain OCT and initial work associating RGC thickness parameters with visual function is showing promise 73, 74. Measurements of visual function by SAP are related to the number of RGCs underlying the stimulus 8 but RGC dysfunction and varying amounts of media opacity and intraocular stray light alter the measured visual function 75 and, therefore, the relationship between RGC numbers and retinal sensitivity measurements. Not surprisingly, data are not available relating imaging measures of structure and SAP measurements of function to ganglion cell number in human eyes.
Spatial structure/function relationship
Relating structure and function rim in patients with glaucoma requires knowledge about the anatomical correspondences of rim, or peripapillary RNFL, sector with visual field test locations. The most widely utilised structure-function map was derived by Garway-Heath, 76 although a number of other correspondence maps exist 62, 77–81. Garway-Heath et al. utilised 69 greyscale photographs of the retinal nerve fibre layer in patients with discrete and traceable RNFL bundles and/or defects 76. The spatial arrangement of RNFL defects was related to visual field test locations by overlaying the 24-2 visual field test grid on individual photographs. The topographic destination of nerve fibre layer defects from of each of the 52 locations (excluding blind spot locations) was documented in terms of degree location (Temporal disc = 0 degrees). It is important to note that this map, which has been employed by a number of subsequent studies 10, 13, 16, 82, represents an ‘average’ structure-function correspondence and it was identified in the original study that the position of the ONH relative to the fovea had an influence on the trajectory of RNFL bundles. More recently, Jansonius and colleagues developed a novel mathematical model to describe the course of retinal nerve fibre layer trajectories from nerve fibre layer tracings of 27 fundus images 80, which is in overall agreement with the map of Garway-Heath. There appears to be considerable variability around the optic nerve head entry point for a given visual field location, typically spanning 20–30 degrees. This is likely to be a major source of imprecision in the evaluation of the quantitative structure-function relationship and a likely cause of poor structure-function correlation in some eyes. It is likely that the development of more ‘individualised’ structure-function maps in the future will further improve structure function correlations.
Both visual field and structural measurements are subject to significant between-subject and test-retest variability, which are major sources of imprecision in structure-function comparisons. Ganglion cell number in normal human eyes varies by a factor of two across individuals, and both structural and perimetric indices have normal ranges that cover a substantial portion of linear scales. For instance, histological data on normal human eyes yield standard deviations at individual locations about one-third of the mean 41, so a patient starting with mean normal ganglion cell density would require more than 50% loss of ganglion cells before falling below the one-tailed 95% confidence limit for normal.
Test-retest variability inflates measures of between-subject variability, and in damaged eyes may limit ability to assess progression. For perimetry with size III, test-retest variability of perimetric sensitivity in damaged areas of the visual field can span the entire dynamic range of the perimeter 83–85. For perimetry with sinusoidal stimuli there is no such increase in test-retest variability for damaged regions of the visual field.55, 86 Sources of variability in structural measurements are many and include poor image quality, lens opacity and cylindrical error, poor acuity, low analysis confidence in OCT images, atypical scan pattern in SLP images, and operator and instrument variability 87–91 A recent study of spectral domain OCT the between-session coefficient of variation for mean RNFL was about 4% and this rose to 10% for the temporal clock hour RNFL thickness 92. A recent study identified that between-individual difference accounted for 87% and 71% of the total variance in OCT and SAP measurements, respectively, in healthy eyes 60
Other factors influencing the structure-function relationship
When perimetric sensitivities are reported in dB and imaging measures are reported in linear units, the correlation between structural and functional measures varies with severity of damage. Gonzalez-Hernandez and colleagues correlated visual field sensitivity in dB and RNFL thickness in linear units, dividing their study population into those with MD greater than 22.42 dB and those with MD less than 22.42, the value of 22.42 being based on the ‘breakpoint’ of two populations with different linear regression slopes. The correlation coefficients in these 2 groups were 0.18 and 0.35 respectively, and the authors concluded that the range of disease severity influences the inferred relationship. Investigators of another study did not find a significant correlation between sensitivity and RNFL thickness in healthy eyes and eyes classified as having “preperimetric glaucoma”, but a significant curvilinear relationship between the two measures was found in glaucoma patients 93.
Linear regression analysis has been widely used to compare structural and functional measures. Although two discordant measures can be significantly correlated when sample size is high, regression analysis provides little information about the level of agreement between measures 94. The strength of the structure-function regression can be affected by sample size, range of glaucoma severity 95, units of perimetric measurement 10, 82 and measurement variability. An additional consideration is the inappropriate use of linear regression techniques which assume no error in the independent variable, which is clearly not the case; this results in an inaccurate estimation of the slope of association between variables. Analysing agreement between structural and functional parameters is complicated by different units of measurement. Some have computed each measure as a percentage of mean normal, allowing Bland-Altman plots of agreement to be graphed 15, 16, 86.
Future directions in structure-function research
It remains to be seen whether with rapidly developing imaging technology in time may provide methods for counting RGC nuclei in vivo, permitting direct comparison with retinal sensitivity. This may increase our understanding of the relationship of sensitivity with underlying cell loss in glaucoma.
The standard 24-2 grid has visual field test points that are unevenly distributed with respect to their optic disc sector correspondence 76 and to the distribution of RGC density;. The conventional Goldmann size III stimulus covers a variable number of RGC receptive fields across the central 30 degrees. A distribution of test locations that better represents the distribution of RGCs and a stimulus which is ‘scaled’ by estimates of RGC receptive field density can be expected to yield stronger structure-function correlations. Adaptation of the spatial correspondence map to include factors that explain individual variation in the correspondence of retinal locations to peripapillary RNFL sectors would further improve structure-function associations. Additional research is also required to elucidate the relationship between stimulus area and retinal sensitivity in glaucomatous regions of the visual field and to establish whether a linear relationship between stimulus area and retinal sensitivity, with a slope of 1, holds.
Combining structural and functional testing improves the diagnostic ability to detect glaucoma 96, 97. It is likely that the next decade will witness integration of structural and functional test results to monitor glaucoma for clinical use. Visual field sensitivity can be predicted from structural measurements 73, 98. As the predicted and measured visual field have different sources of error, integrating them to produce a ‘combined’ visual field may result in a more reproducible measurement that is more sensitive for identifying progression than standard automated perimetry alone. An alternative integrated approach for using structure and function to identify progression is to analyse both together in a Bayesian hierarchical model 99. This seems to result in a greater proportion of glaucomatous and suspect eyes identified with progression than analyses of structure or function separately, with maintained estimated specificity.
Acknowledgments
Financial Support
Some of the authors (Dr R Malik, Professor DF Garway-Heath) receive funding from the National Institute for Health Research (UK) Biomedical Research Centre at Moorfields Eye Hospital and the UCL Institute of Ophthalmology. Professor Garway-Heath’s chair at UCL is supported by funding from the International Glaucoma Association. Professor Swanson receives funding from the USPS National Institutes for Health (EY007716).
Footnotes
The definitive version is available at wileyonlinelibrary.com
Conflicting/Competing Interests
R Malik: None
WH Swanson: None
DF Garway-Heath: Heidelberg Engineering (research support, speakers’ fees); Carl Zeiss Meditec: (research support, consultant, speakers’ fees); OptoVue (research support, speakers’ fees); Moorfields MDT (co-inventor)
Contributor Information
Rizwan Malik, Clinical Lecturer in Ophthalmic Translational Research, NIHR Biomedical Research Centre for Ophthalmology, Moorfields Eye Hospital NHS Foundation Trust, & UCL Institute of Ophthalmology, City Road, London, EC1V 2PD.
William H. Swanson, Professor of Optometry, Indiana University School of Optometry, 800 East Atwater Avenue, Bloomington, Indiana, IN 47405-3680.
David F Garway-Heath, IGA Professor of Ophthalmology, NIHR Biomedical Research Centre for Ophthalmology, Moorfields Eye Hospital NHS Foundation Trust, & UCL Institute of Ophthalmology, City Road, London, EC1V 2PD.
References
- 1.European Glaucoma Society. Terminology and guidelines for glaucoma. 3. Vol. 2008. Savona: Italy Editrice Dogma; 2008. http://www.eugs.org/eng/egs_guidelines.asp. [Google Scholar]
- 2.Weinreb RN, Khaw PT. Primary open-angle glaucoma. Lancet. 2004;363(9422):1711–20. doi: 10.1016/S0140-6736(04)16257-0. [DOI] [PubMed] [Google Scholar]
- 3.Keltner JL, Johnson CA, Anderson DR, Levine RA, Fan J, Cello KE, et al. The association between glaucomatous visual fields and optic nerve head features in the Ocular Hypertension Treatment Study. Ophthalmology. 2006;113(9):1603–12. doi: 10.1016/j.ophtha.2006.05.061. [DOI] [PubMed] [Google Scholar]
- 4.Leske MC, Heijl A, Hussein M, Bengtsson B, Hyman L, Komaroff E. Factors for glaucoma progression and the effect of treatment: the early manifest glaucoma trial. Arch Ophthalmol. 2003;121(1):48–56. doi: 10.1001/archopht.121.1.48. [DOI] [PubMed] [Google Scholar]
- 5.Miglior S, Zeyen T, Pfeiffer N, Cunha-Vaz J, Torri V, Adamsons I. Results of the European Glaucoma Prevention Study. Ophthalmology. 2005;112(3):366–75. doi: 10.1016/j.ophtha.2004.11.030. [DOI] [PubMed] [Google Scholar]
- 6.Read RM, Spaeth GL. The practical clinical appraisal of the optic disc in glaucoma: the natural history of cup progression and some specific disc-field correlations. Trans Am Acad Ophthalmol Otolaryngol. 1974;78(2):OP255–74. [PubMed] [Google Scholar]
- 7.Quigley HA, Dunkelberger GR, Green WR. Retinal ganglion cell atrophy correlated with automated perimetry in human eyes with glaucoma. Am J Ophthalmol. 1989;107(5):453–64. doi: 10.1016/0002-9394(89)90488-1. [DOI] [PubMed] [Google Scholar]
- 8.Harwerth RS, Carter-Dawson L, Shen F, Smith EL, 3rd, Crawford ML. Ganglion cell losses underlying visual field defects from experimental glaucoma. Invest Ophthalmol Vis Sci. 1999;40(10):2242–50. [PubMed] [Google Scholar]
- 9.Ederer F, Gaasterland DA, Dally LG, Kim J, VanVeldhuisen PC, Blackwell B, et al. The Advanced Glaucoma Intervention Study (AGIS): 13. Comparison of treatment outcomes within race: 10-year results. Ophthalmology. 2004;111(4):651–64. doi: 10.1016/j.ophtha.2003.09.025. [DOI] [PubMed] [Google Scholar]
- 10.Garway-Heath DF, Holder GE, Fitzke FW, Hitchings RA. Relationship between electrophysiological, psychophysical, and anatomical measurements in glaucoma. Invest Ophthalmol Vis Sci. 2002;43(7):2213–20. [PubMed] [Google Scholar]
- 11.Reus NJ, Lemij HG. The relationship between standard automated perimetry and GDx VCC measurements. Invest Ophthalmol Vis Sci. 2004;45(3):840–5. doi: 10.1167/iovs.03-0646. [DOI] [PubMed] [Google Scholar]
- 12.Garway-Heath DF, Caprioli J, Fitzke FW, Hitchings RA. Scaling the hill of vision: the physiological relationship between light sensitivity and ganglion cell numbers. Invest Ophthalmol Vis Sci. 2000;41(7):1774–82. [PubMed] [Google Scholar]
- 13.Schlottmann PG, De Cilla S, Greenfield DS, Caprioli J, Garway-Heath DF. Relationship between visual field sensitivity and retinal nerve fiber layer thickness as measured by scanning laser polarimetry. Invest Ophthalmol Vis Sci. 2004;45(6):1823–9. doi: 10.1167/iovs.03-0692. [DOI] [PubMed] [Google Scholar]
- 14.Hood DC, Greenstein VC, Odel JG, Zhang X, Ritch R, Liebmann JM, et al. Visual field defects and multifocal visual evoked potentials: evidence of a linear relationship. Arch Ophthalmol. 2002;120(12):1672–81. doi: 10.1001/archopht.120.12.1672. [DOI] [PubMed] [Google Scholar]
- 15.Yang A, Swanson WH. A new pattern electroretinogram paradigm evaluated in terms of user friendliness and agreement with perimetry. Ophthalmology. 2007;114(4):671–9. doi: 10.1016/j.ophtha.2006.07.061. [DOI] [PMC free article] [PubMed] [Google Scholar]
- 16.Shafi A, Swanson WH, Dul MW. Structure and function in patients with glaucomatous defects near fixation. Optom Vis Sci. 2011;88(1):130–9. doi: 10.1097/OPX.0b013e3181fa38f4. [DOI] [PMC free article] [PubMed] [Google Scholar]
- 17.Hood DC, Kardon RH. A framework for comparing structural and functional measures of glaucomatous damage. Prog Retin Eye Res. 2007;26(6):688–710. doi: 10.1016/j.preteyeres.2007.08.001. [DOI] [PMC free article] [PubMed] [Google Scholar]
- 18.Leite MT, Zangwill LM, Weinreb RN, Rao HL, Alencar LM, Medeiros FA. Structure-function Relationships Using the Cirrus Spectral Domain Optical Coherence Tomograph and Standard Automated Perimetry. J Glaucoma. 2012;21(1):49–54. doi: 10.1097/IJG.0b013e31822af27a. [DOI] [PMC free article] [PubMed] [Google Scholar]
- 19.Glezer VD. The receptive fields of the retina. Vision Res. 1965;5(9):497–525. doi: 10.1016/0042-6989(65)90084-2. [DOI] [PubMed] [Google Scholar]
- 20.Davila KD, Geisler WS. The relative contributions of pre-neural and neural factors to areal summation in the fovea. Vision Res. 1991;31(7–8):1369–80. doi: 10.1016/0042-6989(91)90058-d. [DOI] [PubMed] [Google Scholar]
- 21.Pan F, Swanson WH. A cortical pooling model of spatial summation for perimetric stimuli. J Vis. 2006;6(11):1159–71. doi: 10.1167/6.11.2. [DOI] [PMC free article] [PubMed] [Google Scholar]
- 22.Johnson CA. Selective versus nonselective losses in glaucoma. J Glaucoma. 1994;3 (Suppl 1):S32–44. [PubMed] [Google Scholar]
- 23.Pearson PM, Schmidt LA, Ly-Schroeder E, Swanson WH. Ganglion cell loss and age-related visual loss: a cortical pooling analysis. Optom Vis Sci. 2006;83(7):444–54. doi: 10.1097/01.opx.0000218432.52508.10. [DOI] [PMC free article] [PubMed] [Google Scholar]
- 24.Pan F, Swanson WH, Dul MW. Evaluation of a two-stage neural model of glaucomatous defect: an approach to reduce test-retest variability. Optom Vis Sci. 2006;83(7):499–511. doi: 10.1097/01.opx.0000225091.60457.f4. [DOI] [PMC free article] [PubMed] [Google Scholar]
- 25.Sun H, Dul MW, Swanson WH. Linearity can account for the similarity among conventional, frequency-doubling, and gabor-based perimetric tests in the glaucomatous macula. Optom Vis Sci. 2006;83(7):455–65. doi: 10.1097/01.opx.0000225103.18087.5d. [DOI] [PMC free article] [PubMed] [Google Scholar]
- 26.Gardiner SK, Swanson WH, Demirel S, McKendrick AM, Turpin A, Johnson CA. A two-stage neural spiking model of visual contrast detection in perimetry. Vision Res. 2008;48(18):1859–69. doi: 10.1016/j.visres.2008.06.006. [DOI] [PMC free article] [PubMed] [Google Scholar]
- 27.Keltgen KM, Swanson WH. Estimation of Spatial Scale Across the Visual Field Using Sinusoidal Stimuli. Invest Ophthalmol Vis Sci. 2011 doi: 10.1167/iovs.10-6674. [DOI] [PMC free article] [PubMed] [Google Scholar]
- 28.Fellman RL, Lynn JR, Starita RJ, Swanson WH. Clinical importance of spatial summation in glaucoma. In: Heijl A, editor. Perimetry Update 1988/89. Vol. 1989. Berkeley: Kugler & Ghedini; The Hague (Netherlands): 1989. pp. 313–24. [Google Scholar]
- 29.Wilson ME. Spatial and temporal summation in impaired regions of the visual field. J Physiol. 1967;189(2):189–208. doi: 10.1113/jphysiol.1967.sp008163. [DOI] [PMC free article] [PubMed] [Google Scholar]
- 30.Dannheim F, Drance SM. Psychovisual disturbances in glaucoma. A study of temporal and spatial summation. Arch Ophthalmol. 1974;91(6):463–8. doi: 10.1001/archopht.1974.03900060477010. [DOI] [PubMed] [Google Scholar]
- 31.Redmond T, Garway-Heath DF, Zlatkova M, Anderson RS. Sensitivity loss in early glaucoma can be mapped to an enlargement of the area of complete spatial summation. Invest Ophthalmol Vis Sci. 2010 doi: 10.1167/iovs.10-5718. [DOI] [PubMed] [Google Scholar]
- 32.Pederson JE, Anderson DR. The mode of progressive disc cupping in ocular hypertension and glaucoma. Arch Ophthalmol. 1980;98(3):490–5. doi: 10.1001/archopht.1980.01020030486010. [DOI] [PubMed] [Google Scholar]
- 33.Yablonski ME, Zimmerman TJ, Kass MA, Becker B. Prognostic significance of optic disk cupping in ocular hypertensive patients. Am J Ophthalmol. 1980;89(4):585–92. doi: 10.1016/0002-9394(80)90071-9. [DOI] [PubMed] [Google Scholar]
- 34.Quigley HA, Addicks EM, Green WR. Optic nerve damage in human glaucoma. III. Quantitative correlation of nerve fiber loss and visual field defect in glaucoma, ischemic neuropathy, papilledema, and toxic neuropathy. Arch Ophthalmol. 1982;100(1):135–46. doi: 10.1001/archopht.1982.01030030137016. [DOI] [PubMed] [Google Scholar]
- 35.Bartz-Schmidt KU, Thumann G, Jonescu-Cuypers CP, Krieglstein GK. Quantitative morphologic and functional evaluation of the optic nerve head in chronic open-angle glaucoma. Surv Ophthalmol. 1999;44 (Suppl 1):S41–53. doi: 10.1016/s0039-6257(99)00076-4. [DOI] [PubMed] [Google Scholar]
- 36.Airaksinen PJ, Drance SM, Douglas GR, Schulzer M. Neuroretinal rim areas and visual field indices in glaucoma. Am J Ophthalmol. 1985;99(2):107–10. doi: 10.1016/0002-9394(85)90216-8. [DOI] [PubMed] [Google Scholar]
- 37.Jonas JB, Grundler AE. Correlation between mean visual field loss and morphometric optic disk variables in the open-angle glaucomas. Am J Ophthalmol. 1997;124(4):488–97. doi: 10.1016/s0002-9394(14)70864-5. [DOI] [PubMed] [Google Scholar]
- 38.Swanson WH, Felius J, Pan F. Perimetric defects and ganglion cell damage: interpreting linear relations using a two-stage neural model. Invest Ophthalmol Vis Sci. 2004;45(2):466–72. doi: 10.1167/iovs.03-0374. [DOI] [PubMed] [Google Scholar]
- 39.Sihota R, Sony P, Gupta V, Dada T, Singh R. Diagnostic capability of optical coherence tomography in evaluating the degree of glaucomatous retinal nerve fiber damage. Invest Ophthalmol Vis Sci. 2006;47(5):2006–10. doi: 10.1167/iovs.05-1102. [DOI] [PubMed] [Google Scholar]
- 40.Weinreb RN, Garway-Heath CLJGCFAMDF, editors. World Glaucoma Association 2011. Progression of glaucoma. Kugler Publications; Amsterdam, the Netherlands: 2011. [Google Scholar]
- 41.Kerrigan-Baumrind LA, Quigley HA, Pease ME, Kerrigan DF, Mitchell RS. Number of ganglion cells in glaucoma eyes compared with threshold visual field tests in the same persons. Invest Ophthalmol Vis Sci. 2000;41(3):741–8. [PubMed] [Google Scholar]
- 42.Ohba N, Nakao K, Isashiki Y, Ohba A. The 100 most frequently cited articles in ophthalmology journals. Arch Ophthalmol. 2007;125(7):952–60. doi: 10.1001/archopht.125.7.952. [DOI] [PubMed] [Google Scholar]
- 43.Nouri-Mahdavi K, Nassiri N, Giangiacomo A, Caprioli J. Detection of visual field progression in glaucoma with standard achromatic perimetry: a review and practical implications. Graefes Arch Clin Exp Ophthalmol. 2011;249(11):1593–616. doi: 10.1007/s00417-011-1787-5. [DOI] [PubMed] [Google Scholar]
- 44.Chan HH, Ng YF, Chu PH. Applications of the multifocal electroretinogram in the detection of glaucoma. Clin Exp Optom. 2011;94(3):247–58. doi: 10.1111/j.1444-0938.2010.00571.x. [DOI] [PubMed] [Google Scholar]
- 45.Parikh RS, Parikh SR, Thomas R. Diagnostic capability of macular parameters of Stratus OCT 3 in detection of early glaucoma. Br J Ophthalmol. 2010;94(2):197–201. doi: 10.1136/bjo.2008.143602. [DOI] [PubMed] [Google Scholar]
- 46.Salvetat ML, Zeppieri M, Tosoni C, Parisi L, Brusini P. Non-conventional perimetric methods in the detection of early glaucomatous functional damage. Eye (Lond) 2010;24(5):835–42. doi: 10.1038/eye.2009.216. [DOI] [PubMed] [Google Scholar]
- 47.Kotera Y, Hangai M, Hirose F, Mori S, Yoshimura N. Three-dimensional imaging of macular inner structures in glaucoma by using spectral-domain optical coherence tomography. Invest Ophthalmol Vis Sci. 2011;52(3):1412–21. doi: 10.1167/iovs.10-5572. [DOI] [PubMed] [Google Scholar]
- 48.Turalba AV, Grosskreutz C. A review of current technology used in evaluating visual function in glaucoma. Semin Ophthalmol. 2010;25(5–6):309–16. doi: 10.3109/08820538.2010.518898. [DOI] [PubMed] [Google Scholar]
- 49.Kass MA, Heuer DK, Higginbotham EJ, Johnson CA, Keltner JL, Miller JP, et al. The Ocular Hypertension Treatment Study: a randomized trial determines that topical ocular hypotensive medication delays or prevents the onset of primary open-angle glaucoma. Arch Ophthalmol. 2002;120(6):701–13. doi: 10.1001/archopht.120.6.701. discussion 829–30. [DOI] [PubMed] [Google Scholar]
- 50.Heijl A, Leske MC, Bengtsson B, Hyman L, Hussein M. Reduction of intraocular pressure and glaucoma progression: results from the Early Manifest Glaucoma Trial. Arch Ophthalmol. 2002;120(10):1268–79. doi: 10.1001/archopht.120.10.1268. [DOI] [PubMed] [Google Scholar]
- 51.Deleon-Ortega JE, Arthur SN, McGwin G, Jr, Xie A, Monheit BE, Girkin CA. Discrimination between glaucomatous and nonglaucomatous eyes using quantitative imaging devices and subjective optic nerve head assessment. Invest Ophthalmol Vis Sci. 2006;47(8):3374–80. doi: 10.1167/iovs.05-1239. [DOI] [PMC free article] [PubMed] [Google Scholar]
- 52.Sample PA, Medeiros FA, Racette L, Pascual JP, Boden C, Zangwill LM, et al. Identifying glaucomatous vision loss with visual-function-specific perimetry in the diagnostic innovations in glaucoma study. Invest Ophthalmol Vis Sci. 2006;47(8):3381–9. doi: 10.1167/iovs.05-1546. [DOI] [PubMed] [Google Scholar]
- 53.Garway-Heath DF, Hitchings RA. Sources of bias in studies of optic disc and retinal nerve fibre layer morphology. Br J Ophthalmol. 1998;82(9):986. doi: 10.1136/bjo.82.9.986. [DOI] [PMC free article] [PubMed] [Google Scholar]
- 54.Strouthidis NG, Scott A, Peter NM, Garway-Heath DF. Optic disc and visual field progression in ocular hypertensive subjects: detection rates, specificity, and agreement. Invest Ophthalmol Vis Sci. 2006;47(7):2904–10. doi: 10.1167/iovs.05-1584. [DOI] [PubMed] [Google Scholar]
- 55.Artes PH, Chauhan BC. Longitudinal changes in the visual field and optic disc in glaucoma. Prog Retin Eye Res. 2005;24(3):333–54. doi: 10.1016/j.preteyeres.2004.10.002. [DOI] [PubMed] [Google Scholar]
- 56.Harwerth RS, Vilupuru AS, Rangaswamy NV, Smith EL., 3rd The relationship between nerve fiber layer and perimetry measurements. Invest Ophthalmol Vis Sci. 2007;48(2):763–73. doi: 10.1167/iovs.06-0688. [DOI] [PubMed] [Google Scholar]
- 57.Ventura LM, Sorokac N, De Los Santos R, Feuer WJ, Porciatti V. The relationship between retinal ganglion cell function and retinal nerve fiber thickness in early glaucoma. Invest Ophthalmol Vis Sci. 2006;47(9):3904–11. doi: 10.1167/iovs.06-0161. [DOI] [PMC free article] [PubMed] [Google Scholar]
- 58.Ventura LM, Porciatti V. Restoration of retinal ganglion cell function in early glaucoma after intraocular pressure reduction: a pilot study. Ophthalmology. 2005;112(1):20–7. doi: 10.1016/j.ophtha.2004.09.002. [DOI] [PMC free article] [PubMed] [Google Scholar]
- 59.Sun H, Swanson WH, Arvidson B, Dul MW. Assessment of contrast gain signature in inferred magnocellular and parvocellular pathways in patients with glaucoma. Vision Res. 2008;48(26):2633–41. doi: 10.1016/j.visres.2008.04.008. [DOI] [PMC free article] [PubMed] [Google Scholar]
- 60.Hood DC, Anderson SC, Wall M, Raza AS, Kardon RH. A test of a linear model of glaucomatous structure-function loss reveals sources of variability in retinal nerve fiber and visual field measurements. Invest Ophthalmol Vis Sci. 2009;50(9):4254–66. doi: 10.1167/iovs.08-2697. [DOI] [PMC free article] [PubMed] [Google Scholar]
- 61.Harwerth RS, Carter-Dawson L, Smith EL, 3rd, Barnes G, Holt WF, Crawford ML. Neural losses correlated with visual losses in clinical perimetry. Invest Ophthalmol Vis Sci. 2004;45(9):3152–60. doi: 10.1167/iovs.04-0227. [DOI] [PubMed] [Google Scholar]
- 62.Harwerth RS, Wheat JL, Fredette MJ, Anderson DR. Linking structure and function in glaucoma. Prog Retin Eye Res. 2010;29(4):249–71. doi: 10.1016/j.preteyeres.2010.02.001. [DOI] [PMC free article] [PubMed] [Google Scholar]
- 63.Harwerth RS, Quigley HA. Visual field defects and retinal ganglion cell losses in patients with glaucoma. Arch Ophthalmol. 2006;124(6):853–9. doi: 10.1001/archopht.124.6.853. [DOI] [PMC free article] [PubMed] [Google Scholar]
- 64.Drasdo N, Millican CL, Katholi CR, Curcio CA. The length of Henle fibers in the human retina and a model of ganglion receptive field density in the visual field. Vision Res. 2007;47(22):2901–11. doi: 10.1016/j.visres.2007.01.007. [DOI] [PMC free article] [PubMed] [Google Scholar]
- 65.Drasdo N, Mortlock KE, North RV. Ganglion cell loss and dysfunction: relationship to perimetric sensitivity. Optom Vis Sci. 2008;85(11):1036–42. doi: 10.1097/OPX.0b013e31818b94af. [DOI] [PubMed] [Google Scholar]
- 66.Anderson DR, Knighton RW. Perimetry and acute perimetry. In: Shields, Pollack, Kolker, editors. Perspectives in Glaucoma. Slack, Inc; Thorofare, NJ: 1988. pp. 59–70. [Google Scholar]
- 67.Heijl A, Lindgren G, Olsson J. Normal variability of static perimetric threshold values across the central visual field. Arch Ophthalmol. 1987;105(11):1544–9. doi: 10.1001/archopht.1987.01060110090039. [DOI] [PubMed] [Google Scholar]
- 68.Curcio CA, Allen KA. Topography of ganglion cells in human retina. J Comp Neurol. 1990;300(1):5–25. doi: 10.1002/cne.903000103. [DOI] [PubMed] [Google Scholar]
- 69.Wilson ME. Invariant features of spatial summation with changing locus in the visual field. J Physiol. 1970;207(3):611–22. doi: 10.1113/jphysiol.1970.sp009083. [DOI] [PMC free article] [PubMed] [Google Scholar]
- 70.Robson JG, Graham N. Probability summation and regional variation in contrast sensitivity across the visual field. Vision Res. 1981;21(3):409–18. doi: 10.1016/0042-6989(81)90169-3. [DOI] [PubMed] [Google Scholar]
- 71.Varma R, Quigley HA, Pease ME. Changes in optic disk characteristics and number of nerve fibers in experimental glaucoma. Am J Ophthalmol. 1992;114(5):554–9. doi: 10.1016/s0002-9394(14)74482-4. [DOI] [PubMed] [Google Scholar]
- 72.Yucel YH, Gupta N, Kalichman MW, Mizisin AP, Hare W, de Souza Lima M, et al. Relationship of optic disc topography to optic nerve fiber number in glaucoma. Arch Ophthalmol. 1998;116(4):493–7. doi: 10.1001/archopht.116.4.493. [DOI] [PubMed] [Google Scholar]
- 73.Zhang X, Bregman CJ, Raza AS, De Moraes G, Hood DC. Deriving visual field loss based upon OCT of inner retinal thicknesses of the macula. Biomed Opt Express. 2011;2(6):1734–42. doi: 10.1364/BOE.2.001734. [DOI] [PMC free article] [PubMed] [Google Scholar]
- 74.Raza AS, Cho J, de Moraes CG, Wang M, Zhang X, Kardon RH, et al. Retinal ganglion cell layer thickness and local visual field sensitivity in glaucoma. Arch Ophthalmol. 2011;129(12):1529–36. doi: 10.1001/archophthalmol.2011.352. [DOI] [PMC free article] [PubMed] [Google Scholar]
- 75.Bergin C, Redmond T, Nathwani N, Verdon-Roe GM, Crabb DP, Anderson RS, et al. The effect of induced intraocular straylight on perimetric tests. Invest Ophthalmol Vis Sci. 2011;52(6):3676–82. doi: 10.1167/iovs.10-6642. [DOI] [PubMed] [Google Scholar]
- 76.Garway-Heath DF, Poinoosawmy D, Fitzke FW, Hitchings RA. Mapping the visual field to the optic disc in normal tension glaucoma eyes. Ophthalmology. 2000;107(10):1809–15. doi: 10.1016/s0161-6420(00)00284-0. [DOI] [PubMed] [Google Scholar]
- 77.Weber J, Dannheim F, Dannheim D. The topographical relationship between optic disc and visual field in glaucoma. Acta Ophthalmol (Copenh) 1990;68(5):568–74. doi: 10.1111/j.1755-3768.1990.tb04789.x. [DOI] [PubMed] [Google Scholar]
- 78.Wirtschafter JD, Becker WL, Howe JB, Younge BR. Glaucoma visual field analysis by computed profile of nerve fiber function in optic disc sectors. Ophthalmology. 1982;89(3):255–67. doi: 10.1016/s0161-6420(82)34799-5. [DOI] [PubMed] [Google Scholar]
- 79.Gardiner SK, Johnson CA, Cioffi GA. Evaluation of the structure-function relationship in glaucoma. Invest Ophthalmol Vis Sci. 2005;46(10):3712–7. doi: 10.1167/iovs.05-0266. [DOI] [PubMed] [Google Scholar]
- 80.Jansonius NM, Nevalainen J, Selig B, Zangwill LM, Sample PA, Budde WM, et al. A mathematical description of nerve fiber bundle trajectories and their variability in the human retina. Vision Res. 2009;49(17):2157–63. doi: 10.1016/j.visres.2009.04.029. [DOI] [PMC free article] [PubMed] [Google Scholar]
- 81.Turpin A, Sampson GP, McKendrick AM. Combining ganglion cell topology and data of patients with glaucoma to determine a structure-function map. Invest Ophthalmol Vis Sci. 2009;50(7):3249–56. doi: 10.1167/iovs.08-2492. [DOI] [PubMed] [Google Scholar]
- 82.Racette L, Medeiros FA, Bowd C, Zangwill LM, Weinreb RN, Sample PA. The impact of the perimetric measurement scale, sample composition, and statistical method on the structure-function relationship in glaucoma. J Glaucoma. 2007;16(8):676–84. doi: 10.1097/IJG.0b013e31804d23c2. [DOI] [PubMed] [Google Scholar]
- 83.Artes PH, Iwase A, Ohno Y, Kitazawa Y, Chauhan BC. Properties of perimetric threshold estimates from Full Threshold, SITA Standard, and SITA Fast strategies. Invest Ophthalmol Vis Sci. 2002;43(8):2654–9. [PubMed] [Google Scholar]
- 84.Heijl A, Lindgren A, Lindgren G. Test-retest variability in glaucomatous visual fields. Am J Ophthalmol. 1989;108(2):130–5. doi: 10.1016/0002-9394(89)90006-8. [DOI] [PubMed] [Google Scholar]
- 85.Piltz JR, Starita RJ. Test-retest variability in glaucomatous visual fields. Am J Ophthalmol. 1990;109(1):109–11. [PubMed] [Google Scholar]
- 86.Hot A, Dul MW, Swanson WH. Development and evaluation of a contrast sensitivity perimetry test for patients with glaucoma. Invest Ophthalmol Vis Sci. 2008;49(7):3049–57. doi: 10.1167/iovs.07-1205. [DOI] [PMC free article] [PubMed] [Google Scholar]
- 87.Strouthidis NG, White ET, Owen VM, Ho TA, Hammond CJ, Garway-Heath DF. Factors affecting the test-retest variability of Heidelberg retina tomograph and Heidelberg retina tomograph II measurements. Br J Ophthalmol. 2005;89(11):1427–32. doi: 10.1136/bjo.2005.067298. [DOI] [PMC free article] [PubMed] [Google Scholar]
- 88.Sihota R, Gulati V, Agarwal HC, Saxena R, Sharma A, Pandey RM. Variables affecting test-retest variability of Heidelberg Retina Tomograph II stereometric parameters. J Glaucoma. 2002;11(4):321–8. doi: 10.1097/00061198-200208000-00008. [DOI] [PubMed] [Google Scholar]
- 89.Wu Z, Vazeen M, Varma R, Chopra V, Walsh AC, LaBree LD, et al. Factors associated with variability in retinal nerve fiber layer thickness measurements obtained by optical coherence tomography. Ophthalmology. 2007;114(8):1505–12. doi: 10.1016/j.ophtha.2006.10.061. [DOI] [PubMed] [Google Scholar]
- 90.Mwanza JC, Gendy MG, Feuer WJ, Shi W, Budenz DL. Effects of changing operators and instruments on time-domain and spectral-domain OCT measurements of retinal nerve fiber layer thickness. Ophthalmic Surg Lasers Imaging. 2011;42(4):328–37. doi: 10.3928/15428877-20110603-05. [DOI] [PubMed] [Google Scholar]
- 91.Grewal DS, Sehi M, Cook RJ, Greenfield DS. The impact of retardance pattern variability on nerve fiber layer measurements over time using GDx with variable and enhanced corneal compensation. Invest Ophthalmol Vis Sci. 2011;52(7):4516–24. doi: 10.1167/iovs.10-5969. [DOI] [PMC free article] [PubMed] [Google Scholar]
- 92.Mansoori T, Viswanath K, Balakrishna N. Reproducibility of peripapillary retinal nerve fibre layer thickness measurements with spectral domain optical coherence tomography in normal and glaucomatous eyes. Br J Ophthalmol. 2011;95 (5):685–8. doi: 10.1136/bjo.2010.183020. [DOI] [PubMed] [Google Scholar]
- 93.Ajtony C, Balla Z, Somoskeoy S, Kovacs B. Relationship between visual field sensitivity and retinal nerve fiber layer thickness as measured by optical coherence tomography. Invest Ophthalmol Vis Sci. 2007;48(1):258–63. doi: 10.1167/iovs.06-0410. [DOI] [PubMed] [Google Scholar]
- 94.Bland JM, Altman DG. Statistical methods for assessing agreement between two methods of clinical measurement. Lancet. 1986;1(8476):307–10. [PubMed] [Google Scholar]
- 95.Gonzalez-Hernandez M, Pablo LE, Armas-Dominguez K, de la Vega RR, Ferreras A, de la Rosa MG. Structure-function relationship depends on glaucoma severity. Br J Ophthalmol. 2009;93(9):1195–9. doi: 10.1136/bjo.2008.154815. [DOI] [PubMed] [Google Scholar]
- 96.Robin TA, Muller A, Rait J, Keeffe JE, Taylor HR, Mukesh BN. Performance of community-based glaucoma screening using Frequency Doubling Technology and Heidelberg Retinal Tomography. Ophthalmic Epidemiol. 2005;12(3):167–78. doi: 10.1080/09286580590969716. [DOI] [PubMed] [Google Scholar]
- 97.Bizios D, Heijl A, Bengtsson B. Integration and fusion of standard automated perimetry and optical coherence tomography data for improved automated glaucoma diagnostics. BMC Ophthalmol. 2011;11:20. doi: 10.1186/1471-2415-11-20. [DOI] [PMC free article] [PubMed] [Google Scholar]
- 98.Zhu H, Crabb DP, Schlottmann PG, Lemij HG, Reus NJ, Healey PR, et al. Predicting visual function from the measurements of retinal nerve fiber layer structure. Invest Ophthalmol Vis Sci. 2010;51(11):5657–66. doi: 10.1167/iovs.10-5239. [DOI] [PubMed] [Google Scholar]
- 99.Medeiros FA, Leite MT, Zangwill LM, Weinreb RN. Combining Structural and Functional Measurements to Improve Detection of Glaucoma Progression using Bayesian Hierarchical Models. Invest Ophthalmol Vis Sci. 2011 doi: 10.1167/iovs.10-7111. [DOI] [PMC free article] [PubMed] [Google Scholar]