

Abstract
The human brain undergoes rapid and dynamic development early in life. Assessment of brain growth patterns relevant to neurological disorders and disease requires a normative population model of growth and variability in order to evaluate deviation from typical development. In this paper, we focus on maturation of brain white matter as shown in diffusion tensor MRI (DT-MRI), measured by fractional anisotropy (FA), mean diffusivity (MD), as well as axial and radial diffusivities (AD, RD). We present a novel methodology to model temporal changes of white matter diffusion from longitudinal DT-MRI data taken at discrete time points. Our proposed framework combines nonlinear modeling of trajectories of individual subjects, population analysis, and testing for regional differences in growth pattern. We first perform deformable mapping of longitudinal DT-MRI of healthy infants imaged at birth, 1 year, and 2 years of age, into a common unbiased atlas. An existing template of labeled white matter regions is registered to this atlas to define anatomical regions of interest. Diffusivity properties of these regions, presented over time, serve as input to the longitudinal characterization of changes. We use non-linear mixed effect (NLME) modeling where temporal change is described by the Gompertz function. The Gompertz growth function uses intuitive parameters related to delay, rate of change, and expected asymptotic value; all descriptive measures which can answer clinical questions related to quantitative analysis of growth patterns. Results suggest that our proposed framework provides descriptive and quantitative information on growth trajectories that can be interpreted by clinicians using natural language terms that describe growth. Statistical analysis of regional differences between anatomical regions which are known to mature differently demonstrates the potential of the proposed method for quantitative assessment of brain growth and differences thereof. This will eventually lead to a prediction of white matter diffusion properties and associated cognitive development at later stages given imaging data at early stages.
Keywords: Longitudinal brain imaging, Early brain development, DTI, Nonlinear mixed effect modeling
Introduction
Improved understanding of typical brain development during infancy, an interval characterized by rapid sculpting, organization and vulnerability to exogenous influences, is of a great importance both for clinical and scientific research. Many neurobehavioral disorders have their origins during neurodevelopment (Gilmore et al., 2010; Huppi, 2008). Establishing a normative model of early brain development is a critical step to understanding the timing and potential mechanisms of atypical development and how intervention might alter such trajectories and improve developmental outcomes (Als et al., 2004; Marsh et al., 2008). Once normative models are available, they can inform research and practice concerning children at risk for neurodevelopmental disorders and may eventually lead to earlier and improved diagnosis and treatment. Longitudinal trajectory-based studies provide a better understanding of human brain development compared to cross-sectional studies (Karmiloff-Smith, 2010). In cross-sectional data, calculation of the average trajectory may not be representative for the growth patterns of individual subjects as this approach is inherently insensitive to individual developmental differences and cohort effects (Gogtay et al., 2004). Cross-sectional analysis might falsely report magnitude of changes over time or may fail to detect changes (Casey et al., 2005).
Growth modeling from longitudinal data, on the other hand, makes use of sets of individual temporal trajectories which results in significantly improved models of growth and growth variability, as longitudinal studies can differentiate between cohort and age effects (Diggle et al., 2002).
Previous imaging studies of early brain development have substantially contributed to our current understanding of brain development. Some of the studies considered size or shape differences (Huppi, 2008; Knickmeyer et al., 2008; Xu et al., 2008; Xue et al., 2007), others have looked at changes of contrast in MRI (Sadeghi et al., 2010) or diffusion parameters in DTI (Gao et al., 2009; Geng et al., 2012; Hermoye et al., 2006; Huppi et al., 1998; Mukherjee et al., 2002; Sadeghi et al., 2012). However, most of these studies are based on cross-sectional data or children older than 2 years (Dubois et al., 2008; Faria et al., 2010; Gao et al., 2009; Hermoye et al., 2006; Mukherjee et al., 2002). In this study we focus on developing longitudinal models spanning birth to about two years of age. The models are based on the parameters obtained from diffusion tensor imaging (DTI). DTI-derived diffusivity parameters provide relevant information about the maturation of the underlying tissue as they assess water content (Huppi, 2008). These measurements are a possible reflection of axonal density and/or degree of myelination (Neil et al., 1998; Song et al., 2002) which correlate with cognitive functions (Dubois et al., 2006) and early developmental outcomes (Als et al., 2004; Ment et al., 2009; Wolff et al., 2012). In this study we focus on fractional anisotropy (FA), mean diffusivity (MD), radial (RD) and axial diffusivity (AD) to explain brain maturation and to gain a better understanding of white matter development. Driven by earlier findings that myelination follows a nonlinear spatio-temporal pattern (Dubois et al., 2008), our goal is to capture these changes in terms of the parameters of the Gompertz function which provides an intuitive parameterization representing delay, growth, and asymptotic values for each region.
In contrast to previous studies, we use an explicit growth function (the Gompertz function) and a nonlinear mixed effect modeling scheme (Pinheiro and Bates, 2000). In a nonlinear mixed effects model, the diffusion parameters are modeled in a hierarchical fashion, with fixed-effect representing the overall population trend, and random effect associated with each individual. Nonlinear mixed effect models are suited for longitudinal data where each subject has repeated scans with the possibility of missing data points and uneven spacing between scans of all the individuals in the group. Unlike most previous studies of early brain development, we make use of longitudinal imaging where each subject is imaged repeatedly over the first few years of life. This enables a more accurate characterization of developmental pattern (Giedd et al., 1999). Nonlinear mixed effect model provides a direct way of estimating individual trajectories along with longitudinally derived typical developmental curves as illustrated in Fig. 2. This leads to the characterization of a normative model for healthy developmental patterns and estimation of personalized, individual trajectories of growth, which is a property that will be desirable for comparison and diagnostic assessment of individual subjects.
Fig. 2.

Population growth models, represented as black curves, obtained using nonlinear least squares (NLS) in a cross-sectional fashion (left) and nonlinear mixed effect modeling (NLME) via longitudinal analysis (right). Colored points represent data observations, and colored curves represent the individual growth trajectories. Note that given the same data points, cross-sectional analysis provides a very different result than longitudinal analysis.
We apply our analysis framework to a set of white mater regions that are known to have different patterns of growth to establish normative developmental patterns for each region. Quantitative analysis of diffusion changes in these regions provide further insight into brain maturation process and will enable prediction of subject-specific growth trajectory with the potential of detecting pathological deviation related to brain disorders.
Materials and methods
Subjects
This study was approved by the Institutional Review Board of the University of North Carolina School of Medicine. Children analyzed in this study are controls in an ongoing longitudinal study of early brain development in high risk children (Geng et al., 2012). A total of 26 control subjects were selected for this study. Scans of these subjects were obtained at around two weeks, 1 year and 2 years. Four of the subjects had sub-optimal scans at 1 year that were removed, but their scans for other time points were kept. In total, we used 59 datasets, the temporal distribution of scan data is shown in Table 1. To ensure maximal success rate of scanning, all subjects were fed, swaddled and fitted with ear protection. All subjects were scanned without sedation during their natural sleep.
Table 1.
Distribution of scans across different time points. N indicates the number of subjects with the associated temporal pattern.
| Available scans | N |
|---|---|
| Neonate scan only | 2 |
| 1 year scan only | 0 |
| 2 year scan only | 0 |
| Neonate+1 year scan | 10 |
| Neonate+2 year scan | 2 |
| 1 year+2 year scan | 3 |
| Neonate+1 year+2 year scan | 9 |
Image acquisition and data processing
All images were acquired using a 3 T Allegra head-only MR system using a single shot echo-planar spin echo diffusion tensor imaging sequence with the following parameters: TR=5200 ms, TE=73 ms, slice thickness of 2 mm and in-plane resolution of 2×2 mm2. One image without diffusion gradients (b=0) along with 6 gradient directions with a b-value of 1000 mm3/s were acquired. The sequence was repeated 5 times for improved single-to-noise ratio. All DWIs were checked and corrected for motion artifacts using the DTIChecker tool.1 Tensor maps were calculated for each DTI scan using weighted least squares tensor estimation on the images that have been averaged over sequence repeats (Salvador et al., 2005). T2-weighted structural images were obtained using turbo spin echo sequence with TR=7 s, TE=15 and 90 ms, slice thickness of 1.95 mm and in-plane resolution of 1.25×1.25 mm2. T2W and baseline DWI of all the subjects' scans were skull stripped using Brain Extraction Tool (BET) (Smith, 2002).
Due to significant contrast changes in early brain development, we utilized two registration frameworks: one for intra-subject and inter-modality registration, and the other for inter-subject registration. For inter-subject registration, we applied the unbiased atlas building framework of Joshi et al. (2004) based on the Large Deformation Diffeomorphic Metric Mapping (LDDMM) (Miller et al., 2002) to the set of T2W images of scans at year 1 to obtain spatial mappings between all subjects through the estimated atlas coordinate system. Intra-subject registration was performed by IRTK software, using affine and nonlinear registration method of Rueckert et al. (1999) using normalized mutual information as the image match metric (Studholme et al., 1999) that appears robust to changing contrast properties in early brain development.2 All time points of each subject are registered to the unbiased atlas via linear and non-linear transformations, first by mapping these images to the year 1 scan and then cascading the two transformations for a mapping to the atlas. Details on the registration methods and parameters are summarized in Appendix A. The tensors are registered to the atlas using transformations obtained by registering the DTI baseline (B0) images to T2W images. Tensors are resampled using finite strain reorientation and Riemannian interpolation (Alexander et al., 2001; Fletcher and Joshi, 2007; Pennec et al., 2006). After all the images are transformed into the atlas space, the tensors are averaged using the log-Euclidean method to produce a tensor atlas (Arsigny et al., 2006). In this study, we extract the mean, axial, radial diffusivity, and fractional anisotropy features from the registered tensors, , AD=λ1, and where λi are the eigenvalues of the tensor sorted from largest to smallest. Fig. 1 shows an overview of our method and analysis workflow.
Fig. 1.

Overview of the proposed longitudinal DTI region based analysis.
Nonlinear mixed effects model
In this subsection, we describe the nonlinear mixed effects model used to analyze the longitudinal DTI data. Compared to a nonlinear least squares (NLS) method, a nonlinear mixed effects (NLME) model does not assume that the sample data points are independent and identically distributed, rather it assumes that there is correlation across repeated measurements. Also, the average trend estimated based on the mixed effect model is an average of individual trajectories rather than a least squares fit to the individual data points. This results in better representation of trajectories in the population as illustrated in Fig. 2.
Model formulation
In the mixed effects model, the observed data is a combination of fixed effects which are parameters associated with the entire population or a sub-population, and random effects which are parameters associated to an individual. In the nonlinear mixed effect models, some or all the parameters appear nonlinearly in the model. We use the NLME model proposed by Lindstrom and Bates (1990) where each individual's observation is modeled as:
| (1) |
where i indexes the individual subjects and j indexes the time points, M is the number of individuals, ni is the number of observations on the ith individual, f is a nonlinear function of the covariate vector (time) tij and parameter vector φij, and eij∼;N(0,σ2) is an i.i.d. error term. The parameter vector can vary among individuals by writing φi as
| (2) |
where β is a p-vector of fixed effects, and bi is a q-vector of random effects associated with individual i with variance-covariance ψ. Ai and Bi are identity matrices for our study.
The function f can be any nonlinear function. Since early brain development is characterized by rapid initial development which slows down in later years, it is preferable to use growth functions which reflect these properties. One such growth function is the Gompertz function which can be written as:
| (3) |
The effects of varying the three parameters asymptote, delay and speed of the Gompertz function are shown in Fig. 3, for a function that decreases as time progresses.
Fig. 3.
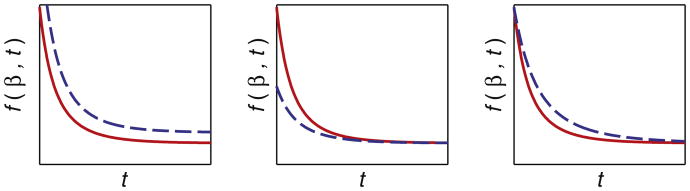
Effect of varying the three parameters of the Gompertz function. The red curve shows the reference curve where parameters are held fixed. Left to right: the dashed blue curves show the effect of increasing values of β1, β2, and β3 associated with asymptote, delay and speed, respectively.
To use the Gompertz function in the nonlinear mixed effect model, we apply the following formulation where the Gompertz function is parameterized as , where φ1 denotes asymptote, φ2 is delay, and φ3 is exp(−speed). Combining the nonlinear mixed effect model with the Gompertz function, each observation can be represented as follows:
| (4) |
where the mixed effects are φi=[φ1iφ2iφ3i]T=β+ bi, the fixed effects are β=[β1β2β3]T, and the random effects for each subject i are bi =[b1ib2i 0]T. We set one of the random effects to zero to reduce the number of random effects in the model. As we only have a maximum of three time points per subject, including an additional random effect may cause the matrix ψ to be rank-deficient (singular) and thus create problems in the estimation of the parameters.
Model estimation
Different methods have been proposed to estimate the parameters as shown in Eq. (4). Since random effects are unobserved quantities, we use the marginal density of responses y to obtain the parameters of the nonlinear mixed effects model. The following maximum likelihood estimation is performed to obtain the parameters of Eq. (4):
| (5) |
Due to nonlinearity presented in the random effects of function f, there is generally no closed form solution to the integral. Here, we use the estimation method proposed by Lindstrom and Bates (1990) using the nlme package (Pinheiro et al., 2012) in R3 to obtain the model parameters. This algorithm iterates between two steps: a penalized nonlinear least square step and a linear mixed effects step until convergence.
Inference and predictions
Under the linear mixed effects approximation, the distribution of maximum likelihood estimators β̂ of the fixed effect is:
| (6) |
where , and Δ is the precision factor such that ψ−1 = σ−2ΔTΔ (Pinheiro and Bates, 2000). Knowing fixed parameters β̂ and its sampling distribution, it is straightforward to conduct hypothesis testing among different regions or between healthy and/or at-risk populations. We can also obtain individual growth trajectories based on the estimated random effects for each individual. For example, the individual response for subject i is yi^ = f(β + bi, t), and the population growth trajectory is estimated when random effects are set to their mean value, 0, resulting in ŷ=f(β, t).
Regional analysis of longitudinal data using NLME
We use the nonlinear mixed effects to model the longitudinal DTI data within anatomical regions and perform hypothesis testing between trajectories of these regions. Maps of these anatomical regions were developed and disseminated by Mori et al. (2008), and mapped to our unbiased atlas via linear followed by nonlinear B-spline registration (Rueckert et al., 1999). We select 13 anatomical regions in the atlas space as shown in Fig. 4. In this study, left and right regions of anatomical locations are combined, giving a total of eight regions. Future studies on lateralization of growth differences will analyze left and right regions separately. The labeling of regions in the atlas space allows automatic partitioning of each subjects' scans into the different anatomical regions. We then estimate growth trajectories for these regions using the NLME model (Lindstrom and Bates, 1990) described previously. The mixed parameters are the asymptote φ1, delay φ2 and speed φ3 of the Gompertz function for each region, which requires a slight modification to Eq. (4) to account for regions:
Fig. 4.

White matter anatomical labels that are used for regional analysis. Labels are overlaid on the FA (Fractional Anisotropy) map of the reference space that is the population atlas.
| (7) |
We then conduct hypothesis testing between pairs of regions to determine modes of longitudinal changes in terms of the Gompertz growth parameters. With N number of regions, we perform pairwise fitting of nonlinear mixed effect modeling. The significant parameters are determined through t-tests, corrected for multiple comparisons by Bonferroni correction. The parameters that are found to be significant between two pairs of regions can be interpreted as the distinguishing feature between the longitudinal trajectories of these regions.
Results
We applied our framework to longitudinal pediatric DTI data of 26 subjects. In total, we selected 13 regions in the unbiased atlas as shown in Fig. 4. The regions are as follows: anterior limb of internal capsule (right and left; ALIC), posterior limb of internal capsule (right and left; PLIC), genu, body of corpus callosum (BCC), splenium (Sp), external capsule (right and left; ExCap), retrolenticular part of internal capsule (right and left; RLIC), and posterior thalamic radiation which includes optic radiation (right and left; PTR). The right and left of each anatomical region were combined giving a total of eight regions. Fig. 5 plots the average FA, MD, RD, and AD of each region for each subject. In all the regions, FA increases with age, whereas MD, RD and AD decrease with age. Interestingly, each region develops in a distinctly different temporal pattern.
Fig. 5.

Plots of diffusivity measures (FA, MD, AD and RD) versus age, shown for 26 control subjects and eight regions. Colors indicate different regions (purple: ALIC, light green: ExCap, brown: Genu, blue: PLIC, dark green: PTR, red: RLIC, yellow: Sp, orange: BCC), solid lines connect the mean of each region. In all the regions, FA increases with age, whereas MD, RD and AD decrease with age. Interestingly, each region develops in a distinctly different temporal pattern.
Paired t-tests of growth trajectories were performed for all combination of pairs of regions for all the diffusion parameters. The results of all pairwise comparisons can be found in Table 3 in Appendix B. Differences in parameters β1 and β2 were significant between most pairwise comparisons among diffusion parameters, whereas β3 was only significant in a few regions: genu, splenium, and body of corpus callosum, and mostly when considering the RD or MD measurements. Genu was the only structure that was significantly different than all the other regions in the β3 parameter of RD and MD. This region decreased in MD and RD at a slower rate compared to all the other regions. We didn't find any pattern that was consistent among different parameters and different measurements since each parameter measures a different aspect of growth. Interestingly, we noticed some pairwise comparisons with significant differences in β1 parameter between AD and RD trajectories, but no differences in MD (ALIC vs. PLIC, Genu vs. ExCap). This happens when reverse temporal patterns are seen for AD and RD, suggesting that analysis of AD and RD may reveal much better insight into maturation than MD alone.
In this section, we focus on PLIC/ALIC, body of corpus callosum (BCC), and splenium comparisons as examples of commissural and projection fibers. These regions are known to have a distinctive maturation pattern and axonal density. The PLIC is one of the structures that shows early myelination, while ALIC shows later maturation compared to PLIC as is shown in higher FA, and lower RD and MD. Fig. 6 shows the population and individual trajectories of FA, MD, RD and AD as modeled by Nonlinear Mixed Effect for ALIC/PLIC. As expected, the PLIC shows a higher FA compared to ALIC at birth mainly explained by lower RD. After about 800 days both regions have the same MD and similar FA and RD values. However, the ALIC shows a higher AD compared to PLIC, possibly indicating a different structuring of this tract region. The delay parameter of the Gompertz function β2 was significantly different between ALIC and PLIC for FA, MD, and RD measurements, an indication of later development of ALIC compared to PLIC. Also, the asymptote β1 was significantly different for FA, RD and AD.
Fig. 6.

Population and individual growth trajectories for PLIC and ALIC regions. Thicker curves illustrate the average growth trajectories, and individual trajectories are shown via the red and blue functions of individual subjects for ALIC and PLIC, respectively. Gompertz parameters with statistically significant differences are: , where * denotes p<0.05, ** denotes p<0.01 and where β1, β2 and β3 represent asymptote, delay and speed.
The body of the corpus callosum (BCC) and splenium (Sp) are known to have very limited myelination at birth but higher axonal density compared to ALIC and PLIC, and the splenium shows earlier myelination compared to BCC (Rutherford, 2002). Fig. 7 shows population and individual growth trajectories for the body of the corpus callosum and splenium. The splenium shows higher FA at birth and also throughout the first two years, while RD is about same at birth, but diverges at two years. Reverse patterns are seen for AD and RD at about two years, which causes MD to be about the same. All three parameters of the Gompertz function for RD were significantly different between BCC and Splenium, suggesting that RD may capture early maturation patterns more sensitively than the other measures. The asymptote parameter was significantly different among all the measurements between these two regions.
Fig. 7.

Population and individual growth trajectories for the body of the corpus callosum (BCC, blue) and the splenium (Sp, red). Thick curves are the average growth trajectories. Gompertz parameters with significant differences are: , where * denotes p<0.05, ** denotes p<0.01, and β1, β2 and β3 represent asymptote, delay and speed, respectively.
Fig. 8 shows FA, RD and AD of PLIC (shown in blue) compared to the other three regions ALIC, BCC, and Sp (shown in red). In this figure, solid lines are the average estimated growth trajectories for each region, the shaded regions are the 95% confidence interval of these average curves. Monte Carlo simulation was used to generate 1000 curves based on the approximate distribution of the maximum likelihood estimates of fixed effects. The 95% range of these curves are calculated pointwise to obtain the confidence interval. The dashed lines show the 95% predicted interval which is also calculated based on the Monte Carlo simulation of 1000 curves based on the approximate distribution of both fixed effects and random effects.
Fig. 8.

PLIC (blue) compared to three other regions. Left column: ALIC (red), middle column splenium (red) and right column BCC (red). Solid curves are the estimated growth trajectories, the 95% confidence interval of the curves are shown as shaded regions. The dashed lines show the 95% predicted intervals for each region. Gompertz parameters with statistically significant differences are the following: ALIC vs. PLIC: .PLIC vs. Sp: . PLIC vs. BCC: , where * denotes p<0.05, ** denotes p<0.01 and where β1, β2 and β3 represent asymptote, delay and speed, respectively.
The splenium shows a high RD at birth relative to PLIC, by about 800 days however, both regions have approximately the same RD value as shown in Fig. 8. The splenium has very limited myelination at birth, while the PLIC is known to have a higher level of myelination at this time of development. These facts are evident in the difference in RD at birth between splenium and PLIC. At age two, however, the splenium shows approximately the same RD value, indicating that it catches up with PLIC.
The values of Gompertz parameters for all the regions and all diffusivity measures are shown in Fig. 9. Each region shows a distinct pattern of development as is depicted by the β1, β2, and β3 parameters of Gompertz function. As indicated in the section ‘Model formulation’ the parameters β1, β2, and β3 represent asymptote, delay and speed, respectively. When β1:RA >RB, the expected value of diffusion parameters for region A is higher than region B at year 2. When β2:|RA|>|RB|, region RB matures earlier compared to RA. The scenario β3:RA>RB indicates accelerated growth for RB compared to RA. Note that the delay parameter is negative for RD, AD and MD measurements as these values decrease during early brain development, where as the delay parameter is positive for FA as fractional anisotropy increases during this time period.
Fig. 9.

Gompertz parameters RD, AD, MD and FA, from top to bottom. Left to right: β1 is the asymptote parameter of the Gompertz function (blue), β2 is the delay parameter (green), and β3 is related to the speed (purple). The delay parameter is negative for RD, AD, and RD as the estimated model represents a decreasing Gompertz function, whereas the FA delay parameters are positive since FA values increase during development. When β1:RA>RB, the expected value of diffusion parameters for region A is higher than region B at year 2. When β2:|RA|>|RB|, region RB matures earlier compared to RA. β3:RA>RB indicates accelerated growth for RB compared to RA.
Discussion
Assessment of brain growth patterns in these regions reveals a nonlinear pattern of maturation with considerable regional variation as shown in previous studies (Hermoye et al., 2006; Mukherjee et al., 2001; Schneider et al., 2004). In agreement with previous studies, increased FA and decreased MD, AD, RD were observed within all the white matter regions during this period (Forbes et al., 2002; Mukherjee et al., 2001; Schneider et al., 2004; Zhang et al., 2005). This longitudinal pediatric study supports a rapid change during the first 12 month followed by slower maturation during the second year similar to previous studies (Geng et al., 2012; Hermoye et al., 2006). Our study, in addition to supporting earlier cross-sectional reports on negative correlation between age and diffusion parameters, provides greater statistical power to examine nonlinear pattern of maturation in various white matter regions.
Beyond the analysis of FA and MD measurements, in this study we included RD and AD analysis of these white matter regions. The regional comparisons of white matter regions indicates that individual AD and RD carry important information which may not be found in the MD diffusivity measures. The relationship of AD/RD and FA is complex and nonlinear, but our data suggest that modeling FA, AD, RD as time trajectories provides more information than only FA as illustrated in Figs. 6 and 7.
For example, FA of splenium and PLIC are approximately the same values at birth, yet we know that the splenium is not myelinated at birth, and we see the significant differences of RD between these regions. The high FA value of the splenium at birth may be due to its high density of axons. This discussion of FA for PLIC and splenium clearly reflects that FA is not necessarily a good indicator for the degree of myelination and may be greatly influenced by axonal density particular to this developmental interval (LaMantia and Rakic, 1990). In contrast, the similarity of FA trajectories for PLIC and splenium, for which we see very different AD and RD patterns and thus different tensor shapes, illustrates that interpretation of FA with respect to myelination and structural integrity is difficult, and that the additional AD and RD measures provide richer information.
Modeling the nonlinear growth changes of white matter by the Gompertz function and inclusion of AD and RD to the analysis provides a more detailed and comprehensive picture of the changes within these white matter regions. Compared to previous studies of linear fitting with logarithm of age (Chen et al., 2011; Faria et al., 2010; Lobel et al., 2009) we fit the nonlinear growth curves (Gompertz function) to the diffusion data and actual age, this enables the parameterization of the trajectories in terms of asymptote, delay and speed and models nonlinear temporal changes with improved accuracy. Based on our finding, the delay parameter of the Gompertz function, β2 of RD seems to be closest related to myelination process if we compare results to what is known from the literature. Looking at RD and β2 delay parameter of the Gompertz function as is shown in Fig. 9, we see a good correspondence with previous radiology findings, suchas in Rutherford (2002). In fact, RD has been considered to be in correspondence with histological changes in demyelination (Song et al., 2002). Table 2 compares our findings versus existing knowledge from radiology literature, which indicates development of PLIC prior to ALIC, and splenium prior to genu which is also consistent with previous histological findings (Brody et al., 1987; Kinney et al., 1988).
Table 2.
Relative order of appearance of myelin from term to 2 years.
| Distribution of myelin as seen in T1W and T2W by Rutherforld | Estimated based on RD delay parameter β2 |
|---|---|
| PLIC and optic radiation | PLIC, PTR and ExCap |
| ALIC | ALIC and BCC |
| Not available | RLIC |
| Splenium | Splenium |
| Genu | Genu |
Our framework is designed not only to provide qualitative comparisons, but to give researchers and clinicians quantitative parameters and a statistical testing scheme. Moreover, the method includes modeling of growth trajectories of individuals, resulting in personalized profiles. This property will be crucial for efforts to improve prediction and diagnosis for individuals, as well as partitioning groups of subjects according to subtypes and subtle variations in early developmental trajectories. Models which assume invariance or linearity between neurobehavioral markers are apt to miss crucial shifts in development (Shaw et al., 2006; Thomas et al., 2009). The ability of the present framework to capture the dynamic properties of inter- and intra-individual development has the potential to substantially improve clinical applications of developmental neuroimaging.
There are some limitations to our proposed framework. Our analysis depends on accurate image registration among all the subjects and time points. Early brain development is characterized by a rapid change of contrast and size of the brain, which makes registration a challenging task. However, in this study we decided to use ROI defined regions which we expect to be more robust to misregistration compared to voxel-based analysis, and these regions are located more interiorly where we expect less registration problems. Nonetheless, improved spatial registration will potentially improve the accuracy of the model. Another limitation is that the statistical analysis is based on the log-likelihood of nonlinear mixed effects modeling, which does not have a closed form solution. We have used a linear mixed effect approximation, so greater care should be taken when doing hypothesis testing with the estimated parameters.
In the future, we plan to extend our method to tract-based regions with modeling along the tract changes. We also plan to extend the model to multivariate growth function similar to (Xu et al., 2008) and include a much larger set of regions for analysis.
Conclusions
We have presented a framework for the processing of longitudinal images in order to characterize longitudinal development of white matter regions at both the individual and group level. By utilizing nonlinear mixed effects modeling, we jointly estimate the population trajectory along with each individual trajectories. Gompertz parameterization of diffusion changes provides an intuitive parameterization of growth trajectory in terms of asymptote, delay and speed. This provides a description of longitudinal changes with potential for detecting deviations from a typical growth trajectory sensitive to multiple neurodevelopmental phenomena. We have also presented a method for making inference about regional differences in diffusion properties known to vary by microstructural properties and developmental course (Dubois et al., 2008; Kinney et al., 1988; LaMantia and Rakic, 1990; Lebel and Beaulieu, 2011). This is in contrast to standard modeling and analysis of testing for group or regional differences as it reveals the type, timing, and nature of differences. The proposed analysis can be extended to an arbitrary number of regions, and applied to other measurement such as structural MRI.
As discussed in the previous section, the present study clearly illustrate that studying FA alone as an indicator of white matter maturation or integrity insufficiently characterizes structural properties of white matter and may produce misleading results as regions with very different axonal density and differing degrees of myelination may show similar FA values. We suggest that in addition to FA, studies should include statistical analysis of AD and RD, which provide important additional information to better explain FA measures. In regard to early maturation, we demonstrate that the radial diffusivity (RD) measure and the delay parameter β2 of the Gompertz function seem to be the best combination to describe early brain maturation. We will further explore this in applying our framework to DTI of infants with developmental delay and myelination storage disorders such as Krabbe's disease.
Acknowledgments
Supported by NIH grants: R01 MH070890 (JHG, GG), Conte Center MH064065 (JHG, GG), National Alliance for Medical Image Computing (NA-MIC) U54 EB005149 (GG) and the Utah Science Technology and Research (USTAR) initiative at the University of Utah.
Appendix A.
Summary of registration parameters
Intra-subject and inter-modality registration
We use the IRTK software (Rueckert et al., 1999) to perform intra-subject and inter-modality registration. The registration method is a multi-scale approach using B-spline transformation, where we use the normalized mutual information image match metric. We use three different scales and discretize the image intensity histograms into 64 bins. In this study, the B-spline transforms are parametrized using 14×14×14 control points.
Inter-subject registration
We construct an unbiased atlas (Joshi et al., 2004) and the associated inter-subject registration using the Large Deformation Diffeomorphic Metric Mapping (LDDMM) (Miller et al., 2002) that minimizes the following objective function:
| (8) |
where Ī is the image atlas, Ii is the image of subject i, φi is the mapping relating subject i to the atlas that is parametrized using the velocity vi. Regularity of the mapping φ is enforced by minimizing
| (9) |
where L is the Navier–Stokes operator. In this study, we use α=.01, β=.01, γ=.001, and σ=1.
Appendix B.
Summary of p-values of pairwise comparisons
Table 3 provides the result of pairwise testing of all white matter regions and all the diffusivity measurements.
Table 3.
Results of pairwise testing of all white matter regions and all diffusivity measures. Gompertz parameters with significant differences are denoted by * for p<.05 and ** for p<.01. Non significant parameters are indicated by “ns”.
| Alic | Plic | Genu | BCC | Sp | ExCap | Rlic | PTR | |||||||||
|---|---|---|---|---|---|---|---|---|---|---|---|---|---|---|---|---|
| Alic | FA |
|
|
|
|
|
ns |
|
||||||||
| MD | NA |
|
|
|
|
|
|
|
||||||||
| RD |
|
|
|
|
|
|
|
|||||||||
| AD |
|
ns | ns |
|
|
|
|
|||||||||
| Plic | FA |
|
|
|
|
|
|
ns | ||||||||
| MD |
|
NA |
|
|
|
|
|
|
||||||||
| RD |
|
|
|
|
|
|
|
|||||||||
| AD |
|
|
ns |
|
|
|
ns | |||||||||
| Genu | FA |
|
|
|
|
|
|
|
||||||||
| MD |
|
|
NA |
|
|
|
|
|
||||||||
| RD |
|
|
|
|
|
|
|
|||||||||
| AD | ns |
|
ns |
|
|
|
ns | |||||||||
| BCC | FA |
|
|
|
|
|
|
|
||||||||
| MD |
|
|
|
NA |
|
|
ns |
|
||||||||
| RD |
|
|
|
|
|
|
|
|||||||||
| AD | ns | ns | ns |
|
|
ns | ns | |||||||||
| Sp | FA |
|
|
|
|
|
|
|
||||||||
| MD |
|
|
|
|
NA |
|
|
|
||||||||
| RD |
|
|
|
|
|
|
|
|||||||||
| AD |
|
|
|
|
|
ns | ns | |||||||||
| ExCap | FA |
|
|
|
|
|
|
|
||||||||
| MD |
|
|
|
|
|
NA |
|
|
||||||||
| RD |
|
|
|
|
|
|
|
|||||||||
| AD |
|
|
|
|
|
|
|
|||||||||
| Rlic | FA | ns |
|
|
|
|
|
|
||||||||
| MD |
|
|
|
ns |
|
|
NA |
|
||||||||
| RD |
|
|
|
|
|
|
|
|||||||||
| AD |
|
|
|
ns | ns |
|
|
|||||||||
| PTR | FA |
|
ns |
|
|
|
|
|
||||||||
| MD |
|
|
|
|
|
|
|
NA | ||||||||
| RD |
|
|
|
|
|
|
|
|||||||||
| AD |
|
ns | ns | ns | ns |
|
|
|
Footnotes
References
- Alexander D, Pierpaoli C, Basser P, Gee J. Spatial transformations of diffusion tensor magnetic resonance images. IEEE Trans Med Imaging. 2001 Nov;20(11):1131–1139. doi: 10.1109/42.963816. [DOI] [PubMed] [Google Scholar]
- Als H, Duffy F, McAnulty G, Rivkin M, Vajapeyam S, Mulkern R, Warfield S, Huppi P, Butler S, Conneman N, Fischer C, Eichenwald E. Early experience alters brain function and structure. Pediatrics. 2004 Apr;113(4):846–857. doi: 10.1542/peds.113.4.846. [DOI] [PubMed] [Google Scholar]
- Arsigny V, Commowick O, Pennec X, Ayache N. A log-Euclidean framework for statistics on diffeomorphisms. Med Image Comput Comput Assist Interv. 2006;9(Pt 1):924–931. doi: 10.1007/11866565_113. [DOI] [PubMed] [Google Scholar]
- Brody B, HC K, AS K, HG F. Sequence of central nervous system myelination in human infancy. I. An autopsy study of myelination. J Neuropathol Exp Neurol. 1987 May;46:283–301. doi: 10.1097/00005072-198705000-00005. [DOI] [PubMed] [Google Scholar]
- Casey BJ, Tottenham N, Liston C, Durston S. Imaging the developing brain: what have we learned about cognitive development? Trends Cogn Sci (Regul Ed) 2005 Mar;9(3):104–110. doi: 10.1016/j.tics.2005.01.011. [DOI] [PubMed] [Google Scholar]
- Chen Y, An H, Zhu H, Jewells V, Armao D, Shen D, Gilmore JH, Lin W. Longitudinal regression analysis of spatial–temporal growth patterns of geometrical diffusion measures in early postnatal brain development with diffusion tensor imaging. NeuroImage. 2011 Oct;58(4):993–1005. doi: 10.1016/j.neuroimage.2011.07.006. [DOI] [PMC free article] [PubMed] [Google Scholar]
- Diggle P, Heagerty P, Liang K, Zeger S. Analysis of Longitudinal Data. second. Oxford University Press; New York: 2002. [Google Scholar]
- Dubois J, Hertz-Pannier L, Dehaene-Lambertz G, Cointepas Y, Le Bihan D. Assessment of the early organization and maturation of infants' cerebral white matter fiber bundles: a feasibility study using quantitative diffusion tensor imaging and tractography. NeuroImage. 2006 May;30:1121–1132. doi: 10.1016/j.neuroimage.2005.11.022. [DOI] [PubMed] [Google Scholar]
- Dubois J, Dehaene-Lambertz G, Perrin M, Mangin J, Cointepas Y, Duchesnay E, Le Bihan D, Hertz-Pannier L. Asynchrony of the early maturation of white matter bundles in healthy infants: quantitative landmarks revealed noninvasively by diffusion tensor imaging. Hum Brain Mapp. 2008 Jan;29:14–27. doi: 10.1002/hbm.20363. [DOI] [PMC free article] [PubMed] [Google Scholar]
- Faria A, Zhang J, Oishi K, Li X, Jiang H, Akhter K, Hermoye L, Lee SK, Hoon A, Stashinko E, Miller MI, van Zijl PC, Mori S. Atlas-based analysis of neurodevelopment from infancy to adulthood using diffusion tensor imaging and applications for automated abnormality detection. NeuroImage. 2010 Aug;52:415–428. doi: 10.1016/j.neuroimage.2010.04.238. [DOI] [PMC free article] [PubMed] [Google Scholar]
- Fletcher P, Joshi S. Riemannian geometry for the statistical analysis of diffusion tensor data. Signal Process. 2007;87:250–262. [Google Scholar]
- Forbes KP, Pipe JG, Bird CR. Changes in brain water diffusion during the 1st year of life. Radiology. 2002 Feb;222(2):405–409. doi: 10.1148/radiol.2222010179. [DOI] [PubMed] [Google Scholar]
- Gao W, Lin W, Chen Y, Gerig G, Smith J, Jewells V, Gilmore J. Temporal and spatial development of axonal maturation and myelination of white matter in the developing brain. AJNR Am J Neuroradiol. 2009 Feb;30:290–296. doi: 10.3174/ajnr.A1363. [DOI] [PMC free article] [PubMed] [Google Scholar]
- Geng X, Gouttard S, Sharma A, Gu H, Styner M, Lin W, Gerig G, Gilmore JH. Quantitative tract-based white matter development from birth to age 2 years. NeuroImage. 2012 Jul;61:542–557. doi: 10.1016/j.neuroimage.2012.03.057. [DOI] [PMC free article] [PubMed] [Google Scholar]
- Giedd JN, Blumenthal J, Jeffries NO, Castellanos FX, Liu H, Zijdenbos A, Paus T, Evans AC, Rapoport JL. Brain development during childhood and adolescence: a longitudinal MRI study. Nat Neurosci. 1999 Oct;2:861–863. doi: 10.1038/13158. [DOI] [PubMed] [Google Scholar]
- Gilmore J, Kang C, Evans D, Wolfe H, Smith J, Lieberman J, Lin W, Hamer R, Styner M, Gerig G. Prenatal and neonatal brain structure and white matter maturation in children at high risk for schizophrenia. Am J Psychiatry. 2010 Sep;167(9):1083–1091. doi: 10.1176/appi.ajp.2010.09101492. [DOI] [PMC free article] [PubMed] [Google Scholar]
- Gogtay N, Giedd JN, Lusk L, Hayashi KM, Greenstein D, Vaituzis AC, Nugent TF, Herman DH, Clasen LS, Toga AW, Rapoport JL, Thompson PM. Dynamic mapping of human cortical development during childhood through early adulthood. Proc Natl Acad Sci U S A. 2004 May;101:8174–8179. doi: 10.1073/pnas.0402680101. [DOI] [PMC free article] [PubMed] [Google Scholar]
- Hermoye L, Saint-Martin C, Cosnard G, Lee SK, Kim J, Nassogne MC, Menten R, Clapuyt P, Donohue PK, Hua K, Wakana S, Jiang H, van Zijl PC, Mori S. Pediatric diffusion tensor imaging: normal database and observation of the white matter maturation in early childhood. NeuroImage. 2006 Jan;29(2):493–504. doi: 10.1016/j.neuroimage.2005.08.017. [DOI] [PubMed] [Google Scholar]
- Huppi P. Neuroimaging of brain development—discovering the origins of neuropsychiatric disorders? Pediatr Res. 2008 Oct;64:325. doi: 10.1203/PDR.0b013e31818981ea. [DOI] [PubMed] [Google Scholar]
- Huppi P, Maier S, Peled S, Zientara G, Barnes P, Jolesz F, Volpe JJ. Micro-structural development of human newborn cerebral white matter assessed in vivo by diffusion tensor magnetic resonance imaging. Pediatr Res. 1998 Oct;44(4):584–590. doi: 10.1203/00006450-199810000-00019. [DOI] [PubMed] [Google Scholar]
- Joshi S, Davis B, Jomier M, Gerig G. Unbiased diffeomorphic atlas construction for computational anatomy. NeuroImage. 2004;23:S151–S160. doi: 10.1016/j.neuroimage.2004.07.068. [DOI] [PubMed] [Google Scholar]
- Karmiloff-Smith A. Neuroimaging of the developing brain: taking “developing” seriously. Hum Brain Mapp. 2010 Jun;31(6):934–941. doi: 10.1002/hbm.21074. [DOI] [PMC free article] [PubMed] [Google Scholar]
- Kinney H, Brody B, Kloman A, Gilles F. Sequence of central nervous system myelination in human infancy. II. Patterns of myelination in autopsied infants. J Neuropathol Exp Neurol. 1988 May;47(3):217–234. doi: 10.1097/00005072-198805000-00003. [DOI] [PubMed] [Google Scholar]
- Knickmeyer R, Gouttard S, Kang C, Evans D, Wilber K, Smith J, Hamer R, Lin W, Gerig G, Gilmore J. A structural MRI study of human brain development from birth to 2 years. J Neurosci. 2008 Nov;28:12176–12182. doi: 10.1523/JNEUROSCI.3479-08.2008. [DOI] [PMC free article] [PubMed] [Google Scholar]
- LaMantia A, Rakic P. Axon overproduction and elimination in the corpus callosum of the developing rhesus monkey. J Neurosci. 1990 Jul;10(7):2156–2175. doi: 10.1523/JNEUROSCI.10-07-02156.1990. [DOI] [PMC free article] [PubMed] [Google Scholar]
- Lebel C, Beaulieu C. Longitudinal development of human brain wiring continues from childhood into adulthood. J Neurosci. 2011 Jul;31(30):10937–10947. doi: 10.1523/JNEUROSCI.5302-10.2011. [DOI] [PMC free article] [PubMed] [Google Scholar]
- Lindstrom M, Bates D. Nonlinear mixed effects models for repeated measures data. Biometrics. 1990 Sep;46:673–687. [PubMed] [Google Scholar]
- Lobel U, Sedlacik J, Gullmar D, Kaiser WA, Reichenbach JR, Mentzel HJ. Diffusion tensor imaging: the normal evolution of ADC, RA, FA, and eigenvalues studied in multiple anatomical regions of the brain. Neuroradiology. 2009 Apr;51(4):253–263. doi: 10.1007/s00234-008-0488-1. [DOI] [PubMed] [Google Scholar]
- Marsh R, Gerber A, Peterson B. Neuroimaging studies of normal brain development and their relevance for understanding childhood neuropsychiatric disorders. J Am Acad Child Adolesc Psychiatry. 2008 Nov;47(11):1233–1251. doi: 10.1097/CHI.0b013e318185e703. [DOI] [PMC free article] [PubMed] [Google Scholar]
- Ment L, Hirtz D, Huppi P. Imaging biomarkers of outcome in the developing preterm brain. Lancet Neurol. 2009 Nov;8(11):1042–1055. doi: 10.1016/S1474-4422(09)70257-1. [DOI] [PubMed] [Google Scholar]
- Miller M, Trouve A, Younes L. On the metrics and Euler-Lagrange equations of computational anatomy. Annu Rev Biomed Eng. 2002;4:375–405. doi: 10.1146/annurev.bioeng.4.092101.125733. [DOI] [PubMed] [Google Scholar]
- Mori S, Oishi K, Jiang H, Jiang L, Li X, Akhter K, Hua K, Faria A, Mahmood A, Woods R, Toga A, Pike G, Neto P, Evans A, Zhang J, Huang H, Miller M, van Zijl P, Mazziotta J. Stereotaxic white matter atlas based on diffusion tensor imaging in an ICBM template. NeuroImage. 2008 Apr;40:570–582. doi: 10.1016/j.neuroimage.2007.12.035. [DOI] [PMC free article] [PubMed] [Google Scholar]
- Mukherjee P, Miller J, Shimony J, Conturo T, Lee B, Almli C, McKinstry R. Normal brain maturation during childhood: developmental trends characterized with diffusion-tensor MR imaging. Radiology. 2001 Nov;221(2):349–358. doi: 10.1148/radiol.2212001702. [DOI] [PubMed] [Google Scholar]
- Mukherjee P, Miller J, Shimony J, Philip J, Nehra D, Snyder A, Conturo T, Neil J, McKinstry R. Diffusion-tensor MR imaging of gray and white matter development during normal human brain maturation. AJNR Am J Neuroradiol. 2002 Oct;23(9):1445–1456. [PMC free article] [PubMed] [Google Scholar]
- Neil J, Shiran S, McKinstry R, Schefft G, Snyder A, Almli C, Akbudak E, Aronovitz J, Miller J, Lee B, Conturo T. Normal brain in human newborns: apparent diffusion coefficient and diffusion anisotropy measured by using diffusion tensor MR imaging. Radiology. 1998 Oct;209(1):57–66. doi: 10.1148/radiology.209.1.9769812. [DOI] [PubMed] [Google Scholar]
- Pennec X, Fillard P, Ayache N. A Riemannian framework for tensor computing. Int J Comput Vis. 2006 Jan;66(1):41–66. [Google Scholar]
- Pinheiro J, Bates D. Mixed-Effects Models in S and S-Plus. Springer; 2000. [Google Scholar]
- Pinheiro J, Bates D, DebRoy S, Sarkar D R Core Team. nlme: linear and nonlinear mixed effects models. R package version. 2012:31–104. [Google Scholar]
- Rueckert D, Sonoda L, Hayes C, Hill D, Leach M, Hawkes D. Nonrigid registration using free-form deformations: application to breast MR images. IEEE Trans Med Imaging. 1999 Aug;18(8):712–721. doi: 10.1109/42.796284. [DOI] [PubMed] [Google Scholar]
- Rutherford M, editor. MRI of the Neonatal Brain. WB Saunders; 2002. [Google Scholar]
- Sadeghi N, Prastawa M, Gilmore J, Lin W, Gerig G. Spatio-temporal analysis of early brain development. Proceedings IEEE Asilomar Conference on Signals, Systems and Computers. 2010:777–781. doi: 10.1109/ACSSC.2010.5757670. [DOI] [PMC free article] [PubMed] [Google Scholar]
- Sadeghi N, Prastawa M, Fletcher P, Gilmore J, Lin W, Gerig G. Statistical growth modeling of longitudinal DT-MRI for regional characterization of early brain development. Proceedings of IEEE ISBI. 2012:1510. doi: 10.1109/isbi.2012.6235858. [DOI] [PMC free article] [PubMed] [Google Scholar]
- Salvador R, Pena A, Menon D, Carpenter T, Pickard J, Bullmore E. Formal characterization and extension of the linearized diffusion tensor model. Hum Brain Mapp. 2005 Feb;24(2):144–155. doi: 10.1002/hbm.20076. [DOI] [PMC free article] [PubMed] [Google Scholar]
- Schneider JF, Il'yasov KA, Hennig J, Martin E. Fast quantitative diffusion-tensor imaging of cerebral white matter from the neonatal period to adolescence. Neuroradiology. 2004 Apr;46(4):258–266. doi: 10.1007/s00234-003-1154-2. [DOI] [PubMed] [Google Scholar]
- Shaw P, Greenstein D, Lerch J, Clasen L, Lenroot R, Gogtay N, Evans A, Rapoport J, Giedd J. Intellectual ability and cortical development in children and adolescents. Nature. 2006 Mar;440(7084):676–679. doi: 10.1038/nature04513. [DOI] [PubMed] [Google Scholar]
- Smith SM. Fast robust automated brain extraction. Hum Brain Mapp. 2002 Nov;17(3):143–155. doi: 10.1002/hbm.10062. [DOI] [PMC free article] [PubMed] [Google Scholar]
- Song S, Sun S, Ramsbottom M, Chang C, Russell J, Cross A. Dysmyelination revealed through MRI as increased radial (but unchanged axial) diffusion of water. NeuroImage. 2002 Nov;17(3):1429–1436. doi: 10.1006/nimg.2002.1267. [DOI] [PubMed] [Google Scholar]
- Studholme C, Hill D, Hawkes D, et al. An overlap invariant entropy measure of 3D medical image alignment. Pattern Recogn. 1999;32(1):71–86. [Google Scholar]
- Thomas M, Annaz D, Ansari D, Scerif G, Jarrold C, Karmiloff-Smith A. Using developmental trajectories to understand developmental disorders. J Speech Lang Hear Res. 2009 Apr;52(2):336–358. doi: 10.1044/1092-4388(2009/07-0144). [DOI] [PubMed] [Google Scholar]
- Wolff J, Gu H, Gerig G, Elison J, Styner M, Gouttard S, Botteron K, Dager S, Dawson G, Estes A, Evans A, Hazlett H, Kostopoulos P, McKinstry RC, Paterson S, Schultz R, Zwaigenbaum L, Piven J. Differences in white matter fiber tract development present from 6 to 24 months in infants with autism. Am J Psychiatry. 2012 Feb; doi: 10.1176/appi.ajp.2011.11091447. [DOI] [PMC free article] [PubMed] [Google Scholar]
- Xu S, Styner M, Gilmore J, Gerig G. Multivariate nonlinear mixed model to analyze longitudinal image data: MRI study of early brain development. MMBIA: IEEE Comp Soc. 2008 Jun:1–8. [Google Scholar]
- Xue H, Srinivasan L, Jiang S, Rutherford M, Edwards A, Rueckert D, Hajnal JV. Automatic cortical segmentation in the developing brain. IPMI. 2007:257–269. doi: 10.1007/978-3-540-73273-0_22. [DOI] [PubMed] [Google Scholar]
- Zhang L, Thomas KM, Davidson MC, Casey BJ, Heier LA, Ulug AM. MR quantitation of volume and diffusion changes in the developing brain. AJNR Am J Neuroradiol. 2005 Jan;26:45–49. [PMC free article] [PubMed] [Google Scholar]