

Abstract
Atypical fibroblast growth factors (FGF) 21 and 19 play a central role in energy metabolism through the mediation of Klotho coreceptor. Contradictory findings are available about the association of FGF21 and FGF19 with nonalcoholic fatty liver disease (NAFLD) in humans. We investigated the association of serum FGF21, FGF19 and liver Klotho coreceptor with non-alcoholic steatohepatitis (NASH) and fibrosis in children with NAFLD. Serum FGF21 and FGF19 were measured in 84 children with biopsy-proven NAFLD and 23 controls (CTRL). The hepatic expression of Klotho coreceptor was measured in 7 CTRL, 9 patients with NASH (NASH+) and 11 patients without NASH (NASH−). FGF21 and FGF19 showed a tendency to decrease from CTRL (median FGF21 = 196 pg/mL; median FGF19 = 201 pg/mL) to NASH− (FGF21 = 89 pg/mL; FGF19 = 81 pg/mL) to NASH+ patients (FGF21 = 54 pg/mL; FGF19 = 41 pg/mL) (p<0.001 for all comparisons) and were inversely associated with the probability of NASH and fibrosis in children with NAFLD. The hepatic expression of Klotho coreceptor was inversely associated with NASH (R2 = 0.87, p<0.0001) and directly associated with serum FGF21 (R2 = 0.57, p<0.0001) and FGF19 (R2 = 0.67, p<0.0001). In conclusion, serum FGF19 and FGF21 and hepatic Klotho expression are inversely associated with hepatic damage in children with NAFLD and these findings may have important implications for understanding the mechanisms of NAFLD progression.
Introduction
The prevalence of non-alcoholic fatty liver disease (NAFLD), which is considered the hepatic manifestation of the metabolic syndrome (MS), is rapidly increasing worldwide [1]. NAFLD ranges from simple liver steatosis to nonalcoholic steatohepatitis (NASH), which is a predictor of fibrosis and end-stage liver disease [2]. Although obesity and selected components of the MS are known risk factors for NALFD [3], the mechanisms by which these factors produce the large spectrum of disease typical of NAFLD are largely unknown [4], [5].
In this respect, it is very interesting that fibroblast growth-factor 21 (FGF21), an autophagy-regulated mitokine, has been shown to play a central role in the maintenance of glucose and lipid homeostasis [6]. Autophagy-deficient mice have up-regulated FGF-21 levels, increased beta-oxidation in muscle and adipose tissue, reduced fat mass, heightened insulin sensitivity, and they are spared from diet-induced obesity and hepatosteatosis. This evidence suggests that FGF21 and its networked molecular environment is a supervisor of lipid accumulation in adipose tissue and other peripheral organs such as the liver [7].
FGF21 belongs to the family of atypical FGFs, which include FGF15 and FGF19 (mouse and human orthologs, respectively) and FGF23 (which lacks the conventional FGF heparin-binding domain). Under specific conditions, FGFs can be released into the circulation and act as paracrine and endocrine factors [8]. The binding of FGF family members to their specific receptors (FGFRs) activate signaling cascades that participate to the control of cell-to-cell communication, regulation of development, and cellular homeostasis [9]. The stability of FGF binding to FGFRs with consequent intracellular signaling require single-pass transmembrane proteins called Klotho and β-Klotho coreceptors. The tissue-specific expression of Klotho and β-Klotho determines the target organs of the atypical FGFs [10]. Although the cellular origin of FGF21 and FGF19 and the regulation of their expression are not well understood, FGF19 is known to be expressed in the intestine and plays important roles in regulating bile acid synthesis, phosphate homeostasis and enterohepatic signaling [11], [12]. FGF21 is expressed in liver, pancreas, skeletal muscle and adipose tissue and it is a crucial regulator of glucose and lipid homeostasis [18], [19]. Interestingly, administration of either FGF21 or FGF19 has beneficial effects on lipid metabolism and improves hepatic steatosis in animal models with diet-induced obesity [13]–[15].
A cross-sectional study performed in adults with abnormal glucose metabolism showed a direct association of serum FGF21 with liver fat measured by magnetic resonance spectroscopy [16]. However, lower serum FGF21 levels were found in patients with severe hepatosteatosis and it was speculated that this might due to associated lipotoxicity- and necro-inflammation [16]. More recently, lower serum levels of FGF19 were reported in adult NAFLD independently of the severity of liver damage [17].
Despite many experimental findings suggest that FGF21 and FGF19 are promising anti-hepatosteatotic agents, much remains to be known about their association with liver disease in humans [18]. Therefore, the aim of the present cross-sectional study was to explore the FGFs/Klotho-NAFLD severity association in a series of children with NAFLD followed at a pediatric Hepatology Center.
Subjects and Methods
Study Design
Eighty-four children (32 F and 52 M) with biopsy-proven NAFLD and 23 controls (CTRL, 9 F and 14 M) without evidence of fatty liver at ultrasonography were consecutively enrolled into the study at the Hepatology Unit of the Bambino Gesù Children’s Hospital between May 2010 and December 2011. Inclusion criteria were: 1) complete abstinence from alcohol, 2) absence of serological markers of hepatitis B and C, 3) absence of drugs known to induce fatty liver and, 4) ceruloplasmin, anti-transglutaminase antibodies, antinuclear antibodies, anti-mitochondrial antibodies and anti-smooth muscle antibodies within normal limits. The study protocol was approved by the Ethical Committee of the Bambino Gesù Children’s Hospital and written informed consent was obtained from the parents of the children.
Anthropometry
Weight and height were measured using standard procedures [19]. Body mass index (BMI) was calculated as weight (kg)/height (m)2 and transformed into standard deviations scores (SDS) using Italian reference values [20].
Laboratory Measurements
Alanine transaminase (ALT), aspartate transaminase (AST), gamma-glutamyl-transferase (GGT), glucose, triglycerides and cholesterol were measured by standard laboratory methods. All measurements were performed at 7∶00 AM after an overnight fasting. For FGF21 and FGF19 measurements, the blood centrifuged at 8000 RPM for 12 min. and stored at −80°C pending further analysis. Samples were thawed only once and measured using ELISA (BioVendor, Modřice, Czech Republic).
Liver Histopathology
Liver biopsy was performed as described in detail elsewhere [21]. Bioptic specimens were fixed in 10% buffered formalin pending further analysis. NAFLD was diagnosed and staged using the NAFLD Clinical Research Network criteria [22]. All bioptic samples were examined by the same experienced pathologist.
Immunofluorescence
Liver tissue from 9 NASH+, 11 NASH− patients, and 7 controls (CTRL) were used to perform immunofluorescent staining for Klotho coreceptor, alpha-smooth muscle actin (alpha-SMA), cytokeratin 8/18 (CK8/CK18) and CD163. CTRL patients were not related to the present study but had undergone a liver biopsy showing no liver steatosis during surgical treatment for acute appendicitis. OCT-embedded liver tissue was sectioned with a cryostat (5 µm) and fixed in ice-cold acetone. Tissue slides were then blocked in 5% BSA for 1 hr and incubated with: 1∶400 anti-Klotho rabbit polyclonal antibody (Alpha Diagnostic International, San Antonio, TX, USA) overnight at 4°C; 1∶200 anti-CD163 mouse monoclonal antibody (Novocastra, New Castle, UK) overnight at 4°C; 1∶100 anti-CK8/CK18 mouse monoclonal antibody (Vector Laboratories Inc., California, USA) for 1 hr at room temperature; 1∶200 anti-alpha-SMA mouse monoclonal antibody (Novus Biological, Littleton, CO, USA) 1 hr at room temperature.
Detection of the primary antibodies was performed using 1∶500 Alexa Fluor 488 goat anti-rabbit IgG and Alexa Fluor 555 goat anti-mouse IgG secondary antibodies (Invitrogen/Molecular Probes Corp, Carlsbad, CA USA) for 1 hr at room temperature. For nuclear staining, 4′,6-diamidino-2-phenylindole was added for 5 min. before section mounting with glycerol/PBS (1/1). Confocal imaging was performed using an Olympus Fluoview FV1000 confocal microscope equipped with FV10-ASW 2.0 software, Multi Ar (458–488 and 515 nm), 2× He/Ne (543 and 633 nm), 405-nm diode lasers and a 60× (numerical aperture 1.42) oil objective. Optical sections were acquired with a resolution of 1024×1024 pixels, a sampling speed of 40 µs/pixel, and 12 bits/pixel images. Fluorochrome unmixing was performed by automated-sequential collection of multi-channel images to reduce spectral cross-talk between channels. Negative control was performed omitting primary antibodies (see Figure S1). As positive control Klotho was stained on gut and kidney samples (see Figure S2).
For quantification of Klotho coreceptor hepatic expression of the free area from single section profile was manually used to draw the region of interest (ROI). The fluorescence intensity was measured by Olympus FVIO-ASW 2.0 software from at least 50 ROI taken from three randomly selected images from each sample. The average fluorescence intensity was calculated using Excel (Microsoft, US).
Statistical Analysis
Most continuous variables were not normally distributed and all are reported as 50th, 25th and 75th percentiles. Categorical variables are reported as numbers and percentages. Between-group comparisons of medians were performed using quantile regression [23]. When more than two groups were involved in between-group comparisons, Bonferroni’s correction was employed. Logistic regression was used to evaluate whether FGF21 (continuous, pg/mL) and FGF19 (continuous, pg/mL) were associated with NASH (0 = no; 1 = yes) and with any degree of fibrosis (discrete, 0 = no; 1 = yes). In addition to univariable models, we used multivariable models including age (continuous, years), gender (discrete, 0 = female; 1 = male) and BMI (continuous, SDS) as predictors together with FGF19 or FGF21, to test whether the relationships of interest was influenced by these potential confounders. Fractional polynomials showed that a log-transformation of FGF19 and FG21 was needed to ensure a linear logit for all outcomes [24], [25]. Akaike information criterion (AIC) was used to evaluate model fit [26]. Linear regression was used to evaluate the degree of association between the log-transformed values of the Klotho receptor (loge Klotho), the histopathological status (discrete, 0 = control; 1 = NASH negative; 2 = NASH positive) and logeFGF21 (continuous) and logeFGF19 (continuous). Statistical analysis was performed using Stata version 12.1 (Stata Corp, College Station, TX, USA).
Results
Comparison of Controls and Children with NAFLD, with NASH and without NASH
Table 1 reports the 50th, 25th and 75th percentiles of age, anthropometry, serum FGF21and FGF19 and other laboratory parameters in controls (n = 23) and children (n = 84) with NAFLD. The median levels of FGF21 and FGF19 were significantly lower in NAFLD patients with respect to controls (p<0.001, quantile regression).
Table 1. Measurements of control and NAFLD children.
| Controls | NAFLD | P50 | |||||
| (n = 23) | (n = 84) | comparison* | |||||
| P50 | P25 | P75 | P50 | P25 | P75 | p-value | |
| Age (years) | 11 | 4 | 15 | 10 | 9 | 11 | 0.3 |
| Weight (Kg) | 55 | 36 | 65 | 53 | 41 | 62 | 0.5 |
| Height (m) | 1.41 | 1.16 | 1.56 | 1.45 | 1.33 | 1.53 | 0.6 |
| BMI (kg/m2) | 25.5 | 24.5 | 27.2 | 25 | 22.2 | 27.4 | 0.6 |
| BMI (SDS) | 2.19 | 1.34 | 2.56 | 1.74 | 1.41 | 2.04 | <0.001 |
| ALT (U/L) | 30 | 26 | 34 | 70 | 48 | 90 | <0.001 |
| AST (U/L) | 29 | 26 | 30 | 51 | 40 | 65 | <0.001 |
| GGT (U/L) | 20 | 19 | 23 | 24 | 17 | 34 | 0.2 |
| Glucose (mg/dL) | 80 | 78 | 82 | 81 | 75 | 89 | 0.3 |
| Triglycerides (mg/dL) | 84 | 78 | 90 | 91 | 75 | 124 | 0.2 |
| Cholesterol (mg/dL) | 128 | 123 | 130 | 160 | 132 | 190 | <0.001 |
| FGF21 (pg/mL) | 196 | 176 | 222 | 77 | 58 | 96 | <0.001 |
| FGF19 (pg/mL) | 201 | 190 | 247 | 70 | 48 | 89 | <0.001 |
Median (P50) comparison performed with quantile regression.
Abbreviations: P = percentile; BMI = body mass index; ALT = alanine transaminase; AST = aspartate transaminase; GTT = gamma-glutamyl-transferase; FGF = fibroblast growth factor.
The histopathological features of the 84 children with NAFLD are given in Table 2 . As diagnosed by the liver pathologist, 32 (38%) of NAFLD children had NASH and fibrosis of any degree was present in 59 (70%) of cases.
Table 2. Liver histopathology of the 84 children with NAFLD.
| N | % | |
| Steatosis | ||
| 0 | 1 | 1.2 |
| 1 | 21 | 25 |
| 2 | 40 | 47.6 |
| 3 | 22 | 26.2 |
| Inflammation | ||
| 0 | 7 | 8.3 |
| 1 | 65 | 77.4 |
| 2 | 12 | 14.3 |
| Ballooning | ||
| 0 | 40 | 47.6 |
| 1 | 27 | 32.1 |
| 2 | 17 | 20.2 |
| NAS | ||
| 1 | 2 | 2.4 |
| 2 | 18 | 21.4 |
| 3 | 21 | 25 |
| 4 | 14 | 16.7 |
| 5 | 16 | 19 |
| 6 | 11 | 13.1 |
| 7 | 2 | 2.4 |
| NASH | ||
| No | 52 | 61.9 |
| Yes | 32 | 38.1 |
| Fibrosis | ||
| 0 | 25 | 29.8 |
| 1 | 47 | 56 |
| 2 | 5 | 6 |
| 3 | 7 | 8.3 |
Abbreviations: NAS = NAFLD Activity Score.
Interestingly, the median (25th; 75th percentile) values of FGF21 were 196 (176;222) in controls, 54 (45;63) in children with NASH (NASH+) and 89 (78;100) in those without NASH (NASH−) children and the corresponding values for FGF19 were 201 (190;247), 41 (33;50) and 81 (70;96) ( Figure 1 , panel A). The median values of FGF19 and FGF21 were significantly lower in NASH− and NASH+ children vs. controls and lower in NASH+ children compared to NASH− children (p<0.001 for all comparisons, quantile regression with Bonferroni’s correction) ( Figure 1 , panel B).
Figure 1. NASH and serum levels of FGF21 and FGF19.

Distribution of serum FGF21 (panel A) and FGF19 (panel B) in controls, NAFLD children without NASH (NASH−) and NASH children with NASH (NASH+). Lines superimposed to dot-plots are medians.
Association between Serum FGFs, NASH and Fibrosis
Panel A of Figure 2 plots the probability of NASH estimated by logistic regression as a function of logeFGF21. Increasing values of logeFGF21 are associated with a lower probability of NASH (p<0.001). The log-odds (standard error, SE) of logeFGF21 was −10.6 (2.5) (p<0.001) and did not change when age [continuous, 0.1 (0.2)], male gender [yes vs. no, 0.5 (0.9)] and BMI [continuous, SDS, 0.1 (0.5)] were added to the model (p>0.05 for all). Thus, there was no evidence of confounding of the NASH−logeFGF21 relationship from age, gender or BMI.
Figure 2. Probability of NASH and fibrosis as a function of serum FGF21 and FGF19.

Probability of NASH and fibrosis of any degree as a function of loge-transformed values of FGF21 and FGF19 (see text for further details on statistical analysis). Abbreviations: NASH = non-alcoholic steatohepatitis; loge = natural logarithm; AIC = Akaike information criterion. Circles are means and bars 95% confidence intervals.
Panel B of Figure 2 plots the probability of NASH as a function of logeFGF19. As for FGF21, increasing values of logeFGF19 are associated with a lower probability of NASH (p<0.001). The log-odds (SE) of logeFGF19 was −12.0 (3.0) (p<0.001) and did not change when age [0.0 (0.2)], male gender [−0.2 (1.0)] and BMI [0.3 (0.7)] were added to the model (p>0.05 for all). Thus, there was no evidence of confounding of the NASH−logeFGF19 relationship from age, gender or BMI.
LogeFGF21 and logeFGF19 were associated not only with binary NASH but also with continuous NAS. The association was linear in both cases, with NAS explaining 28% of logeFGF21 variance and 25% of logeFGF19 variance (p<0.001 for both). According to these regression models, an increase of 1 unit of NAS is associated to a mean (SE) decrease of logeFGF21 equal to −0.13 (0.03) log-units and a mean (SE) decrease of LogeFGF19 equal to −0.14 (0.03) log-units. The relationship was unchanged when age (continuous), gender (male vs. female) and BMI (SDS) were added to the regression models (p>0.05 for all). Thus, there was no evidence of confounding of the NAS-logeFGF21 and NAS-logeFGF19 relationships attributable to age, gender or BMI.
Panel C of Figure 2 plots the probability of fibrosis of any degree as a function of logeFGF21. Increasing values of logeFGF21 are associated with a lower probability of fibrosis (p<0.001). The log-odds (SE) of logeFGF21 was −2.0 (0.8) (p<0.001) and did not change when age [0.2 (0.1)], male gender [−0.2 (0.5)] and BMI [0.6 (0.4)] were added to the model (p<0.05 for all). Thus, there was no evidence of confounding of the fibrosis-logeFGF21 relationship from age, gender or BMI.
Panel D of Figure 2 plots the probability of fibrosis of any degree as a function of logeFGF19. As for FGF21, increasing values of logeFGF19 are associated with a lower probability of fibrosis (p<0.001). The log-odds (SE) of logeFGF21 was −2.6 (0.9) (p<0.001) and did not change when age [0.2 (0.1)], male gender [−0.2 (0.5)] and BMI [0.6 (0.4)] were added to the model (p>0.05 for all). Thus, there was no evidence of confounding of the fibrosis-logeFGF19 relationship from age, gender or BMI.
It is of some interest that NASH was more strongly associated with logeFGF19 than with logeFGF21 (AIC = 35 vs. AIC = 50). Likewise, fibrosis was more strongly associated with logeFGF19 than with logeFGF21 (AIC = 94 vs. AIC = 99).
Association of Liver Klotho coreceptor with Liver Histology and Serum FGFs
Although the binding of β-Klotho coreceptor is central for the action of FGF21 and FGF19 in the liver [16], [27], hepatic Klotho coreceptor expression is crucial for autophagy [28], which in turn may regulate at least FGF21 production and release [6]. There are no evidence about Klotho hepatic expression in NAFLD and its potential correlation with FGF21 and FGF19.
Therefore, here we measured Klotho hepatic expression in a randomly chosen subsample of 20 NAFLD children (11 NASH− and 9 NASH+). Seven children unrelated to the present study, who underwent urgent appendectomy and had liver bioptic specimens without signs of steatosis, provided the control group for this comparison. Table 3 compares of CTRL, NASH− and NASH+ children. Besides the expected decrease of serum FGF21 and FGF19, there was a decrease of hepatic Klotho expression with increasing severity of NAFLD.
Table 3. Measurements of children evaluated in the Klotho substudy.
| Controls | NASH− | NASH+ | |||||||
| (n = 7) | (n = 11) | (n = 9) | |||||||
| p50 | p25 | p75 | p50 | p25 | p75 | p50 | p25 | p75 | |
| Age (years) | 11a | 4 | 16 | 10a | 10.1 | 12 | 11a | 10 | 11 |
| Weight (Kg) | 48.0a | 26 | 64 | 50.0a | 43 | 66 | 50.0a | 42 | 60 |
| Height (m) | 1.40a | 1 | 1.6 | 1.50a | 1.4 | 1.5 | 1.40a | 1.3 | 1.5 |
| BMI (kg/m2) | 25.5a | 24.4 | 25.9 | 25.5a | 22.6 | 27.3 | 23.1a | 21.9 | 26.9 |
| BMI (SDS) | 1.60a | 1.1 | 2.5 | 1.70a | 1.3 | 2.3 | 1.40a | 1.3 | 2.2 |
| ALT (U/L) | 28a | 23 | 32 | 66b | 39 | 80 | 85c | 69 | 107 |
| AST (U/L) | 29a | 29 | 31 | 39b | 32 | 56 | 56b | 53 | 57 |
| GGT (U/L) | 24a | 22 | 31 | 25a | 17 | 27 | 27a | 21 | 34 |
| Glucose (mg/dL) | 79a | 78 | 82 | 84a | 72 | 90 | 76a | 75 | 80 |
| Triglycerides (mg/dL) | 80a | 74 | 85 | 82a | 72 | 112 | 99a | 74 | 170 |
| Cholesterol (mg/dL) | 128a | 126 | 131 | 133a | 127 | 167 | 150b | 129 | 188 |
| FGF21 (pg/mL) | 178a | 172 | 217 | 101b | 67 | 123 | 61c | 50 | 67 |
| FGF19 (pg/mL) | 244a | 190 | 249 | 80b | 72 | 100 | 41c | 30 | 56 |
| Klotho (mean of FI) | 1225a | 1096 | 1312 | 805b | 680 | 898 | 425c | 364 | 497 |
Medians not sharing the same superscript are significantly different at a level of p<0.05 (quantile regression with Bonferroni’s correction).
Abbreviations: P = percentile; BMI = body mass index; ALT = alanine transaminase; AST = aspartate transaminase; GTT = gamma-glutamyl-transferase; FGF = fibroblast growth factor; FI = fluorescence intensity.
As shown in Figure 3 , the hepatic expression of Klotho coreceptor was lower in NASH+ than in NASH− and CTRL children and NASH status (discrete; 0 = CTRL, 1 = NASH−, 2 = NASH+) was able to explain 87% of the variance of LogeKlotho (p<0.0001).
Figure 3. Association between the hepatic expression of Klotho, liver histopathology and serum FGF21 and FGF19.
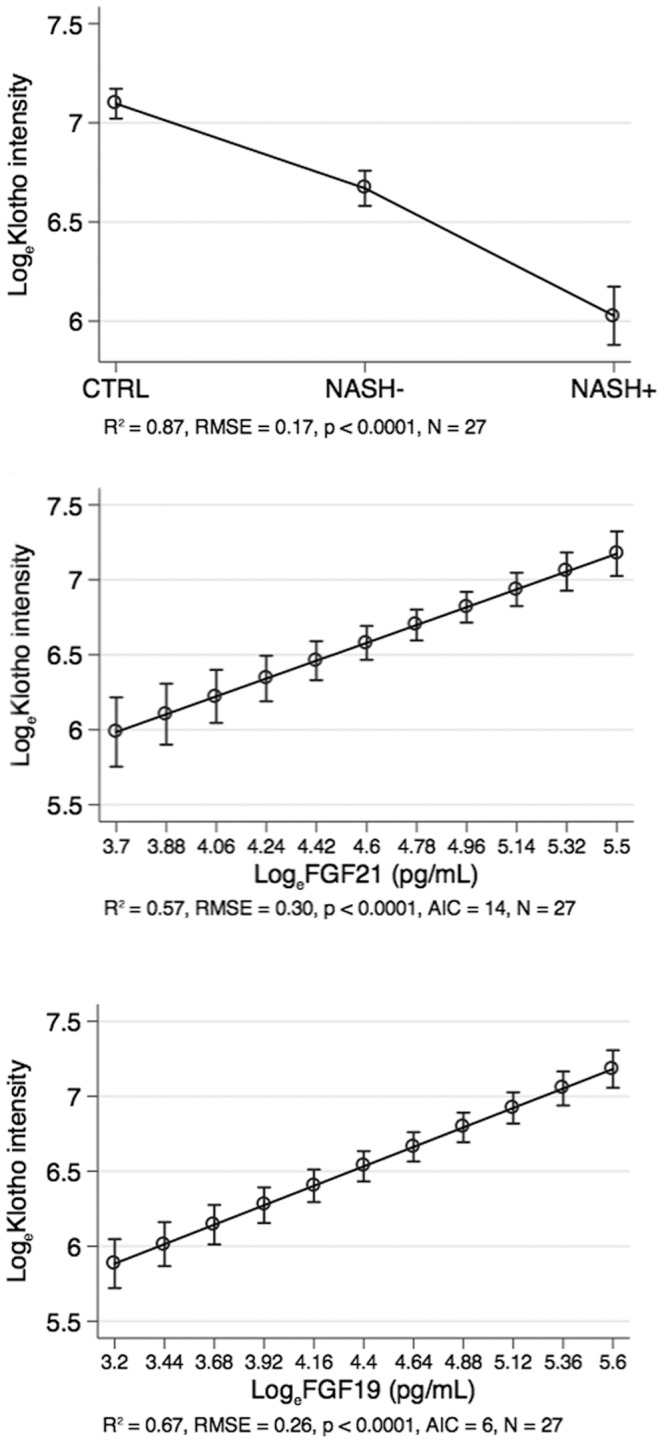
Association of Klotho with histopathology, FGF21 and FGF19 (see text for further details on statistical analysis). Abbreviations: loge = natural logarithm; RMSE = root mean squared error of the estimate; R2 = coefficient of determination; AIC = Akaike information criterion. Circles are means and bars 95% confidence intervals.
On the other hand, logeFGF21 and logeFGF19 were directly associated with LogeKlotho and explained respectively 57 and 67% of its variance (p<0.0001). LogeKlotho was more strongly associated with LogeFGF19 than with logeFGF21 (AIC = 6 vs. AIC = 14).
As shown in Figure 4 , the hepatic Klotho coreceptor was localized mainly in the cytoplasmic compartment in CTRL, whereas it was localized in the perinuclear region of liver-resident cells in NASH− and NASH+ subjects.
Figure 4. Representative confocal immunofluorescence for expression and intracellular distribution of Klotho co-receptor.

The representative confocal immunofluorescence was performed on liver tissue cryostat sections OCT-embedded. The staining of Klotho co-receptor in the overweight-obese children without NAFLD (A), in the NAFLD overweight-obese children without NASH (B), and in the overweight-obese children with NASH (C) is shown in green. The nuclei are revealed by specific DAPI staining, displayed in blue. The white bar represents a 30 µm length.
To evaluate which liver-resident cells expressed Klotho coreceptor we performed a co-staining with specific markers of endothelial and hepatic stellate cells (alpha-SMA), hepatocytes (cytokeratin 8/18) and macrophages/Kupffer cells (CD163). As shown in Figure 5 (D–F), Klotho coreceptor was expressed only in hepatocytes.
Figure 5. Representative confocal immunofluorescence of Klotho co-receptor localization in liver tissues.

The representative confocal immunofluorescence was performed on liver tissue cryostat sections OCT-embedded. (A–C) Co-staining of Klotho co-receptor (green) and CD163 (red) in children without NAFLD (A), with NAFLD NASH− (B) and with NASH+ (C). (D–F) Co-staining of Klotho co-receptor (green) and cytokeratin 8/18 (red) in children without NAFLD (D), with NAFLD NASH− (E) and with NASH+ (F). (G–I) Co-staining of Klotho co-receptor (green) and alpha-SMA (red) in children without NAFLD (G), with NAFLD NASH− (H) and with NASH+ (I). Yellow arrows indicate hepatic stellate cells. The white bar represents a 30 µm length. (J) Histological scores for panels from A to I.
Discussion
To our knowledge, this is the first comprehensive study to evaluate the association between FGF21, FGF19 and NAFLD severity. FGF21 and FGF19 were lower in NAFLD than in CTRL children and were inversely associated with the probability of NASH and fibrosis. Moreover, the hepatic expression of Klotho coreceptor was a predictor of NASH and was directly associated with the circulating levels FGF21 and FGF19.
Our study has some limitations. First, children were recruited at an Hepatology Clinic so that our “case-mix” of patients is not comparable to that of the Obesity Clinics where the majority of studies of FGFs and fatty liver have been performed to date [29]. Second, the sample size for the study of the Klotho coreceptor was about 1/4th of that of the whole study (n = 27 vs. n = 107). In spite of the strength of Klotho-NASH and Klotho-FGF relationships, the small sample sizes might misrepresent the real findings that should to be replicated in larger external samples. Moreover, although NASH+ (n = 9) and NASH− (n = 11) children for the Klotho sub-study were randomly chosen from the main study, for obvious ethical reasons, control children (n = 7) were not. These controls are of course “imperfect” because of signs of hepatic necro-inflammation, as demonstrated by the presence of CD163-positive cells similar NASH+ samples, but their hepatocyte expression of Klotho co-receptor remains statistically higher than NAFLD and NASH (Table 3).
Reinehr and colleagues detected higher values of FGF21 in obese than in normal-weight children but they found no association between FGF21 and NAFLD [29]. They diagnosed NAFLD on the basis of ultrasonography while we used liver biopsy to diagnose and stage NAFLD [30]. This allowed us to better disentangle the NALFD-FGFs relationship by separating simple steatosis from NASH and by separately evaluating fibrosis, which is clearly the “hardest” hepatological outcome for pediatric NAFLD [1]. Yan and colleagues reported lower FGF21 levels in severe steatosis as evaluated by magnetic resonance imaging [16]. In the present work, we focused on NASH and fibrosis because of their prognostic significance [31]. Our finding of a strong inverse association between FGF21 and NAFLD severity is supported by two recent experimental studies showing that tumor necrosis factor and oxidative stress-activated transcription factors, such as NFE2-related factor 2, may impair FGF21 transcription and release [32], [33].
An inverse association between serum FGF19 and the presence of MS has been reported [34] and insulin-resistant patients with NAFLD have been shown to exhibit an impaired hepatic response to FGF19 [35]. Moreover, reduced levels of FGF19 have been reported in patients with biopsy-proven NAFLD [36] and the present study confirms that FGF19 is inversely associated to NAFLD severity in terms of both NASH and fibrosis. It is of some interest that the association with NAFLD severity was stronger for FGF19 than for FGF21 both in terms of NASH and fibrosis, even if FGF19 and FGF21 were expectedly strictly associated (data not shown). This finding may be relevant for the comprehension of the mechanisms of progression of NAFLD to HCC. In fact, differently from FGF21, FGF19 is mitogenic for hepatocytes and its signaling through the FGFR4/β-klotho complex is frequently up-regulated in human HCC tissues [37].
We found a strong inverse association between hepatic Klotho coreceptor activation and NASH and a strong direct association of hepatic Klotho coreceptor and serum FGF21 and FGF19. Although the β-Klotho coreceptor is crucial for FGF21 and FGF19 signaling [38], [39], little is known about Klotho hepatic expression during NAFLD. A recent study showed that the hepatic Klotho expression correlated with cirrhosis (stage 4 fibrosis) in HCC, demonstrating a novel pro-oncogenic function of this protein [40]. We found Klotho protein in the cytoplasmic and perinuclear region of hepatocytes in controls and a progressive decrease of its cytoplasmic expression occurred in NAFLD. The total absence of Klotho on plasma membrane of hepatocyte is in agreement with its specific binding to FGF23 in other organs, such as kidney [41]. However, as we used an antibody recognizing an aminoacidic sequence within the C-terminal cytoplasmic domain of Klotho (see Figure S3) we cannot establish if the hepatic Klotho is complete or contains only the cytoplasmic region obtained after the metalloproteases-dependent cleavage of secreted form [41]. This information could be critical to understand the role of Klotho coreceptor in liver pathophysiology.
It remains to be defined why serum FGF21 and FGF19 are closely associated to hepatic Klotho expression in NAFLD. Importantly, it seems plausible that FGFs and/or their coreceptor mutually control their expression by direct feedback or by means of a common regulator of their tissue-specific promoters. For instance, as reported in Figure S4, the promoters of FGF21, FGF19 and Klotho coreceptor present binding regions for analogous transcription factors. Additional studies are required to identify potential NAFLD-activated molecular pathways involved in the down-regulation of FGF21-FGF19/Klotho network and its potential role in NAFLD-related progression, i.e. NASH, fibrosis and HCC.
In conclusion, our pediatric study shows a strong inverse association between FGF21 and FGF19 circulating levels, hepatic Klotho expression and the NAFLD severity suggesting a potential role for FGFs in the pathogenesis of NAFLD. If such findings will be replicated in external series of both pediatric and adult patients, this might have implications not only for a better understanding of the progression of NAFLD but also for the developments of novel targeted therapies.
Supporting Information
Control of secondary antibodies in control liver tissue. Staining with (A) 1∶500 Alexa Fluor 488 goat anti-rabbit IgG, (B) Alexa Fluor 555 goat anti-mouse IgG secondary antibodies and, (C) both with DAPI. The white bar represents a 30 µm length.
(DOC)
Positive controls for Klotho staining. Klotho expression in gut (A) and kidney (B). Nuclear staining with DAPI. The white bar represents a 30 µm length.
(DOC)
Klotho regions and forms. Klotho protein contains KL1 and KL2 that are two repeat sequences in extracellular region, one transmembrane region and one small of cytoplasmic region. The types of secreted and cytoplasmic forms generated by Klotho cleavage remains to be fully characterized. Our antibody specifically recognizes a C-terminus sequence within the cytoplasmic region.
(DOC)
Promoter sequences obtained from Eukariotic Promoter Database ( http://epd.vital-it.ch ) and Jaspar transcription factor binding sites obtained with JASPAR database for Vertebrata ( http://jaspar.binf.ku.dk/ ). (A) Promoter region (−1000→1) for FGF21 human gene (ENSEMBL Gene ID: ENSG00000105550); (B) Promoter region (−1000→1) for FGF19 human gene (ENSEMBL Gene ID: ENSG00000162344); (C) Promoter region (−1000→1) for Klotho human gene (ENSEMBL Gene ID: ENSG00000133116). The putative sites in each sequence were predicted with 80% score threshold, only some of the common factors with score >7 were highlighted (see legend). Blue arrow indicates the transcription start site.
(DOC)
Funding Statement
V. Nobili was supported by a research grant from Bambino Gesù Children’s Hospital and Research Institute. A. Alisi was supported by a research grant (MFAG) from Associazione Italiana Ricerca sul Cancro (AIRC). The authors also thank Nicolò Valenti Onlus (Italy) for generous donation of Envision plate reader (Perkin Elmer, Italy). The funders had no role in study design, data collection and analysis, decision to publish, or preparation of the manuscript.
References
- 1. Alisi A, Manco M, Vania A, Nobili V (2009) Pediatric nonalcoholic fatty liver disease in 2009. J Pediatr 155: 469–474. [DOI] [PubMed] [Google Scholar]
- 2. Brunt EM (2010) Pathology of nonalcoholic fatty liver disease. Nat Rev Gastroenterol Hepatol 7: 195–203. [DOI] [PubMed] [Google Scholar]
- 3. Pacifico L, Nobili V, Anania C, Verdecchia P, Chiesa C (2011) Pediatric nonalcoholic fatty liver disease, metabolic syndrome and cardiovascular risk. World J Gastroenterol 17: 3082–3091. [DOI] [PMC free article] [PubMed] [Google Scholar]
- 4. Alisi A, Cianfarani S, Manco M, Agostoni C, Nobili V (2012) Non-alcoholic fatty liver disease and metabolic syndrome in adolescents: pathogenetic role of genetic background and intrauterine environment. Ann Med 44: 29–40. [DOI] [PubMed] [Google Scholar]
- 5. Alisi A, Locatelli M, Nobili V (2010) Nonalcoholic fatty liver disease in children. Curr Opin Clin Nutr Metab Care 13: 397–402. [DOI] [PubMed] [Google Scholar]
- 6. Kim KH, Jeong YT, Oh H, Kim SH, Cho JM, et al. (2013) Autophagy deficiency leads to protection from obesity and insulin resistance by inducing Fgf21 as a mitokine. Nat Med 19: 83–92. [DOI] [PubMed] [Google Scholar]
- 7. Angelin B, Larsson TE, Rudling M (2012) Circulating fibroblast growth factors as metabolic regulators–a critical appraisal. Cell Metab 16: 693–705. [DOI] [PubMed] [Google Scholar]
- 8. Kliewer SA, Mangelsdorf DJ (2010) Fibroblast growth factor 21: from pharmacology to physiology. Am J Clin Nutr 91: 254S–257S. [DOI] [PMC free article] [PubMed] [Google Scholar]
- 9. Itoh N (2010) Hormone-like (endocrine) Fgfs: their evolutionary history and roles in development, metabolism, and disease. Cell Tissue Res 342: 1–11. [DOI] [PMC free article] [PubMed] [Google Scholar]
- 10. Kurosu H, Kuro-O M (2009) The Klotho gene family as a regulator of endocrine fibroblast growth factors. Mol Cell Endocrinol 299: 72–78. [DOI] [PubMed] [Google Scholar]
- 11. Jones SA (2012) Physiology of FGF15/19. Adv Exp Med Biol 728: 171–182. [DOI] [PubMed] [Google Scholar]
- 12. Kharitonenkov A (2009) FGFs and metabolism. Curr Opin Pharmacol 9: 805–810. [DOI] [PubMed] [Google Scholar]
- 13. Coskun T, Bina HA, Schneider MA, Dunbar JD, Hu CC, et al. (2008) FGF21 corrects obesity in mice. Endocrinology 149: 6018–6027. [DOI] [PubMed] [Google Scholar]
- 14. Xu J, Lloyd DJ, Hale C, Stanislaus S, Chen M, et al. (2009) Fibroblast growth factor 21 reverses hepatic steatosis, increases energy expenditure, and improves insulin sensitivity in diet-induced obese mice. Diabetes 58: 250–259. [DOI] [PMC free article] [PubMed] [Google Scholar]
- 15. Fu L, John LM, Adams SH, Yu XX, Tomlinson E, et al. (2004) Fibroblast growth factor 19 increases metabolic rate and reverses dietary and leptin-deficient diabetes. Endocrinology 145: 2594–2603. [DOI] [PubMed] [Google Scholar]
- 16. Yan H, Xia M, Chang X, Xu Q, Bian H, et al. (2011) Circulating fibroblast growth factor 21 levels are closely associated with hepatic fat content: a cross-sectional study. PLoS One 6: e24895. [DOI] [PMC free article] [PubMed] [Google Scholar]
- 17. Eren F, Kurt R, Ermis F, Atug O, Imeryuz N, et al. (2012) Preliminary evidence of a reduced serum level of fibroblast growth factor 19 in patients with biopsy-proven nonalcoholic fatty liver disease. Clin Biochem 45: 655–658. [DOI] [PubMed] [Google Scholar]
- 18. Morris-Stiff G, Feldstein AE (2010) Fibroblast growth factor 21 as a biomarker for NAFLD: integrating pathobiology into clinical practice. J Hepatol 53: 795–796. [DOI] [PubMed] [Google Scholar]
- 19.Lohman TG, Roche AF, Martorell R (1988) Anthropometric standardization reference manual. Champaign, IL: Human Kinetics Books, 55–70.
- 20. Cacciari E, Milani S, Balsamo A, Dammacco F, De Luca F, et al. (2002) Italian cross-sectional growth charts for height, weight and BMI (6–20 y). Eur J Clin Nutr 56: 171–180. [DOI] [PubMed] [Google Scholar]
- 21. Manco M, Bedogni G, Marcellini M, Devito R, Ciampalini P, et al. (2008) Waist circumference correlates with liver fibrosis in children with non alcoholic steatohepatitis. Gut 57: 1283–1287. [DOI] [PubMed] [Google Scholar]
- 22. Kleiner DE, Brunt EM, Van Natta M, Behling C, Contos MJ, et al. (2005) Design and validation of a histological scoring system for nonalcoholic fatty liver disease. Hepatology 41: 1313–1321. [DOI] [PubMed] [Google Scholar]
- 23.Koenker R (2005) Quantile Regression. Cambridge U. Press.
- 24.Royston P, Sauerbrei W (2008) Multivariable Model-building: A Pragmatic Approach to Regression Analysis Based on Fractional Polynomials for Modelling Continuous Variables. Chichester, UK: Wiley.
- 25.Hilbe JM (2009) Logistic Regression Models. Boca Raton, FL: Chapman & Hall/CRC.
- 26.Long JS, Freese J (2008) Regression Models for Categorical Dependent Variables Using Stata. 2nd ed. College Station, TX: Stata Press.
- 27. Kurosu H, Kuro-O M (2009) The Klotho gene family as a regulator of endocrine fibroblast growth factors. Mol Cell Endocrinol 299: 72–78. [DOI] [PubMed] [Google Scholar]
- 28. Shu G, Xie B, Ren F, Liu DC, Zhou J, et al. (2013) Restoration of klotho expression induces apoptosis and autophagy in hepatocellular carcinoma cells. Cell Oncol (Dordr) 36: 121–129. [DOI] [PubMed] [Google Scholar]
- 29. Reinehr T, Woelfle J, Wunsch R, Roth CL (2012) Fibroblast Growth Factor 21 (FGF-21) and Its Relation to Obesity, Metabolic Syndrome, and Nonalcoholic Fatty Liver in Children: A Longitudinal Analysis. J Clin Endocrinol Metab 97: 2143–2150. [DOI] [PubMed] [Google Scholar]
- 30. Vajro P, Lenta S, Socha P, Dhawan A, McKiernan P, et al. (2012) Diagnosis of nonalcoholic fatty liver disease in children and adolescents: position paper of the ESPGHAN Hepatology Committee. J Pediatr Gastroenterol Nutr 54: 700–713. [DOI] [PubMed] [Google Scholar]
- 31. Argo CK, Northup PG, Al-Osaimi AM, Caldwell SH (2009) Systematic review of risk factors for fibrosis progression in non-alcoholic steatohepatitis. J Hepatol 51: 371–379. [DOI] [PubMed] [Google Scholar]
- 32. Chartoumpekis DV, Ziros PG, Psyrogiannis AI, Papavassiliou AG, Kyriazopoulou VE, et al. (2011) Nrf2 represses FGF21 during long-term high-fat diet-induced obesity in mice. Diabetes 60: 2465–2473. [DOI] [PMC free article] [PubMed] [Google Scholar]
- 33. Díaz-Delfín J, Hondares E, Iglesias R, Giralt M, Caelles C, et al. (2012) TNF-α Represses β-Klotho Expression and Impairs FGF21 Action in Adipose Cells: Involvement of JNK1 in the FGF21 Pathway. Endocrinology 153: 4238–4245. [DOI] [PubMed] [Google Scholar]
- 34. Barutcuoglu B, Basol G, Cakir Y, Cetinkalp S, Parildar Z, et al. (2011) Fibroblast growth factor-19 levels in type 2 diabetic patients with metabolic syndrome. Ann Clin Lab Sci 41: 390–396. [PubMed] [Google Scholar]
- 35. Schreuder TC, Marsman HA, Lenicek M, van WervenJR, Nederveen AJ, et al. (2010) The hepatic response to FGF19 is impaired in patients with nonalcoholic fatty liver disease and insulin resistance. Am J Physiol Gastrointest Liver Physiol 298: G440–445. [DOI] [PubMed] [Google Scholar]
- 36. Adams AC, Coskun T, Rovira AR, Schneider MA, Raches DW, et al. (2012) Fundamentals of FGF19 & FGF21 action in vitro and in vivo. PLoS One 7: e38438. [DOI] [PMC free article] [PubMed] [Google Scholar]
- 37. Latasa MU, Salis F, Urtasun R, Garcia-Irigoyen O, Elizalde M, et al. (2012) Regulation of Amphiregulin Gene Expression by β-Catenin Signaling in Human Hepatocellular Carcinoma Cells: A Novel Crosstalk between FGF19 and the EGFR System. PLoS One 7: e52711. [DOI] [PMC free article] [PubMed] [Google Scholar]
- 38. Adams AC, Cheng CC, Coskun T, Kharitonenkov A (2012) FGF21 Requires βklotho to Act In Vivo. PLoS One 7: e49977. [DOI] [PMC free article] [PubMed] [Google Scholar]
- 39. Yang C, Jin C, Li X, Wang F, McKeehan WL, et al. (2012) Differential specificity of endocrine FGF19 and FGF21 to FGFR1 and FGFR4 in complex with KLB. PLoS One 7: e33870. [DOI] [PMC free article] [PubMed] [Google Scholar]
- 40. Chen L, Liu H, Liu J, Zhu Y, Xu L, et al. (2013) Klotho Endows Hepatoma Cells with Resistance to Anoikis via VEGFR2/PAK1 Activation in Hepatocellular Carcinoma. PLoS One 8: e58413. [DOI] [PMC free article] [PubMed] [Google Scholar]
- 41. Huang CL (2012) Regulation of ion channels by secreted Klotho. Adv Exp Med Biol 728: 100–106. [DOI] [PubMed] [Google Scholar]
Associated Data
This section collects any data citations, data availability statements, or supplementary materials included in this article.
Supplementary Materials
Control of secondary antibodies in control liver tissue. Staining with (A) 1∶500 Alexa Fluor 488 goat anti-rabbit IgG, (B) Alexa Fluor 555 goat anti-mouse IgG secondary antibodies and, (C) both with DAPI. The white bar represents a 30 µm length.
(DOC)
Positive controls for Klotho staining. Klotho expression in gut (A) and kidney (B). Nuclear staining with DAPI. The white bar represents a 30 µm length.
(DOC)
Klotho regions and forms. Klotho protein contains KL1 and KL2 that are two repeat sequences in extracellular region, one transmembrane region and one small of cytoplasmic region. The types of secreted and cytoplasmic forms generated by Klotho cleavage remains to be fully characterized. Our antibody specifically recognizes a C-terminus sequence within the cytoplasmic region.
(DOC)
Promoter sequences obtained from Eukariotic Promoter Database ( http://epd.vital-it.ch ) and Jaspar transcription factor binding sites obtained with JASPAR database for Vertebrata ( http://jaspar.binf.ku.dk/ ). (A) Promoter region (−1000→1) for FGF21 human gene (ENSEMBL Gene ID: ENSG00000105550); (B) Promoter region (−1000→1) for FGF19 human gene (ENSEMBL Gene ID: ENSG00000162344); (C) Promoter region (−1000→1) for Klotho human gene (ENSEMBL Gene ID: ENSG00000133116). The putative sites in each sequence were predicted with 80% score threshold, only some of the common factors with score >7 were highlighted (see legend). Blue arrow indicates the transcription start site.
(DOC)