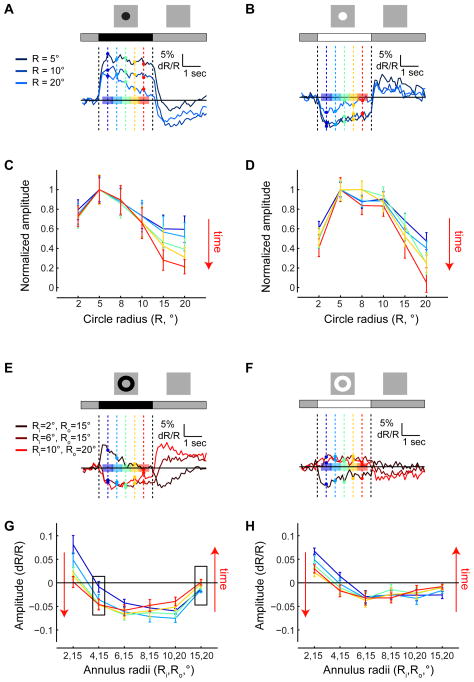
Figure 3. Surround stimulation modulates response kinetics.
(A and B) Mean responses to dark (A) and bright (B) circles of different sizes as a function of time. Dark blue - mean responses to small circles; bright blue - mean responses to large circles. Amplitudes were measured for the different responses at different time points, shown as vertical lines and sample points in different colors. Average amplitudes were computed over the intervals indicated by colored patches. Cold colors - early stages of the response; warm colors - late stages. (C and D) Normalized amplitudes of responses to dark (A) and bright (B) circles of different sizes as a function of their radius R, at different time points during the response. Each curve is normalized to the maximal response strength over all radii. (E and F) Same as (A) and (B), describing responses to dark (E) and bright (F) annuli of different sizes. (G and H) Same as (C) and (D), describing the strength of responses to dark (G) and bright (H) annuli of different sizes, without normalization. See also Figure S3.

