Abstract
Background
Chronic and frequent ethanol (EtOH) intake has been associated with an increased incidence of several types of cancers including breast, mouth, throat, esophageal, stomach and colorectal (CRC). The underlying mechanism of this deleterious carcinogenic effect of alcohol has not been clearly established but inflammation may be one unifying feature of these cancers. We have recently shown that intestinal mast cells play a central role in intestinal carcinogenesis. In this study, we tested our hypothesis that mast cell-mediated inflammation is one underlying mechanism by which chronic alcohol promotes intestinal tumorigenesis.
Methods
APC Δ468 mice were fed either an alcohol containing Nanji liquid diet or isocaloric dextrose containing Nanji diet for 10 weeks and then sacrificed to collect small and large intestine samples. Assessments of tumor number and size as well as mast cell number and mast cell activity and histology score for invasion were compared between Control (dextrose fed) and Alcohol fed APCΔ468 mice. The effect of alcohol on mast cell mediated tumor migration was also assessed using an in vitro migration assay.
Results
Alcohol feeding increased both polyp number and size within both the small and large intestines of APCΔ468 mice. Only alcohol fed mice showed evidence of tumor invasion. Chronic alcohol feeding also resulted in an increased mast cell number and activity in tumor stroma and invading borders. In vitro migration assay showed that alcohol significantly increases mast cell mediated tumor migration in vitro.
Conclusions
Our data show that chronic alcohol intake promotes: (1) intestinal tumorigenesis and tumor invasion in genetically susceptible mice; (2) increases in polyp associated mast cells; (3) mast cell mediated tumor migration in vitro. Both our in vivo and in vitro studies suggest that mast cell mediated inflammation could be one mechanism by which alcohol promotes carcinogenesis.
Keywords: Alcohol, Mast Cells, Inflammation, Cancer, APC mice
Introduction
Chronic consumption of alcohol (ethanol) is a major burden to society worldwide with about 4% of deaths and 5% loss of life years attributable to alcohol use (Rehm et al., 2009). About 14 million people in the United States alone abuse alcohol or are alcoholic, which is 1 in every 13 adults according to the National Institute of Alcohol Abuse and Alcoholism (NIAAA)(Beaglehole and Bonita, 2009). Alcohol abuse not only causes major socioeconomic problems, it can also cause major health problems by promoting a wide range of diseases such as cirrhosis, cardiomyopathy, dementia, neuropathy and steatohepatitis (Rehm et al., 2009) to name a few. One of the less appreciated but significant complications of chronic alcohol use is promotion of several epithelial cell cancers including esophageal, liver, breast and colorectal (CRC) (Boffetta and Hashibe, 2006; Seitz et al., 2005; Seitz and Stickel, 2007). Recent studies estimate alcohol is responsible for 10% of cancer cases overall and as much as 17% of colorectal cancer (Boffetta and Hashibe, 2006; Schutze et al., 2011). Furthermore, Several studies have shown that chronic alcohol consumption is associated with a more aggressive course with poor prognosis of breast and colon cancers(Seitz and Stickel, 2007).
CRC is the third most prevalent form of cancer death in men and woman in the US (Siegel et al., 2011). About 141,000 new cases of CRC were diagnosed in 2011 in the US with an expected 50,000 CRC related deaths (Siegel et al., 2011). The underlying causes for CRC risk are not fully understood. However, life style and environmental factors are possible causes. One common environmental factor in western societies with potential deleterious effects on the incidence and course of CRC is chronic alcohol consumption (Schutze et al., 2011). An association between alcohol consumption and the occurrence of colorectal cancer (CRC) was first reported in 1974 (Breslow and Enstrom, 1974). This initial observation was later validated by later case–controlled and prospective cohort studies (Kune and Vitetta, 1992), which demonstrated a 1.5- to 3.5-fold increased risk of developing CRC (Scheppach et al., 1999). Chronic alcohol consumption has also been associated with an increase in the occurrence of pre-cancerous adenomatous polyps in the colon (Kune and Vitetta, 1992). Furthermore, alcohol abuse has been linked with tumor progression, the adenoma to carcinoma sequence (Boutron et al., 1995). A better understanding of how alcohol impacts carcinogenesis should lead to better understanding of the pathogenesis of colorectal cancer and possible new avenues for treatment. Indeed, understanding the mechanism by which chronic alcohol consumption deleteriously impacts CRC can be instrumental for identifying therapeutic target(s) to prevent CRC not only in alcoholics but also potentially in any individual susceptible for CRC.
Several mechanisms have been suggested for how alcohol may promote cancers. Ethanol manifests its effect through diverse means such as the breakdown product of acetaldehyde, carcinogen inducing co-carcinogen model, DNA adducts, lipid peroxidation, inflammation, and elevated oxidative stress/free radicals (Boutron et al., 1995; Leuratti et al., 2002; Seitz and Stickel, 2007; Seitz and Stickel, 2009; Yokoyama et al., 1998). For example, alcohol increases mutagenic effects of carcinogens like tobacco by either decreasing their elimination or by increasing their activity through induction of the cytochrome P450 system. In addition, alcohol decreases DNA repair through its ability to disrupt protein functions by causing protein adducts. Furthermore, immuno-suppressive effects of alcohol can blunt host defense and promote cancer metastasis (Seitz and Stickel, 2007). Alcohol has also been shown to affect methylation of CpG islands, especially hypomethylation which could result in abnormal activation of tumor promoting genes with chronic alcohol use (Seitz and Stickel, 2007). Finally, alcohol promotes NF-kB activation and inflammation and many cancers like CRC are associated with inflammation (Coussens and Werb, 2002; Kune and Vitetta, 1992; Pikarsky et al., 2004). However, the mechanisms through which chronic alcohol use promotes CRC are not fully established.
The colonic mucosa requires balanced inflammation for homeostasis and defense against microbial pathogens. Mast cells promote innate immunity to protect against microbial pathogens and parasites and also to fine tune angiogenesis and blood vessel and gut epithelial barrier permeability. Mast cells also respond to oncogenic signals in the gut and depletion of mast cells in the APC mice model is protective (Cheon et al., 2011; Gounaris et al., 2007; Khazaie et al., 2011; Maltby et al., 2009). Alcohol consumption can activate mast cells (Mendes et al., 2011). However, the role of mast cells in alcohol induced carcinogenesis in general and specifically in CRC has never been directly examined to our knowledge. We hypothesized that mast cell mediated inflammation plays a key role in increasing the incidence and invasiveness of colon cancer after chronic ethanol intake (Forsyth et al., 2010). To test this hypothesis, we used a mouse model of intestinal polyposis (APCΔ468) (Gounari et al., 2005; Gounaris et al., 2007) and fed the mice with a complete liquid diet containing alcohol or calorie matched dextrose plus ad lib water. We sought to determine if alcohol would increase the numbers and sizes of intestinal polyps and whether these increases in polyp measurements were also associated with increases in mast cell numbers and mast cell activity. Our study shows that chronic alcohol feeding results in: (1) significant increases in intestinal polyp numbers and polyp sizes and tumor invasiveness in APCΔ468 mice; (2) significant increases in mast cell numbers and activation in tumor stroma and invading borders in these susceptible mice. These are the first data to our knowledge supporting a role for mast cells in alcohol promotion of intestinal or any other cancer and could represent a new paradigm for prevention of alcohol-associated cancers.
Materials and Methods
Reagents
Dietary components for the Nanji liquid corn oil diet including mineral mix, vitamins, and suspending agent were obtained from Dyets Inc. (Bethlehem, PA). Additional ingredients, including choline, dl-methionine, lactalbumin, dextrose, were obtained from Sigma-Aldrich (St Louis, MO). Other reagents, all of analytical grade quality, were also obtained from Sigma-Aldrich.
Nanji alcohol liquid diet
The basic caloric composition of the ethanol diet was 36% protein, 35% fat (as corn oil), and 29% carbohydrate dextrose/ethanol (4.5%v/v ethanol). The caloric composition of the Control diet was the same, except that alcohol calories were replaced with dextrose in controls. Blood alcohol levels (BAL) were not measured but in other studies using this diet BAL range was from approximately 50–100mg/dl. The alcohol administration is based on the Nanji corn or fish oil liquid diet (Donohue et al., 2007; Nanji et al., 2001; Tipoe et al., 2008) which is adapted from one established by Lieber- Decarli (de la et al., 2001). Before feeding the alcohol diet at full strength, mice were subjected to a 14-day adaptation period during which the alcohol concentration (as a percent of total calories) was gradually increased from 3.6% on day 1, to 7.2% on day 4, to 10.2% on day 6, to 21.6% on day 8, and finally to 29.0% (4.5% ethanol by volume) on day 14 and thereafter for 8.0 weeks. Chocolate (Hershey Lite) was included in both the control and alcohol diets to make them more palatable.
Animals - APC Δ468 mice
All animal experiments were carried out at the Center for Comparative Medicine at Northwestern University Feinberg School of Medicine, Chicago, IL. The animal protocol used was approved by the Institutional Animal Care and Use Committee (IACUC) of the Northwestern University Feinberg School of Medicine of Chicago, and followed the Guidelines for the Use and Care of Laboratory Animals published by the National Institutes of Health. Only male mice were used to avoid confounding effects of differences in alcohol metabolism between males and females in rodents (also true of humans).(Kwo et al., 1998; Tanaka et al., 1993; Thomasson, 1995)
Male, age-matched 6 week old mice were used in all experiments. C57BL/6 and C57BL/6 APCΔ468 mice (Gounari et al., 2005) were bred at Northwestern University and were maintained on a Purina rodent chow diet following arrival at the animal research facility. Mice were bred to build a colony and the offspring phenotype was verified by genotyping (PCR) as described (Gounari et al., 2005). Littermates were then equally subdivided into 2 groups after maturity. The two experimental groups consisted of APCΔ468 with alcohol (EtOH) diet or with dextrose diet (Control). Mice were monitored weekly for calorie intake and weight.
Immunohistochemistry
Mast cells were stained and quantified for protease content, tryptase (mMCP6) and chymase (mMCP2), as previously described (Gounaris et al., 2007; Kiernan, 2008). Mouse paraffin embedded tissue was cut in 5 μm thick sections for staining. Epitope affinity purified polyclonal sheep anti-mouse mMCP-2 antibody, and rabbit anti-mouse mMCP-6 were used as described (McNeil et al., 1992; Noli et al., 2003; Pemberton et al., 2003).
Hematoxylin and eosin (H&E) staining of intestinal tissue
Paraffin slides were prepared (5 μm) and stained for Hematoxylin & Eosin as previously performed (Gounaris et al., 2007; Kiernan, 2008).
Chloroacetate esterase staining for presence of mast cells
Mast cell cytoplasm contains metachromatic granules. Metachromasia produces a different color in a tissue component to the color of the dye solution due to the pH, dye concentration and temperature of the basic dye. Blue or violet dyes will show a red color shift, and red dyes will show a yellow color shift with metachromatic tissue elements. Toluidine blue is blue in solution but stains mast cell granules red-purple (metachromatic staining) and the background blue (orthochromatic staining). This staining has been used as the standard method of detecting mast cell granules.
Chloroacetate esterase (CAE) detects and stains red chymotrypsin like serine esterases in the granules of mucosal mast cells.(Huntley et al., 1985).
Paraffin sections were deparaffinized with xylene (two times, 5 min each) and rehydrated gradually with 100% ethanol, 95% ethanol, 70% ethanol, and water. The slides were stained with Naphthol-AS-D chloroacetate and counterstained with hematoxylin Gills II as described earlier(Gounaris et al., 2007). Mast cell quantification consisted of average number of mast cells per polyp of 20 random fields for each respective mouse intestine. This was done blinded in duplicate under 20x magnification.
Toluidine Blue staining to quantify degranulating mast cells
Paraffin sections (5 μm) were cut and stained to verify mast cell degranulation as previously performed (Blumenkrantz and Asboe-Hansen, 1974). 20 random fields per mouse intestine were selected for quantification and performed blinded in duplicate at 20x magnification. Mast cell number per polyp of each respective group was quantified as noted above.
Experimental Design
BL/6 APCΔ468 mice were randomly divided into 2 groups (6 EtOH, 6 No EtOH) which received various treatments consisting of No EtOH (dextrose; paired fed) and EtOH, for a period of 10 weeks (2 weeks for acclimation of alcohol and 8 weeks for full amount of alcohol). Our rationale for choosing this alcohol feeding regimen was that we have previously shown that this 10 week alcohol regimen results in significantly increased intestinal permeability and intestinal oxidative stress and inflammation in rodent models of chronic alcohol use (Keshavarzian et al., 2009). The animals were observed daily for clinical signs and mortality. Body weight and food consumption were measured and recorded weekly. The ethanol administration is based on the Nanji diet (Donohue et al., 2007; Nanji et al., 2001; Tipoe et al., 2008) as described above.
Animal tissue
The final weight was recorded, mice anesthetized, and sacrificed to obtain the following tissue: proximal small intestine, distal small intestine, and colon (Roy et al., 2002). The small bowel and large bowel (colon) were removed and subjected to macroscopy and microscopy to measure the number and size of the polyps. Some samples of the intestines were fixed and paraffin blocked and 5 μM sections were stained to quantify mast cell number, location, and degranulation as described above.
In vitro tumor migration assay
This assay was performed as previously described (Forsyth et al., 2010). Briefly first, human colon carcinoma cell line DLD-1 cells obtained from ATCC (CCL221; ATCC Manassas, VA) were cultured in DMEM with 10% FBS and Penicillin/streptomycin. At the time of assay cells were trypsinized and counted and 1 × 10⁵ cells were added to the upper well of Falcon PET 12 well tissue culture inserts with 8 μm pore size (#3182; B&D, Franklin Lakes, NJ). In addition, the human basophilic leukemia cell line KU-812 (ATCC CRL2099) was also obtained from ATCC. Cells were cultured in RPMI with 10% FBS as described (Zhu et al., 1998) and differentiated into mast cells using media supplemented with 0.3mM sodium butyrate (Sigma) for 3 days followed by addition of 50U/ml recombinant human gamma interferon (R&D Systems) for an additional 3 days as described (Zhu et al., 1998). To begin the assay 2 × 10⁵ differentiated KU-812 cells were added to the lower well of the inserts with 1 × 10⁵ DLD-1 cells in the upper well. Alcohol treated wells contained 0.2% (43mM) alcohol (in both upper and lower wells) added in the media before cells were added. Thus both cell types were exposed to alcohol as in vivo. Background Control wells contained only DLD-1 cells in the upper well and no KU-812 cells in the lower well. Migration numbers from these background wells were subtracted from total migration numbers. After 48h non-migrated cells from the upper wells were removed by cotton swab and inserts were fixed and remaining (migrated) DLD-1 cells stained with crystal violet as described (Forsyth et al., 2010). Cells were blindly counted as cells/field at 200x magnification with three random fields per insert for triplicate inserts for each condition. Data are means ± SE (N= 9 each data point).
Data analysis
All histology and migration scoring was by observers blinded to the treatment groups. Student’s T-test and Pearson (Bivariate) 2-tailed test were performed in SPSS statistical program. Results are expressed as Means ± SE. Significance for tests was p≤0.01 or p≤0.05 as noted.
Results
Chronic alcohol feeding promotes tumorigenesis in APCΔ468 mice
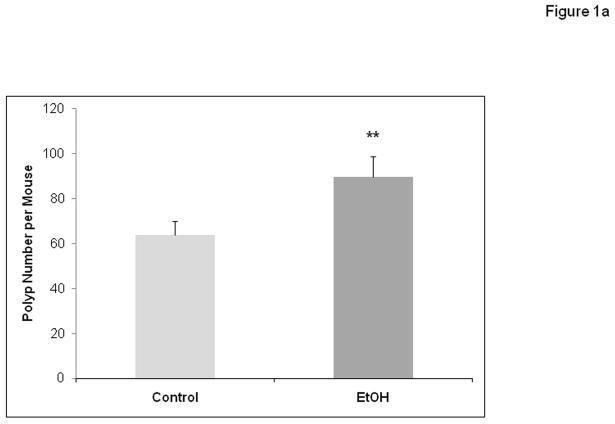
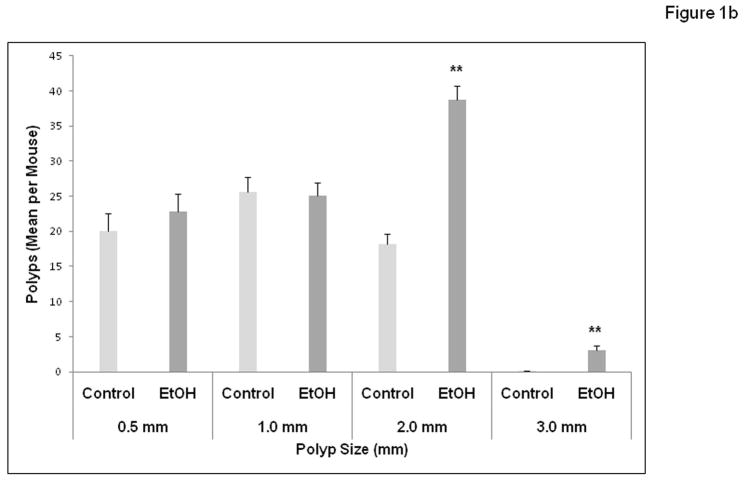
APCΔ468 mice were given a chronic alcohol diet as described in Methods in which 29% of calories (4.5%v/v ethanol) was supplied as alcohol. There was no evidence of toxicity from supplementation with alcohol (death or sickness behavior or excessive weight loss). There was an average of 9.5±0.5 ml of liquid diet consumed in the alcohol fed group per day which was not significantly different than the 9.2 ± 0.5 ml for the Control group mice. The weights of the animals did not yield any significant difference between groups during the treatment period or at the endpoints. The average final weight for the Control group was 31.2 grams vs. 32 grams for the alcohol treated group. Unlike human FAP that affects the colon, mouse models of polyposis develop mainly small bowel polyposis. Colonic polyps in APC mice are rare and when they are present do not exceed 5 polyps per colon(Gounaris et al., 2007; Khazaie et al., 2011). We have not seen any significant increase in colonic polyp numbers in alcohol fed mice, but this may be due to the fact that the APC mice rarely develop colonic polyps. The number and size of intestinal polyps (Figures 1a and 1b) formed were measured after treatment with chronic alcohol at week 10 and compared to controls. There was a significant increase in the number of intestinal polyps per mouse formed in alcohol treated mice (Fig. 1a; 63.8 ± 6.0 for Control vs. 89.7 ± 8 for Alcohol (EtOH), p≤ 0.01). Alcohol fed mice also had on average a size distribution of larger polyps per mouse (Fig. 1b). Polyp sizes in mm were: Alcohol: 0.5 mm = 22.8±2.5, 1.0 mm = 25.1±1.9, 2.0 mm = 38.8±1.9 (**versus Control, p≤0.01) and 3.0 mm = 3.0±0.7 (**versus Control, p≤0.01); Control treated polyp sizes were: 0.5 mm = 20±2.6, 1.0 mm = 25.6±2.1, 2.0 mm = 18.2±1.4, and no 3.0 mm = 0.00. Thus, there was significant increase in numbers of 2.0 mm and 3.0 mm polyps in Alcohol treated mice versus control with approximately double the number of 2.0 mm polyps in addition to no 3.0 mm polyps in Control treated mice.
Figure 1.
Figure 1a. Chronic alcohol feeding results in increased numbers of intestinal polyp tumors in APCΔ468 mice. After 8 weeks of the Nanji alcohol diet treatment, mice were sacrificed and the intestines were removed. Polyps were quantified via macroscopic exam as well as microscopy (Materials and Methods). Intestines were fixed and processed for paraffin embedding. H&E staining was performed after obtaining 5 μm paraffin sections. There was a significant increase in the number of intestinal polyps in the Alcohol fed (EtOH) APC Δ468 mice versus Control treated. EtOH (N=5) and Control (N=6). All results are in Means ± SE: EtOH = *95±2.7 vs. Control = 68±3.0, **p≤ 0.01.
Figure 1b. Chronic alcohol feeding results in increased size of intestinal polyp tumors in APCΔ468 mice. After sacrifice and quantification of the number of polyps, the sizes of polyps were measured for comparison. Polyps (mm) of 0.5, 1.0, 2.0, and 3.0 were measured in the EtOH (dark grey) and Control (light grey) groups. The size of polyps in alcohol fed APC Δ468 mice increased significantly as compared to the Control treated group. There was an increase of average number of polyps of the same size (2.0 mm) as well as larger (3.0 mm) polyp formation in alcohol fed mice that were not present in the control. Sizes in mm- Alcohol: 0.5 mm = 22.8±2.5, 1.0 mm = 25.1±1.9, **2.0 mm = 38.8±1.9 versus Control, p≤0.01 and **3.0 mm = 3.0±0.7 versus Control, p≤0.01 compared to dextrose Control treated: 0.5 mm = 20±2.6, 1.0 mm = 25.6±2.1, *2.0 mm = 18.2±1.4, **3.0 mm = 0.00. Data are means ± SE. ** p ≤ .01 vs. the respective Control value.
Chronic alcohol feeding results in increased mast cell numbers at the sites of polyps and increased stromal mast cell activation in APCΔ468 mice
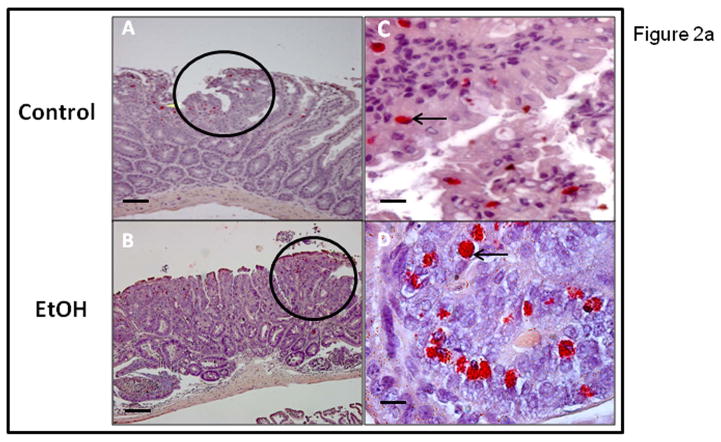
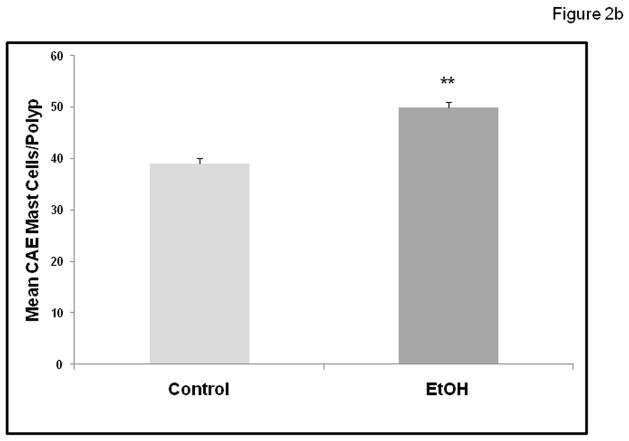
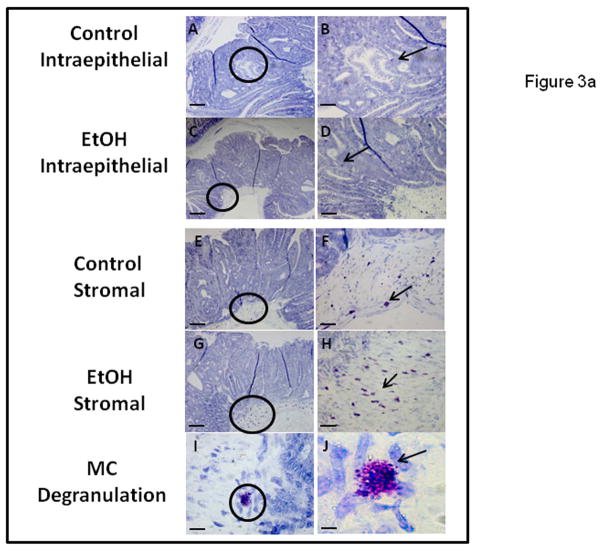
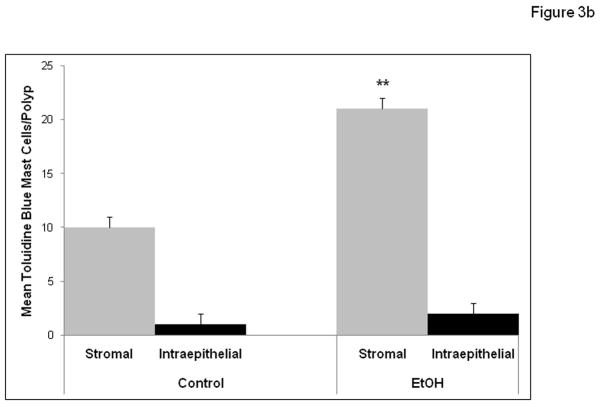
We wished to determine if chronic alcohol feeding resulted in increased mast cell numbers at the sites of polyps. The number of mast cells was quantified by Chloroacetate esterase (CAE) staining (Fig. 2a) and showed a significant increase in chronic alcohol treated APCΔ468 mice. Average mast cell number per polyp (Fig. 2b) in the intestine of Control fed mice was significantly lower (39±1.0) than in Alcohol fed mice, (50.4±1.0; **p≤0.01). We next wished to determine whether there was evidence for greater mast cell activation (Toluidine blue positive staining mast cells representing degranulation) in mice chronically fed alcohol. Representative staining for Toluidine blue and high magnification of an example of degranulating mast cells are shown in Fig. 3a. Stained degranulating mast cells were largely restricted to the stroma and were significantly increased in alcohol fed mice. The numbers of both stromal and intraepithelial activated mast cells per polyp was increased in alcohol fed mice compared to Control fed mice (Fig. 3b). However, intraepithelial mast cells exhibited no significant difference in degranulation between Control and Alcohol groups, while stromal mast cells exhibited a significant increase in Toluidine blue stained degranulating mast cells per polyp in the Alcohol fed mice (21±1.0, **p≤0.01) as compared to Control mice (9.5±1.0)(Fig. 3b).
Figure 2.
Figure 2a. Chloroacetate Esterase (CAE) staining demonstrates increased intestinal polyp mastocytosis in alcohol fed APCΔ468 mice. Paraffin embedded intestinal sections were obtained as described in Methods after chronic alcohol feeding for 8 weeks and stained for presence of mast cells with CAE. Micrographs of intestinal polyps were obtained to quantify mast cells. The circled areas are of polyps in representative Control (A) and EtOH treated (B) mice at 20x. CAE positive stained MC are red in color and indicated by arrows: Control intraepithelial MC (C) were significantly less than EtOH MC (D) at 40x. Overall, a significant increase of mast cell numbers occurred in alcohol fed APCΔ468 mice versus Controls in the intestinal polyps. Bar line = 30μm
Figure 2b. Mast cell numbers are increased in polyps with alcohol treatment in APCΔ468 mice. Mast cells were quantified as mast cells/field at 20x magnification as described in Methods. A significant increase of intestinal mast cell number was found in intestinal polyps of alcohol treated APC Δ468 mice versus dextrose Control mice polyps. Control (dextrose fed) polyp average mast cell number per polyp was significantly lower (39±1.0) as compared to alcohol fed mice polyps (**50.4±1.0; p≤0.01).
Figure 3.
Figure 3a. Chronic alcohol feeding results in increased numbers of degranulating MC in stromal but not epithelial zones of intestinal polyps of APCΔ468 mice. MC Toluidine Blue staining revealed MC releasing contents of granules within the microenvironment of the intestinal polyps, with both intraepithelial and stromal staining. Paraffin embedded tissue slides (5 μm) were obtained and stained as described in Methods. Representative polyps (A, C, E, G) have circles with area of interest at 10x and (B, D, F, H) are the areas at 20x. Intraepithelial MC (D) in alcohol treated mice did not exhibit a significant difference in number vs. Control (B). However, in the stroma, there was a significant increase in degranulating MC in the alcohol fed mice (H) as compared to Controls (F). Representative mast cell degranulation is shown in I and J, at magnification of 40x and 100x respectively. Bar line = 30μm
Figure 3b. Chronic alcohol feeding results in increased average numbers of degranulating mast cells as revealed by Toluidine Blue staining of MC in stromal but not epithelial zones of intestinal polyps of APCΔ468 mice. Intraepithelial MC showed no significant difference in staining between Control (1± 1) and Alcohol fed (2± 2) groups. However, Stromal MC showed a significant increase in staining in alcohol fed mice: Control (9.5±1.0) vs. Alcohol fed mice 21±1.0, **p≤0.01.
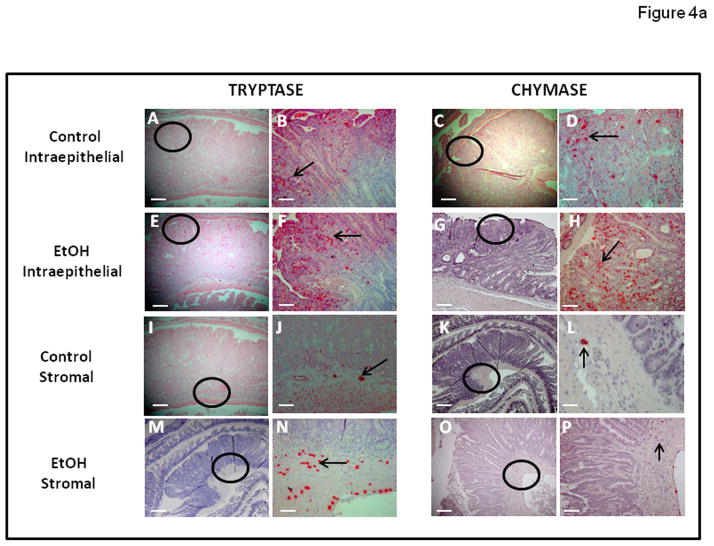
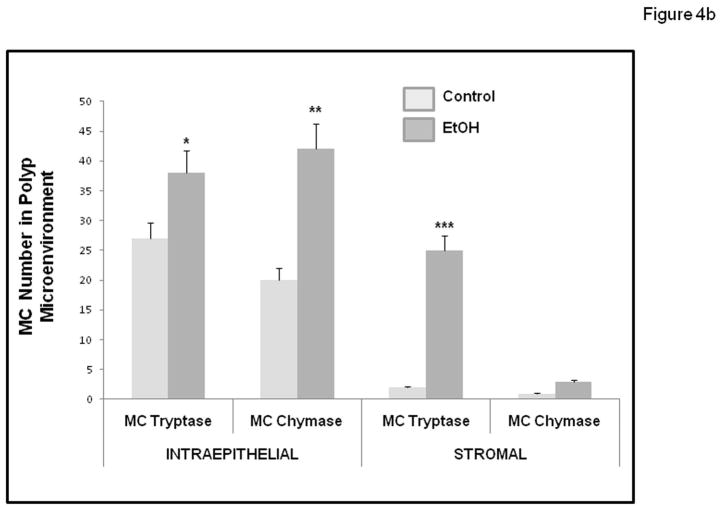
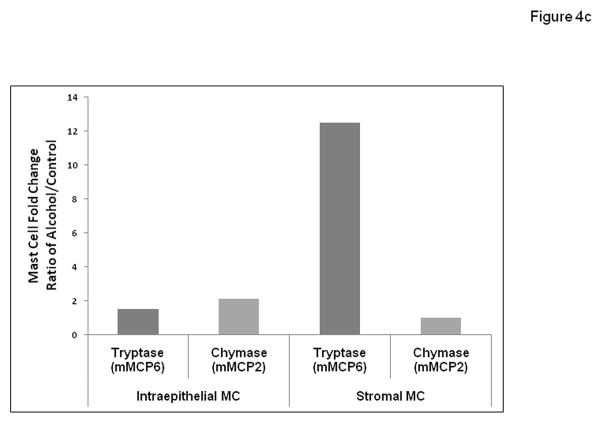
Murine MC have historically been divided into two subpopulations, based on histochemical staining properties, expression of MC proteases, and localization: connective tissue mast cells (CTMC) versus mucosal mast cells (MMC) (Gounaris et al., 2007; Gurish and Boyce, 2006). In mice, MMC express chymases (mMCP2) but rarely express tryptase. In contrast, CTMC typically express chymases (but not the mMCP2) and tryptases (mMCP6). However, in our study all mast cells are located in the intestinal mucosa (Intraepithelial) or submucosa (Stroma). Therefore, we sought to enumerate by immunohistochemistry, the presence of these different functional types of mast cells defined by their protease expression as either chymase (mMCP2; murine mast cell protease 2) or tryptase (mMCP6; murine mast cell protease 6) expressing MC and to determine their location in polyps as either Intraepithelial or Stromal (subepithelial). As seen in Figures 4a and 4b, we found there was an increase in the number of both mast cell types within the polyp microenvironment (Intraepithelial and Stromal) in alcohol treated mice (Fig. 4a). Most importantly, in alcohol fed mice we observed a significant increase in tryptase (mMCP6) mast cells in the stroma. Stromal tryptase positive mast cells were significantly increased in Alcohol fed mice (25.4±1.0; ***p≤0.01) when compared to dextrose Control fed mice (2.0±1.0)(Fig. 4b). However, there was no significant difference in stromal MMC chymase positive mast cells in the Alcohol fed mice (1.2±0.5) compared to the dextrose Control fed mice (1.8±0.5)(fig. 4b).
Figure 4.
Figure 4a. Tryptase and Chymase staining for MC was increased in intestinal polyps of Alcohol fed compared to Control fed APCΔ468 mice. Mast cells were identified via staining with Tryptase and Chymase antibodies of paraffin embedded intestinal tissue sections as described in Methods. Representative images on the left (Control: A, C, I, K, and Alcohol: E, G, M, O; at magnification of 10x) are of polyps of respective mice and have circles of an area of concentration. Images on the right of them (Control: B, D, F, H, J, L, N, and P at magnification of 20x) are highlighted with arrows showing MC positively stained for tryptase or chymase respectively. Bar line = 30μm
Figure 4b. Numbers of intestinal polyp MC staining for Tryptase and Chymase were increased in Alcohol fed compared to Control fed APCΔ468 mice. Numbers of intestinal tryptase and chymase positive mast cells (MC) in intestinal polyps increased with chronic alcohol feeding. Intraepithelial Tryptase positive MC: Control (26.5±1.2) was significantly lower than in the Alcohol fed (dark grey) APCΔ468 mice (38.0±1.2; *p≤0.01). Intraepithelial Chymase positive MC: Control (light grey) (20±1.0) was significantly lower than the Alcohol fed APCΔ468 mice (42±1.8; **p≤0.01). Stromal Tryptase positive MC: Control (2.0±1.0) was significantly lower than the Alcohol fed APCΔ468 mice (25.4±1.0; ***p≤0.01). Stromal Chymase positive MC: There was no significant difference in stromal chymase positive mast cells in the Alcohol fed mice (1.2±0.5) compared to the dextrose Control fed mice (1.8±0.5).
Figure 4c. Intestinal polyps in alcohol fed APCΔ468 mice exhibit a dramatic increase in stromal tryptase (mMCP6) positive mast cells compared to Control fed mice. In order to elucidate relative contributions for alcohol promotion of tumorigenesis by subsets of mouse mast cells we used data from Fig. 4b above to determine the ratio of alcohol/control mean mast cell number for each mast cell type (chymase/mMCP2 or tryptase/mMCP6) in either the intraepithelial or stromal tissue locations. Ratios from left to right are Intraepithelial: 1.5 (tryptase), 2.1(chymase); Stromal: 12.5 (tryptase), 1.0 (chymase).
The average number of intraepithelial tryptase positive mast cells per polyp in the Alcohol fed mice (38.0±1.2; *p≤0.01) was also significantly greater than in Control dextrose mice (26.5±1.2). Intraepithelial MMC chymase positive mast cells were also found to be significantly greater in Alcohol fed (42±1.8; **p≤0.01) compared to dextrose Control mice (20±1.0). To better understand the possible functional role played by these two mast cell types, we also calculated the ratio (fold difference) for each cell type using numbers from Fig. 4b (ratio: Alcohol treated number/Control treated number) for both mMCP6 tryptase and mMCP2 chymase expressing mast cells in either the Intraepithelial or Stroma locations. Fig. 4c shows the histogram for these fold difference ratios for these mast cell types with alcohol treatment. When presented in this fashion the striking conclusion is that by far the greatest change with alcohol treatment was for increased tryptase (mMCP6) expressing mast cells in the stroma (12.5 fold increase). The less dramatic mast cell fold differences with alcohol treatment were for stromal chymase (mMCP2) (ratio of 1.0, no change) and Intraepithelial: tryptase (mMCP6) (1.5 fold increase) and chymase (mMCP2) (2.1 fold increase) (Fig. 4c).
Chronic alcohol fed APC Δ468 mice (but not controls) exhibit evidence of tumor invasion
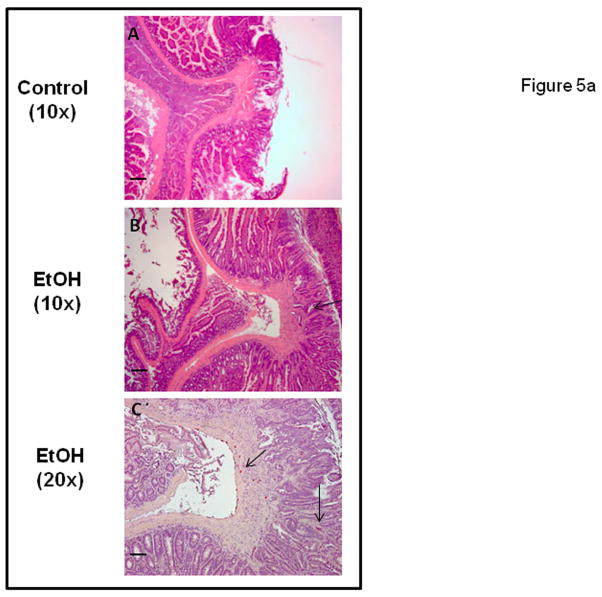
The inheritance of a defective allele in mouse models of polyposis results in benign preneoplastic lesions. Invasion is not a typical characteristic of these APCMin models, including the APCΔ468 mice (Gounaris et al., 2007; Halberg et al., 2009; Yamada and Mori, 2007). We were therefore surprised to observe that three of five Alcohol fed mice had invasive cancer as shown in representative images in Figure 5a. In contrast, there was no evidence of invasion in any polyps in dextrose fed Control mice.
Figure 5.
Figure 5a. Intestinal polyps of alcohol fed but not Control APCΔ468 mice exhibit evidence of tumor invasion. Polyps stained as described above for H&E and CAE (mast cell marker) were examined for signs of tumor invasion of the basement membrane. Numerous polyps from Alcohol fed mice exhibited signs of invasion while no such invasion was found in Control fed mice polyps. Representative images show: (A) Control fed mouse polyp with no invasion, 10x. (B) Alcohol fed mouse polyp with invasion (arrow) and dysplasia, 10x. (C) CAE staining for MC at same invasive polyp shown in B, 20x. Note MC are intraepithelial (right) as well as stromal (arrows). Bar line = 30 μm
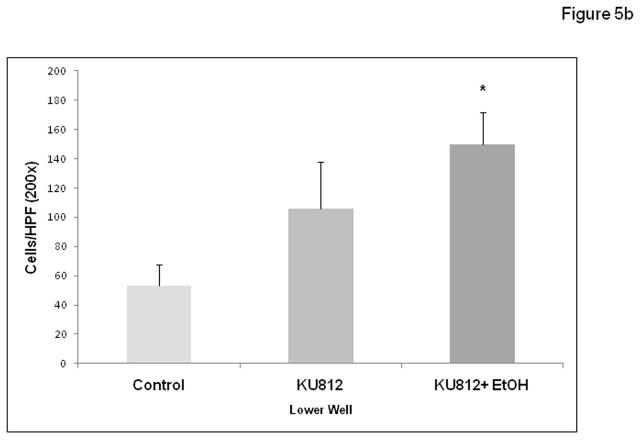
Figure 5b. Alcohol stimulates KU-812 mast cell promotion of DLD-1 colon cancer cell migration in vitro. The human basophilic leukemia cell line KU-812 was differentiated to become mast cell like in vitro as described in Materials and Methods. These cells were tested in a cell migration assay (modified Boyden chamber) using 8μM Falcon inserts in 12-well plates (lower well, 2 × 10⁵ cells/well) for their ability to stimulate migration of DLD-1 human colon cancer cells (upper well, 1 × 10⁵ cells/well) ± 0.2% alcohol for 48h. Control wells had no KU-812 in lower well. Data are for migrated cells per high power field (HPF, 200x) visualized with crystal violet staining and are means ± SE for 3 random fields in triplicate wells (N=9) by a blinded counter.
Alcohol promoted mast cell mediated tumor migration in vitro
After viewing the increased intestinal polyp invasion in alcohol fed mice we wished to test if alcohol stimulation of mast cells could promote colon cancer cell migration in vitro. To test this we modified the cell migration assay we have used previously to show that alcohol promotes colon cancer cell migration in vitro (Fig. 5b) (Forsyth et al., 2010). However, while colon cancer cells were still placed in the top well, in this case the lower well contained the human basophilic leukemia cell line KU-812 differentiated to become mast cell like with butyrate and IFN-γ as described (Zhu et al., 1998). Wells (both upper and lower wells contained alcohol) containing 0.2% alcohol (43mM; 2–3 drinks equivalent) plus mast cells resulted in significantly more colon cancer migration (150±21; *p≤ .05 vs. KU-812 cells alone) than KU-812 mast cells alone (106±31) or no cell background control (53±14) thus supporting a possible mechanism for the observed increased invasion of polyps in alcohol fed mice through alcohol enhancement of mast cell stimulation of tumor cell migration.
Discussion
In this study we investigated the hypothesis that alcohol may exert a proinflammatory influence on intestinal tumorigenesis through stimulation of mast cell (MC) numbers and activity. To do this we combined two validated models: the first is administration of chronic alcohol to mice through the liquid Nanji diet (Nanji et al., 1994; Tipoe et al., 2008). The second is the APCΔ468 model of intestinal tumorigenesis which we have used in previous studies to demonstrate the tumor promoting role of mast cells (Gounaris et al., 2007). Our study has several significant findings that support our hypothesis. First our data show that chronic alcohol feeding resulted in increased numbers of intestinal polyps as well as an increase in numbers of larger polyps and overall polyp size in the APCΔ468 mice. Second, we found that there was evidence in some Alcohol fed mice of tumor invasion, a tumor characteristic not normally found in the APCΔ468 mice polyps and not found in any of the Control dextrose fed APCΔ468 mice. This mechanism was supported by our in vitro data for alcohol enhancement of mast cell stimulated tumor cell migration. Third, we show that chronic alcohol feeding resulted in increased intestinal mast cell numbers and mast cell degranulation at the sites of polyps. Taken together, these data support the hypothesis that alcohol may promote intestinal tumorigenesis and cancer progression through stimulation of intestinal mast cell numbers and activity.
Rodent mast cells are traditionally divided into mucosal mast cells (MMC; mMCP2, chymase expressing) and connective tissue mast cells (CTMC; mMCP6, tryptase expressing). Because all MC that reside in the intestinal mucosa (intraepithelial) and submucosa (stroma) are by definition “mucosal” we have chosen to define these functional MC groups solely by their characteristic mast cell protease expression. A large body of information in human cancers as well as the APCΔ468 mouse model of colon cancer supports a role for mast cells in promoting tumor angiogenesis and invasion (Dalton and Noelle, 2012; Gounaris et al., 2007). However, the specific roles of mMCP2 (chymase) and mMCP6 (tryptase) mast cells in this process are still being defined. Murine mucosal mast cells rarely express tryptase, which is usually a characteristic of connective tissue mast cells(Gurish and Boyce, 2006). In the healthy intestine MC are rare but when present tend to express chymase and are intraepithelial(Khazaie et al., 2011). In APC mice polyposis there is expansion of chymase positive intraepithelial mast cells in adenomatous polyps and their ablation leads to attenuation of polyposis(Gounaris et al., 2007; Khazaie et al., 2011). Recent studies from our lab support a role for stromal tryptase positive MC in promoting tumor invasion (Khazaie et al., 2011). In support of this model, the most dramatic change in alcohol treated mice in this study was the over 12 fold increase in the density of stromal mMCP6 (tryptase) postiive mast cells (Figs.4b and 4c). Such mast cells are not seen in chow-fed (or dextrose control fed) APCΔ468 Min mice(Gounaris et al., 2007). Our data support that alcohol-stimulated expression of tryptase and stromal/submucosal localization of tryptase positive MC is linked with tumor invasion. Further studies are needed to definitively identify the roles of chymase and tryptase mast cell types in intestinal cancer (Dalton and Noelle, 2012).
Our data show that alcohol feeding resulted in both increased polyp invasion as well as increased size of intestinal adenoma tumor polyps. Two major stages of adenoma have been identified in the APC Min mouse: microadenomas and macroscopic polyp tumors (Yamada and Mori, 2007). With regard to macroscopic tumors it has been shown that tumors greater than 2 mm require neoangiogenesis (the so called angiogenic switch) to progress to a larger size such as 3 mm (Rajamanickam et al., 2010; Tosetti et al., 2002). Such promotion of angiogenesis is consistent with the alcohol-stimulated mastocytosis that we observed and stimulation of angiogenesis is thought to be a key mechanism for mast cell promotion of intestinal tumorigenesis and invasion (Khazaie et al., 2011). This mechanism is also relevant to the increased invasion associated with alcohol-related tumors, since polyp size has been shown to correlate with cancer progression (and poor prognosis) in both mice models(Yamada and Mori, 2007) and human patients(Pickhardt and Kim, 2009).
Our previous study provided evidence that mast cell progenitors expand in mouse polyposis in a lymphocyte-independent manner and localize specifically to the polyp microenvironment. Indeed, depletion of mast cells significantly reduced polyposis in APCΔ468 mice (Gounaris et al., 2007). To our knowledge the only other study on the effect of chronic ethanol feeding in the APCMin mouse (Jackson lab) model was limited to showing a significant increase in tumorigenesis in the small bowel that supports our findings (Roy et al., 2002). However, differences in polyp size or a possible role for mast cells were not addressed. Recent studies in vitro (Jeong et al., 2005) show alcohol can activate mast cells and in vivo studies have found similar effects of chronic alcohol feeding on increased mast cell numbers and increased MC degranulation in prostate, epididymis and testis in rats (Mendes et al., 2011) as well as squamous epithelial layers (Coussens et al., 1999). In the present study, consistent with a role for mast cells in polyposis, we found a significant increase in the numbers of degranulating as well as chymase and tryptase expressing mast cells in chronic alcohol-treated animals, supporting alcohol promotion of activated mast cells in the polyp microenvironment, especially in the stroma where invasion takes place.(Khazaie et al., 2011).
Mast cells have historically had importance in progression of a wide range of solid tumors (Khazaie et al., 2011). It is well established that mast cells play a key pro-carcinogenesis role in many solid tumors including CRC (Maltby et al., 2009). Mast cells degranulate a wide array of pro-inflammatory chemokines, cytokines, and eicosanoids, (Bacac and Stamenkovic 2008; Kinet 2007; Wintroub and Soter 1981), Stem cell factor (SCF) attracts more mast cells, Granulocyte-macrophage colony stimulating factor 1 (GM-CSF1), Vascular Endothelial Growth Factor (VEGF) promotes angiogenesis, Protease, Tryptase, Histamine, and Heparin. TNF-α and IL-8 produced by activated mast cells are chemoattractants to recruit neutrophils that in turn release more reactive oxygen species and more inflammatory damage to the gut (Marone et al., 2001). Thus, mast cells have a putative multifaceted involvement in the proinflammatory and pro-angiogenic cascade of events leading to intestinal tumorigenesis. Mast cell derived immunoregulating substances that might contribute to promoting tumors include inflammatory cytokines/mediators (IL-1, IL-4, IL-5, IL-6, PGE2, PGD2, LTB4, LTC4, PAF, and TNF-α) as well as angiogenic and vascular permeability factors/proteases (histamine, MMP-2, MMP-9, MCP-1, MCP-2, MCP-4, MCP-5, MCP-7, and MCP-8)(Khazaie et al., 2011; Maltby et al., 2009).
In summary, our data show that alcohol fed mice had increased intestinal mast cell numbers and activity that correlated with increased polyp size and polyp number in the APCΔ468 Min mouse model of intestinal tumorigenesis. Importantly, we also found that ethanol promotion of mast cell numbers and activity correlated with histological evidence for increased tumor cell invasion. This is a remarkable finding because it is well established in the field that the APCMin mouse model forms polyps in the intestines that are typically non-invasive (Halberg et al., 2009; Yamada and Mori, 2007). Future studies will also analyze differences in secreted cytokines/growth factors in alcohol fed mice to try and identify underlying mechanisms for alcohol promotion of polyp formation and invasion in the APCΔ468 mouse model of colon cancer. This could even include isolation and short term culture of tissue intestinal mast cells for analysis. Future studies with mast cell inhibitors are underway in our lab to further establish a role for mast cells in intestinal tumorigenesis in this model. Our data suggest that mast cells may represent a novel therapeutic target for prevention of intestinal tumors especially in those susceptible subjects who chronically consume alcohol.
Acknowledgments
Sources of support:
KK supported by Robert H. Lurie Comprehensive Cancer Center, Northwestern University. AK supported by RC2AA019405; AK and CBF supported by AA020216 and AW supported by a Diversity Supplement to AA020216.
Footnotes
CONFLICT OF INTERES
All authors declare no conflict of interest.
Contributor Information
Andre L. Wimberly, Rush University Department of Pharmacology, Chicago, IL 60612.
Christopher B. Forsyth, Department of Internal Medicine, Section of Gastroenterology. Rush University Medical Center, Chicago, IL 60612.
Mohammad Wasim Khan, Northwestern University, Robert H. Lurie Comprehensive Cancer Center, Chicago, IL 60611.
Alan Pemberton, Royal (Dick) School of Veterinary Studies, Roslin Institute, University of Edinburgh, Midlothian, UK EH259RG.
Khashayarsha Khazaie, Northwestern University, Robert H. Lurie Comprehensive Cancer Center, Chicago, IL 60611.
Ali Keshavarzian, Department of Internal Medicine, Division of Digestive Diseases, Rush University Medical Center, Chicago, IL 60612.
References
- Beaglehole R, Bonita R. Alcohol: a global health priority. Lancet. 2009;373:2173–2174. doi: 10.1016/S0140-6736(09)61168-5. [DOI] [PubMed] [Google Scholar]
- Blumenkrantz N, Asboe-Hansen G. Reaction of cationic groups of chlorpromazine with anionic macromolecules: complexes with DNA, RNA, hyaluronic acid and heparin. Acta Pharmacol Toxicol (Copenh) 1974;34:27–32. doi: 10.1111/j.1600-0773.1974.tb01553.x. [DOI] [PubMed] [Google Scholar]
- Boffetta P, Hashibe M. Alcohol and cancer. Lancet Oncol. 2006;7:149–156. doi: 10.1016/S1470-2045(06)70577-0. [DOI] [PubMed] [Google Scholar]
- Boutron MC, Faivre J, Dop MC, Quipourt V, Senesse P. Tobacco, alcohol, and colorectal tumors: a multistep process. Am J Epidemiol. 1995;141:1038–1046. [PubMed] [Google Scholar]
- Breslow NE, Enstrom JE. Geographic correlations between cancer mortality rates and alcohol-tobacco consumption in the United States. J Natl Cancer Inst. 1974;53:631–639. doi: 10.1093/jnci/53.3.631. [DOI] [PubMed] [Google Scholar]
- Cheon EC, Khazaie K, Khan MW, Strouch MJ, Krantz SB, Phillips J, Blatner NR, Hix LM, Zhang M, Dennis KL, Salabat MR, Heiferman M, Grippo PJ, Munshi HG, Gounaris E, Bentrem DJ. Mast cell 5-lipoxygenase activity promotes intestinal polyposis in APCDelta468 mice. Cancer Res. 2011;71:1627–1636. doi: 10.1158/0008-5472.CAN-10-1923. [DOI] [PubMed] [Google Scholar]
- Coussens LM, Raymond WW, Bergers G, Laig-Webster M, Behrendtsen O, Werb Z, Caughey GH, Hanahan D. Inflammatory mast cells up-regulate angiogenesis during squamous epithelial carcinogenesis. Genes Dev. 1999;13:1382–1397. doi: 10.1101/gad.13.11.1382. [DOI] [PMC free article] [PubMed] [Google Scholar]
- Coussens LM, Werb Z. Inflammation and cancer. Nature. 2002;420:860–867. doi: 10.1038/nature01322. [DOI] [PMC free article] [PubMed] [Google Scholar]
- Dalton DK, Noelle RJ. The roles of mast cells in anticancer immunity. Cancer Immunol Immunother. 2012 Apr 18; doi: 10.1007/s00262-012-1246-0. [Epub ahead of print] [DOI] [PMC free article] [PubMed] [Google Scholar]
- de la MHP, Lieber CS, DeCarli LM, French SW, Lindros KO, Jarvelainen H, Bode C, Parlesak A, Bode JC. Models of alcoholic liver disease in rodents: a critical evaluation. Alcohol Clin Exp Res. 2001;25:254S–261S. doi: 10.1097/00000374-200105051-00041. [DOI] [PubMed] [Google Scholar]
- Donohue TM, Jr, Curry-McCoy TV, Todero SL, White RL, Kharbanda KK, Nanji AA, Osna NA. L-Buthionine (S, R) sulfoximine depletes hepatic glutathione but protects against ethanol-induced liver injury. Alcohol Clin Exp Res. 2007;31:1053–1060. doi: 10.1111/j.1530-0277.2007.00393.x. [DOI] [PubMed] [Google Scholar]
- Forsyth CB, Tang Y, Shaikh M, Zhang L, Keshavarzian A. Alcohol Stimulates Activation of Snail, Epidermal Growth Factor Receptor Signaling, and Biomarkers of Epithelial-Mesenchymal Transition in Colon and Breast Cancer Cells. Alcohol Clin Exp Res. 2010;34:19–31. doi: 10.1111/j.1530-0277.2009.01061.x. [DOI] [PMC free article] [PubMed] [Google Scholar]
- Gounari F, Chang R, Cowan J, Guo Z, Dose M, Gounaris E, Khazaie K. Loss of adenomatous polyposis coli gene function disrupts thymic development. Nat Immunol. 2005;6:800–809. doi: 10.1038/ni1228. [DOI] [PMC free article] [PubMed] [Google Scholar]
- Gounaris E, Erdman SE, Restaino C, Gurish MF, Friend DS, Gounari F, Lee DM, Zhang G, Glickman JN, Shin K, Rao VP, Poutahidis T, Weissleder R, McNagny KM, Khazaie K. Mast cells are an essential hematopoietic component for polyp development. Proc Natl Acad Sci U S A. 2007;104:19977–19982. doi: 10.1073/pnas.0704620104. [DOI] [PMC free article] [PubMed] [Google Scholar]
- Gurish MF, Boyce JA. Mast cells: ontogeny, homing, and recruitment of a unique innate effector cell. J Allergy Clin Immunol. 2006;117:1285–1291. doi: 10.1016/j.jaci.2006.04.017. [DOI] [PubMed] [Google Scholar]
- Halberg RB, Waggoner J, Rasmussen K, White A, Clipson L, Prunuske AJ, Bacher JW, Sullivan R, Washington MK, Pitot HC, Petrini JH, Albertson DG, Dove WF. Long-lived Min mice develop advanced intestinal cancers through a genetically conservative pathway. Cancer Res. 2009;69:5768–5775. doi: 10.1158/0008-5472.CAN-09-0446. [DOI] [PMC free article] [PubMed] [Google Scholar]
- Huntley JF, Newlands GF, Gibson S, Ferguson A, Miller HR. Histochemical demonstration of chymotrypsin like serine esterases in mucosal mast cells in four species including man. J Clin Pathol. 1985;38:375–384. doi: 10.1136/jcp.38.4.375. [DOI] [PMC free article] [PubMed] [Google Scholar]
- Jeong HJ, Hong SH, Park RK, An NH, Kim HM. Ethanol induces the production of cytokines via the Ca2+, MAP kinase, HIF-1alpha, and NF-kappaB pathway. Life Sci. 2005;77:2179–2192. doi: 10.1016/j.lfs.2005.04.014. [DOI] [PubMed] [Google Scholar]
- Keshavarzian A, Farhadi A, Forsyth CB, Rangan J, Jakate S, Shaikh M, Banan A, Fields JZ. Evidence that chronic alcohol exposure promotes intestinal oxidative stress, intestinal hyperpermeability and endotoxemia prior to development of alcoholic steatohepatitis in rats. J Hepatol. 2009;50:538–547. doi: 10.1016/j.jhep.2008.10.028. [DOI] [PMC free article] [PubMed] [Google Scholar]
- Khazaie K, Blatner NR, Khan MW, Gounari F, Gounaris E, Dennis K, Bonertz A, Tsai FN, Strouch MJ, Cheon E, Phillips JD, Beckhove P, Bentrem DJ. The significant role of mast cells in cancer. Cancer Metastasis Rev. 2011;30:45–60. doi: 10.1007/s10555-011-9286-z. [DOI] [PubMed] [Google Scholar]
- Kiernan JA. Anionic counterstains. CSH Protoc. 2008;2008:pdb top51. doi: 10.1101/pdb.top51. [DOI] [PubMed] [Google Scholar]
- Kune GA, Vitetta L. Alcohol consumption and the etiology of colorectal cancer: a review of the scientific evidence from 1957 to 1991. Nutr Cancer. 1992;18:97–111. doi: 10.1080/01635589209514210. [DOI] [PubMed] [Google Scholar]
- Kwo PY, Ramchandani VA, O’Connor S, Amann D, Carr LG, Sandrasegaran K, Kopecky KK, Li TK. Gender differences in alcohol metabolism: relationship to liver volume and effect of adjusting for body mass. Gastroenterology. 1998;115:1552–1557. doi: 10.1016/s0016-5085(98)70035-6. [DOI] [PubMed] [Google Scholar]
- Leuratti C, Watson MA, Deag EJ, Welch A, Singh R, Gottschalg E, Marnett LJ, Atkin W, Day NE, Shuker DE, Bingham SA. Detection of malondialdehyde DNA adducts in human colorectal mucosa: relationship with diet and the presence of adenomas. Cancer Epidemiol Biomarkers Prev. 2002;11:267–273. [PubMed] [Google Scholar]
- Maltby S, Khazaie K, McNagny KM. Mast cells in tumor growth: angiogenesis, tissue remodelling and immune-modulation. Biochim Biophys Acta. 2009;1796:19–26. doi: 10.1016/j.bbcan.2009.02.001. [DOI] [PMC free article] [PubMed] [Google Scholar]
- Marone G, Florio G, Petraroli A, Triggiani M, de Paulis A. Human mast cells and basophils in HIV-1 infection. Trends Immunol. 2001;22:229–232. doi: 10.1016/s1471-4906(01)01903-2. [DOI] [PubMed] [Google Scholar]
- McNeil HP, Reynolds DS, Schiller V, Ghildyal N, Gurley DS, Austen KF, Stevens RL. Isolation, characterization, and transcription of the gene encoding mouse mast cell protease 7. Proc Natl Acad Sci U S A. 1992;89:11174–11178. doi: 10.1073/pnas.89.23.11174. [DOI] [PMC free article] [PubMed] [Google Scholar]
- Mendes LO, Amorim JP, Teixeira GR, Chuffa LG, Fioruci BA, Pimentel TA, de Mello W, Jr, Padovani CR, Pereira S, Martinez M, Pinheiro PF, Oliani SM, Martinez FE. Mast cells and ethanol consumption: interactions in the prostate, epididymis and testis of UChB rats. Am J Reprod Immunol. 2011;66:170–178. doi: 10.1111/j.1600-0897.2010.00958.x. [DOI] [PubMed] [Google Scholar]
- Nanji AA, Jokelainen K, Lau GK, Rahemtulla A, Tipoe GL, Polavarapu R, Lalani EN. Arginine reverses ethanol-induced inflammatory and fibrotic changes in liver despite continued ethanol administration. J Pharmacol Exp Ther. 2001;299:832–839. [PubMed] [Google Scholar]
- Nanji AA, Zhao S, Sadrzadeh SM, Dannenberg AJ, Tahan SR, Waxman DJ. Markedly enhanced cytochrome P450 2E1 induction and lipid peroxidation is associated with severe liver injury in fish oil-ethanol-fed rats. Alcohol Clin Exp Res. 1994;18:1280–1285. doi: 10.1111/j.1530-0277.1994.tb00119.x. [DOI] [PubMed] [Google Scholar]
- Noli C, Welle M, Scarampella F, Abramo F. Quantitative analysis of tryptase- and chymase-containing mast cells in eosinophilic conditions of cats. Vet Pathol. 2003;40:219–221. doi: 10.1354/vp.40-2-219. [DOI] [PubMed] [Google Scholar]
- Pemberton AD, Brown JK, Wright SH, Knight PA, McPhee ML, McEuen AR, Forse PA, Miller HR. Purification and characterization of mouse mast cell proteinase-2 and the differential expression and release of mouse mast cell proteinase-1 and -2 in vivo. Clin Exp Allergy. 2003;33:1005–1012. doi: 10.1046/j.1365-2222.2003.01720.x. [DOI] [PubMed] [Google Scholar]
- Pickhardt PJ, Kim DH. Colorectal cancer screening with CT colonography: key concepts regarding polyp prevalence, size, histology, morphology, and natural history. AJR Am J Roentgenol. 2009;193:40–46. doi: 10.2214/AJR.08.1709. [DOI] [PubMed] [Google Scholar]
- Pikarsky E, Porat RM, Stein I, Abramovitch R, Amit S, Kasem S, Gutkovich-Pyest E, Urieli-Shoval S, Galun E, Ben-Neriah Y. NF-kappaB functions as a tumour promoter in inflammation-associated cancer. Nature. 2004;431:461–466. doi: 10.1038/nature02924. [DOI] [PubMed] [Google Scholar]
- Rajamanickam S, Velmurugan B, Kaur M, Singh RP, Agarwal R. Chemoprevention of intestinal tumorigenesis in APCmin/+ mice by silibinin. Cancer Res. 2010;70:2368–2378. doi: 10.1158/0008-5472.CAN-09-3249. [DOI] [PMC free article] [PubMed] [Google Scholar]
- Rehm J, Mathers C, Popova S, Thavorncharoensap M, Teerawattananon Y, Patra J. Global burden of disease and injury and economic cost attributable to alcohol use and alcohol-use disorders. Lancet. 2009;373:2223–2233. doi: 10.1016/S0140-6736(09)60746-7. [DOI] [PubMed] [Google Scholar]
- Roy HK, Gulizia JM, Karolski WJ, Ratashak A, Sorrell MF, Tuma D. Ethanol promotes intestinal tumorigenesis in the MIN mouse. Multiple intestinal neoplasia. Cancer Epidemiol Biomarkers Prev. 2002;11:1499–1502. [PubMed] [Google Scholar]
- Scheppach W, Bingham S, Boutron-Ruault MC, Gerhardsson de Verdier M, Moreno V, Nagengast FM, Reifen R, Riboli E, Seitz HK, Wahrendorf J. WHO consensus statement on the role of nutrition in colorectal cancer. Eur J Cancer Prev. 1999;8:57–62. doi: 10.1097/00008469-199902000-00008. [DOI] [PubMed] [Google Scholar]
- Schutze M, Boeing H, Pischon T, Rehm J, Kehoe T, Gmel G, Olsen A, Tjonneland AM, Dahm CC, Overvad K, Clavel-Chapelon F, Boutron-Ruault MC, Trichopoulou A, Benetou V, Zylis D, Kaaks R, Rohrmann S, Palli D, Berrino F, Tumino R, Vineis P, Rodriguez L, Agudo A, Sanchez MJ, Dorronsoro M, Chirlaque MD, Barricarte A, Peeters PH, van Gils CH, Khaw KT, Wareham N, Allen NE, Key TJ, Boffetta P, Slimani N, Jenab M, Romaguera D, Wark PA, Riboli E, Bergmann MM. Alcohol attributable burden of incidence of cancer in eight European countries based on results from prospective cohort study. BMJ. 2011;342:d1584. doi: 10.1136/bmj.d1584. [DOI] [PMC free article] [PubMed] [Google Scholar]
- Seitz HK, Maurer B, Stickel F. Alcohol consumption and cancer of the gastrointestinal tract. Dig Dis. 2005;23:297–303. doi: 10.1159/000090177. [DOI] [PubMed] [Google Scholar]
- Seitz HK, Stickel F. Molecular mechanisms of alcohol-mediated carcinogenesis. Nat Rev Cancer. 2007;7:599–612. doi: 10.1038/nrc2191. [DOI] [PubMed] [Google Scholar]
- Seitz HK, Stickel F. Acetaldehyde as an underestimated risk factor for cancer development: role of genetics in ethanol metabolism. Genes Nutr. 2009 Oct 22; doi: 10.1007/s12263-009-0154-1. [Epub ahead of print] [DOI] [PMC free article] [PubMed] [Google Scholar]
- Siegel R, Ward E, Brawley O, Jemal A. Cancer statistics, 2011: the impact of eliminating socioeconomic and racial disparities on premature cancer deaths. CA Cancer J Clin. 2011;61(4):212–36. doi: 10.3322/caac.20121. [DOI] [PubMed] [Google Scholar]
- Tanaka T, Kurai K, Kunitoh S, Kondo K, Goto Y, Kawai S, Warashina M, Yamashita T, Toda T, Monna T, et al. Gender-related differences in the inhibitory effect on liver regeneration in alcohol-treated rats: study of polyamine metabolism. Alcohol Alcohol Suppl. 1993;1A:15–20. doi: 10.1093/alcalc/28.supplement_1a.15. [DOI] [PubMed] [Google Scholar]
- Thomasson HR. Gender differences in alcohol metabolism. Physiological responses to ethanol. Recent Dev Alcohol. 1995;12:163–179. doi: 10.1007/0-306-47138-8_9. [DOI] [PubMed] [Google Scholar]
- Tipoe GL, Liong EC, Casey CA, Donohue TM, Jr, Eagon PK, So H, Leung TM, Fogt F, Nanji AA. A voluntary oral ethanol-feeding rat model associated with necroinflammatory liver injury. Alcohol Clin Exp Res. 2008;32:669–682. doi: 10.1111/j.1530-0277.2008.00623.x. [DOI] [PubMed] [Google Scholar]
- Tosetti F, Ferrari N, De Flora S, Albini A. Angioprevention’: angiogenesis is a common and key target for cancer chemopreventive agents. Faseb J. 2002;16:2–14. doi: 10.1096/fj.01-0300rev. [DOI] [PubMed] [Google Scholar]
- Yamada Y, Mori H. Multistep carcinogenesis of the colon in Apc(Min/+) mouse. Cancer Sci. 2007;98:6–10. doi: 10.1111/j.1349-7006.2006.00348.x. [DOI] [PMC free article] [PubMed] [Google Scholar]
- Yokoyama A, Muramatsu T, Ohmori T, Yokoyama T, Okuyama K, Takahashi H, Hasegawa Y, Higuchi S, Maruyama K, Shirakura K, Ishii H. Alcohol-related cancers and aldehyde dehydrogenase-2 in Japanese alcoholics. Carcinogenesis. 1998;19:1383–1387. doi: 10.1093/carcin/19.8.1383. [DOI] [PubMed] [Google Scholar]
- Zhu FG, Gomi K, Marshall JS. Short-term and long-term cytokine release by mouse bone marrow mast cells and the differentiated KU-812 cell line are inhibited by brefeldin A. J Immunol. 1998;161:2541–2551. [PubMed] [Google Scholar]


