

Abstract
Replacement of retinal pigment epithelium (RPE) cells by transplantation is a potential treatment for some retinal degenerations. Here, we used a combination of invasive and noninvasive methods to characterize the structural and functional consequences of subretinal injection of RPE cells. Pigmented cells from primary cultures were injected into albino mice. Recovery was monitored over 8 weeks by fundus imaging, spectral domain optical coherence tomography (sdOCT), histology, and electroretinography (ERG). sdOCT showed that retinal reattachment was nearly complete by 1 week. ERG response amplitudes were reduced after injection, with cone-mediated function then recovering better than rod function. Photoreceptor cell loss was evident by sdOCT and histology, near the site of injection, and is likely to have been the main cause of incomplete recovery. With microscopy, injected cells were identified by the presence of apical melanosomes. They either established contact with Bruch’s membrane, and thus became part of the RPE monolayer, or were located on the apical surface of the host’s cells, resulting in apposition of the basal surface of the injected cell with the apical surface of the host cell and the formation of a series of desmosomal junctions. RPE cell density was not increased, indicating that the incorporation of an injected cell into the RPE monolayer was concomitant with the loss of a host cell. The transplanted and remaining host cells contained large vacuoles of ingested debris as well as lipofuscin-like granules, suggesting that they had scavenged the excess injected and host cells, and were stressed by the high digestive load. Therefore, although significant functional and structural recovery was observed, the consequences of this digestive stress may be a concern for longer-term health, especially where RPE cell transplantation is used to treat diseases that include lipofuscin accumulation as part of their pathology.
Keywords: Retina, Spectral domain optical coherence tomography, Cell transplantation, Lipofuscin, Electroretinography
Introduction
The transplantation of healthy cells to replace diseased or lost cells offers a potential treatment for a variety of forms of retinal degeneration (reviewed in Lamba et al., 2009). To replace photoreceptor or retinal pigment epithelium (RPE) cells, cells need to be transplanted into the subretinal space; that is, the space between these two cell layers. Subretinal injections result in retinal detachment, which must be followed by successful reattachment. Compared with the injection of a solution, after which the retina can be immediately reattached (Timmers et al., 2001), the recovery of a retina following the injection of cells is a greater challenge. Experiments with the injection of RPE cells for treating rodent models of retinal degeneration have been reported, describing moderate success (Li & Turner, 1988a; Sheedlo et al., 1989; Lund et al., 2001; Gouras et al., 2002; Arai et al., 2004; Lu et al., 2009). However, reports of the consequences of the cell injection procedure on retinal structure and function have been limited.
In the present study, a major goal was to assess the extent of initial retinal damage and the time course of recovery following injection of RPE cells into the subretinal space of mouse eyes. Structural and functional recovery was assessed noninvasively using spectral domain optical coherence tomography (sdOCT), which has only recently been adapted for use in the mouse (Ruggeri et al., 2007; Fischer et al., 2009; Huber et al., 2009; Cebulla et al., 2010; Gabriele et al., 2010), and electroretinography (ERG). Microscopy was also performed. A second goal of this study was to study how the injected RPE cells are incorporated into the host retina. By electron microscopy, we provide new insight into interactions between transplanted and host RPE cells.
Materials and methods
Animals
All experiments were performed in accordance with the guidelines established by the Animal Research Committee of the University of California in Los Angeles. Mice were maintained on a 12-h light/12-h dark cycle with 30–80 lux fluorescence lighting during the light phase. 129Sv wild-type mice at postnatal day 12 (P12) were used for the production of primary RPE cell cultures, as described previously (Gibbs & Williams, 2003). BALB/c albino wild-type mice (32 or 65 days old) were used as recipients for subretinal injections. Injected mice were immunosuppressed with cyclosporine (Sigma, St. Louis, MO) at a final concentration of 10 mg/kg body weight in their drinking water.
Injection technique
RPE cells that had been in primary culture for 1 week (Gibbs & Williams, 2003) were used for subretinal injections. To harvest cells from culture, the medium was removed; the cells were washed briefly with phosphate buffered saline (PBS) and incubated in buffered trypsin (0.25% with 1 mM EDTA in Hank’s Balanced Salt Solution) for 1 min at 37°C. Cells were removed from the plastic culture dish by adding 1 ml of growth medium [Dulbecco’s Modified Eagle’s Medium with 4.5 g/l glucose (Invitrogen, Grand Island, NY)], plus 0.1 g/l penicillin/streptomycin, 2 mM L-glutamine, 110 mg/l sodium pyruvate, 10% bovine fetal calf serum (FCS), and 1x Minimum Essential Medium Eagle (MEM) nonessential amino acids per well (Gibbs & Williams, 2003), pooled and collected in a pellet by centrifugation for 5 min at 1000 rpm. Cells were washed three times in PBS to remove all residue of trypsin. After the final centrifugation step, the pellet was resuspended in PBS to a final concentration of 30,000 cells/μl. Cells were injected using a NanoFil™ submicroliter injection system (World Precision Instruments, Sarasota, FL), while a surgical microscope was used for fundus visualization. Pupils were dilated with 1% (w/v) atropine sulfate in saline solution. A local anesthetic (0.5% proparacaine hydrochloride) was administered. A sclerotomy was performed approximately 1 mm posterior from the limbus with a 27G beveled needle. This needle was inserted to approximately 75% of its full length, avoiding the lens. Upon its withdrawal, a 33G blunt-end injection cannula attached to the microsyringe pump was inserted through the sclerotomy and tilted at approximately 45 deg in a tangential direction, pointing towards the posterior pole of the eye. Full insertion of the blunt-end cannula resulted in penetration of the subretinal matrix in direct proximity of the optic nerve head. One microliter of PBS, containing ~30,000 RPE cells, was injected into the subretinal space.
Fundus imaging
Fundus images were obtained using the Micron II retinal imaging microscope (Phoenix Research Laboratories, Inc., Pleasanton, CA). Mice were anesthetized with an intraperitonal injection of normal saline solution containing ketamine (15 mg/g) and xylazine (7 mg/g body weight). Pupil dilation was accomplished by adding a drop of 1% atropine sulfate. The mouse was placed on a movable platform so that the eye could be aligned with the axis of the camera and the objective lens set was positioned so that it touched the corneal surface (corneal applanation). A drop of methylcellulose (2.5%) was placed on the corneal surface. The illuminating light source was broadband but filtered to produce light between 400 and 700 nm. Serial images were recorded to document the change in retinal and ocular appearance over the course of the study. Fundus images were exported as 1924 × 768 pixels 24-bit colored portable network graphics files.
Spectral domain optical coherence tomography
Ultra high-resolution sdOCT imaging was performed with a commercially available sdOCT system (Bioptigen, Research Triangle Park, NC). Mice were anesthetized and pupils dilated as described above. Recordings were made with a 50 deg field of view, yielding an image 1.5 mm in diameter. En face view C-scans were recorded, each consisting of 100 two-dimensional B-scans. sdOCT scans were recorded immediately after injection, at 1 and 4 days, and at 1, 2, 3, 4, and 8 weeks after injection in the same mouse. Resulting images were exported as 640 × 480 pixel 8-bit gray bitmap files and processed in Adobe Photoshop CS3.
Retinal layer thickness measurements were made with an on-screen caliper supplied by the manufacturer of the sdOCT and calibrated for the mouse eye. Retinal thickness was measured from the outer edge of the nerve fiber layer to the band identified as the RPE, a measurement hereafter referred to as the total retinal thickness. Thickness measurements were made in the region showing the largest retinal detachment following injection; subsequent measurements in the same mouse were made in exactly the same location, using the distance from the optic nerve head as a reference and using the on-screen caliper as the measuring device.
Electroretinography
Electroretinography was performed as previously described (Nusinowitz et al., 2007). Briefly, after overnight dark adaptation, ERGs were recorded from the corneal surface of the injected eye using a gold loop electrode referenced to a similar gold wire in the mouth. A needle electrode in the tail served as the ground. All stimuli were presented in a large integrating sphere coated with highly reflective white matte paint (#6080; Eastman Kodak Corporation, Rochester, NY). A photic stimulator (Model PS33 Plus; Grass-Telefactor, West Warwick, RI) affixed to the outside of the sphere illuminated its interior with brief flashes of light. Responses were amplified 10,000 times (Grass P511 High Performance AC Amplifier), band-pass filtered (0.1–300 Hz), digitized using an I/O board (PCI-6221; National Instruments, Austin, TX) in a personal computer, and averaged. Rod-mediated responses were recorded to blue flashes (Wratten 47A; λmax = 470 nm) with an intensity held constant at 0.337 log cd-s/m2. Cone-mediated responses were obtained with a white flash (5.00 log cd-s/m2) on a rod-saturating background (32 cd/m2). All stimuli were presented at 1 Hz except for the brightest flashes where the presentation rate was slowed to 0.2 Hz.
Microscopy
Eyes were enucleated at 4 or 8 weeks after injection and processed for histology. Whole eyes were fixed in a mixture of 2% glutaraldeyhde, 2% paraformaldehyde in 0.1 M cacodylate buffer (pH 7.4). After dissection to generate posterior eyecups, tissues were postfixed in 2% osmium tetroxide in 0.1 M cacodylate buffer and processed for embedment in Epon. Semithin sections were stained with toluidine blue for light microscopy, and ultrathin sections were stained with uranyl acetate and lead citrate for transmission electron microscopy.
Results
Transvitreal injection of RPE cells into the subretinal space
RPE cells were obtained from 1-week old primary cultures, in which the cells were almost confluent and contained robust pigmentation (Fig. 1). They were washed and resuspended in saline buffer for injection. The viability of the dissociated cells was confirmed by seeding some in a new well and observing that they attached and survived. Fig. 2A and 2B shows fundus images of a representative retina before and immediately after injection. The postinjection fundus image shows scattered patches of pigmented cells throughout the retina. Following dissection up to 8 weeks after injection, pigmented cells were observed scattered throughout the eyecups (Fig. 2C and 2D). In some cases, cells were evident in the vitreous (arrowhead in Fig. 2B), possibly due to reflux from the subretinal space as the needle was retracted.
Fig. 1.

RPE cells cultured under growth conditions for 1 week. Image shows a typical cell culture dish with almost confluent heavily pigmented 129SV-derived RPE cells after 1 week in culture. Cells at this stage were harvested for injection. Scale bar = 100 μm.
Fig. 2.

Visualization of injected cells. Representative fundus image of an adult Balb/c albino mouse before (A) and immediately after (B) cell injection. The postinjection fundus image (B) shows scattered patches of pigmented cells distributed throughout the posterior pole including pigmented clusters of cells (arrows) that appear to lie at the retina–vitreous interface, and a large clump (arrowhead) that appears to have refluxed back into the vitreous when the injection needle was retracted. Enucleated eyecups are shown at 4 weeks (C, back of the eyecup) and 8 weeks (D, interior of the eyecup, with lens removed) after injection. Pigmented cells can be seen scattered throughout the eyecups. In each of (A–D), the optic nerve head is identified by an asterisk.
Noninvasive monitoring of initial detachment with sdOCT
The subretinal injection of RPE cells resulted in a local retinal detachment that was evident by sdOCT. Fig. 3 shows a series of sdOCT images, illustrating the injection site in two different retinas, as examples. Immediately after injection, a significant bleb was evident, with the injected cells visible as lighter areas within the bleb (Fig. 3A and 3B, asterisks). One week later, the original bleb was significantly reduced, although small regions of detachment remained (Fig. 3C and 3D). At 4 weeks, most mice showed no evidence of retinal detachment (Fig. 3E and 3F). By 8 weeks postinjection, the retinal detachment was completely resolved in most animals (Fig. 3G and 3H). Among different animals, the size of the initial bleb varied, ranging from approximately 10 to 50% of the retina, even though the same injection parameters (total volume, number of cells, flow rate of injection) were maintained. No correlation between bleb size and age (P32 or p65) was evident.
Fig. 3.

sdOCT images of two injected eyes over a time course of 8 weeks. Eyes were imaged with five individual scans of the central retina as well as the superior, anterior, inferior, and posterior regions. The area of the initial bleb formation is shown. The images of one eye are on the left, and those of the other eye are on the right. Scans were made immediately after cell injection (A, B), with follow-up scans 1 week (C, D), 4 weeks (E, F), and 8 weeks (G, H) later. Immediately after cell injection, a distinct bleb with substantial retinal detachment appears. Injected RPE cells are visible as lighter areas within the bleb (asterisks in A and B). One week after injection, the initial bleb has dissolved and retinal layers have settled back onto the RPE layer; however, areas of retinal detachment are still evident (arrows in C, D). Four weeks after injection, the retina appears normal, without evident retinal detachment. However, the somewhat distorted image quality in (E) could be a sign of obstructing vitreal accumulation of cells or fiuid. Eight weeks postinjection, both retinas appear normal with no persisting sign of damage caused by the procedure (G, H). RPE, retinal pigment epithelium; IS/OS, photoreceptor inner and outer segments, respectively; OLM, outer limiting membrane; ONL, outer nuclear layer; OPL, outer plexiform layer; INL, inner nuclear layer; IPL, inner plexiform layer; GCL, ganglion cell layer. Scale bar = 300 μm.
A comparison of sdOCT images before and after injection suggested that many retinas became slightly thinner at the injection site. Retinal thickness measurements, including all retinal layers from the vitreal surface to the basal RPE, were made at the same locations within and outside of the injection site before and at various times after injection. They showed that, 8 weeks after injection, total retinal thickness was reduced by an average of ~13% within 0.1 mm of the injection site, but it remained unchanged in other areas. In a few extreme examples, the thinning was associated with disturbances in the reflectance bands associated with all retinal layers. Fig. 4 shows an example of an sdOCT retinal cross-section image taken prior to injection and one taken at 8 weeks after injection. In this case, severe thinning of the nerve fiber layer and the inner plexiform layer is evident in a very focused area (Fig. 4B).
Fig. 4.
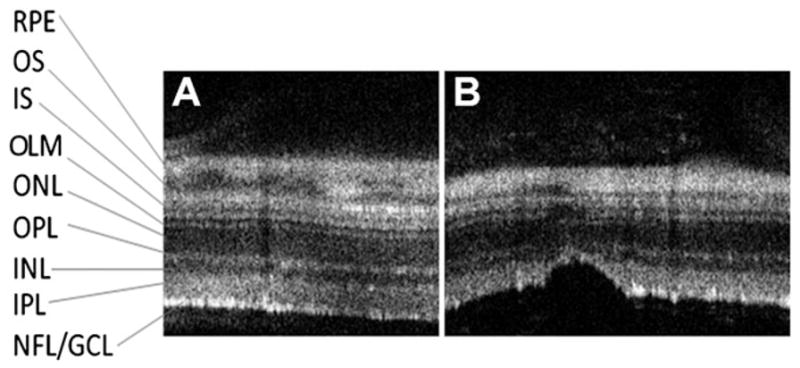
sdOCT comparison of an injection site after 8 weeks. Representative sdOCT retinal cross-sections at baseline (left panel) and at the same location 8 weeks after injection (right panel). Note the structural changes at the injection site and the apparent thinning of the retina. RPE, retinal pigment epithelium; OS, photoreceptor outer segments; IS, photoreceptor inner segments; OLM, outer limiting membrane; ONL, outer nuclear layer; OPL, outer plexiform layer; INL, inner nuclear layer; IPL, inner plexiform layer; GCL, ganglion cell layer.
Full-field ERG analysis
Retinal function was evaluated by ERG and summarized in Fig. 5. The mean ERG response elicited by our brightest flash intensity under dark- and light-adapted conditions is shown at baseline (prior to injection) and at 1 and 8 weeks after injection. Response amplitudes under dark-adapted conditions were reduced significantly 1 week after injection compared to baseline. Unlike the observations made by sdOCT, we observed a difference between the two age groups, with the younger group (P32) showing a larger decline in mean amplitude (z = −2.52, P = 0.012 and z = −1.83, P = 0.068, for P32 and P65, respectively). The dark-adapted ERG tended to improve over time, but even 8 weeks postinjection, ERG amplitudes remained significantly smaller than the preinjection baseline measures (z = −2.52, P = 0.012 and z = −1.83, P = 0.068, for P32 and P65, respectively.) The light-adapted ERG, mediated by cones, was much less affected by the injection. While ERG amplitudes were modestly reduced at 1-week postinjection (z = −2.52, P = 0.012 and z = −2.02, P = 0.043 for the P32 and P65 groups, respectively), cone ERG function showed complete recovery after 8 weeks (z = −1.01, P = 0.31 and z = 0.944, P = 0.345, for P32 and P65, respectively).
Fig. 5.

Retinal function as assessed by electroretinography (ERG). (A) Dark-adapted ERG responses evoked by a short-wavelength flash (0.337 cd-s/m2) presumed to reflect mainly rod-mediated function. (B) Light-adapted (cone-mediated) ERG responses evoked by a white flash (5.00 cd-s/m2) on a rod-saturating background (32.0 cd/m2). Electroretinography was performed serially on mice that received injections at either postnatal day 32 (P32) or at postnatal day 65 (P65). ERGs were recorded prior to injections (time indicated by the vertical dashed line) and then again at 1, 4, and 8 weeks after injection. The same mice were used for both dark- and light-adapted ERG recordings. Error bars indicate ±S.E.M.
Light microscopy
Semithin sections of retinas from mice 8 weeks after injection were examined by light microscopy. Retinas were found to contain extensive regions of pigmented cells in their RPE layer, suggesting that the transplanted cells (originating from pigmented mice) had spread beyond the site of injection and had integrated into the host RPE over relatively large regions (Fig. 6A–6E). Near the site of injection, some retinal damage was evident. Photoreceptor cell loss, as indicated by fewer rows of cells in the photoreceptor nuclear layer, was somewhat more widespread than the focused thinning observed by sdOCT but still relatively localized to the site of injection. In this region of cell loss, the RPE was typically thicker and more than one layer of cells was evident (Fig. 6F). Near the edge of the retina, there were no pigmented RPE cells (Fig. 6G).
Fig. 6.

Histological analysis of retinal morphology after injection. Micrographs of semithin sections from eyes, 8 weeks after injection. (A–E) Different regions of retinas showing pigment-containing RPE cells that appear to have integrated into the RPE monolayer of the host retina. At least some of the cells contain normal functioning melanosomes, evident by the presence of melanosomes in the apical processes (and adjacent to the tips of the outer segments). (F) Region of a retina near the site of injection showing perturbed outer segments and more than one layer of RPE cells. (G) Region of the far peripheral region of a retina. This region has been unaffected by the injection and remains a normal albino retina. RPE, retinal pigment epithelium; OS, photoreceptor outer segments; IS, photoreceptor inner segments; ONL, outer (i.e., photoreceptor) nuclear layer. Scale bar = 25 μm.
To determine the extent of transplantation across the retina, we scored cells along complete retinal sections, passing near the center of the retina, as to whether they were pigmented, and whether melanosomes could be identified in the apical processes. The rationale for identifying melanosomes in the apical processes is that these melanosomes are a better indicator of endogenous melanosomes. Melanosomes in the cell body could have originated from ingestion of an injected cell or its debris by a host cell and be contained within a phagocytic vacuole (see below). However, to be located in the apical region of the RPE, a melanosome must be subject to a dynamic motility process that requires its membrane to be exposed to the cytosol. To be moved into the apical RPE, RAB27A must first associate with the membrane of the melansosome. RAB27A links the melanosome (via the protein, MYRIP) to MYO7A, an actin-based motor that drives the movement of melanosomes into the apical region through the apical meshwork of actin filaments (Liu et al., 1998; Futter et al., 2004; Gibbs et al., 2004).
The result of scoring individual RPE cells in sections of one injected retina, 8 weeks after injection, is depicted in Fig. 7. No melanosomes were detected in the far periphery of the injected retina, indicating that this region of the retina was unaffected (see also Fig. 6G). A mean of 64% of the cells counted were found to contain melanosomes (black and gray cells), with 50% of these melanosome-containing cells (i.e., 32% of the total cells) demonstrating melanosomes in the apical processes (gray cells).
Fig. 7.
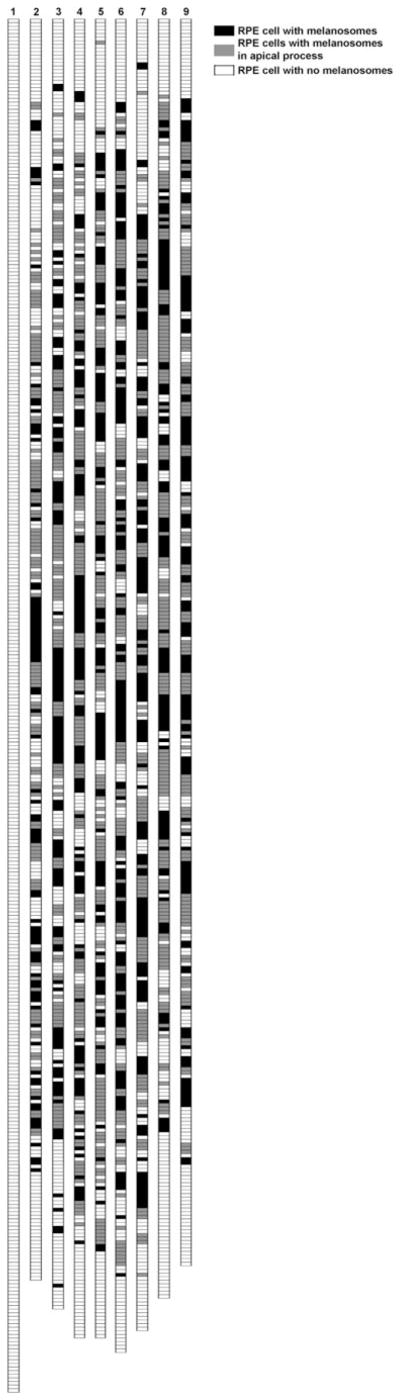
Pigmentation of RPE cells. Each strip represents the RPE cells in one section, extending from ora serrata to ora serrata and passing near the center of a retina. Cells were determined to contain melanosomes in the cell body only (black), in the apical processes (gray), or not at all (white). The left strip represents a section from an albino retina that was not injected. The other strips represent sections from a single injected retina; the sections are spaced at least 10 μm from each other.
Electron microscopy
The pigmentation evident by light microscopy suggested that the RPE cell transplantation was quite extensive, and except for near the site of injection, where more than one layer of RPE cells was clearly evident, the RPE appeared quite normal. By electron microscopy, we first determined the density of the resulting RPE cell layer. We found that the injected retinas contained 7.8 ± 0.6 cells per 100 μm, which compares to the 8.4 ± 0.2 cells per 100 μm in noninjected retinas. Only cells that made contact with Bruch’s membrane were counted. For this result to be consistent with the observations of light microscopy, either many of the host RPE cells were replaced by injected RPE cells, the injected cells did not integrate fully into the RPE monolayer (and thus make contact with Bruch’s membrane), or host cells internalized melanosomes by ingesting injected cells or their debris. Our observations by electron microscopy suggested that each of these three occurred.
Some cells that extended from Bruch’s membrane to the outer segments contained individual melanosomes, which, in some cases, were present in the apical processes (Fig. 8A), suggesting that they originated from the injected cells. These cells may have replaced host RPE cells that were dislodged from Bruch’s membrane during the retinal detachment, as shown previously with injections of cells into the subretinal space (Lopez et al., 1987; Li & Turner, 1988a). However, some of the transplanted cells formed a second layer between the apical surface of the host RPE and the outer segments (Fig. 8B). In these cases, the basal surface of the injected cell and the apical surface of the host cell became flattened, and the two membranes apposed each other and included a series of desmosomal junctions (Fig. 9A and 9B). In both cases, whether the transplanted cell established itself on Bruch’s membrane, or on the apical surface of a host cell, its apical surface showed typical RPE processes that extended between the outer segments (Figs. 8A, 8B, 9A, and 9C), and the cells appeared to be polarized normally. Although the cells that formed a second layer did not make contact with a basement membrane and did not develop basal infoldings, their mitochondria were localized basally, and some of their melanosomes were present in apical processes (Figs. 8B, 9A, and 9B).
Fig. 8.

Electron micrographs of the RPE layer after injection. (A) An RPE cell that extends from Bruch’s membrane (BM) to the photoreceptor outer segments (OS) and appears to be a transplanted cell, based on the presence of individual melanosomes that are scattered throughout the cell, including the apical region. (B) A region where injected cells have been transplanted on to the apical surface of a host RPE cells. Small arrowheads indicate the junction of the host and transplanted cells, which, together, now form a bilayer. Large arrowheads indicate clusters of melanosomes that appear to have been ingested by host RPE cells. Note that the transplanted cells are well polarized, with melanosomes in their elaborate apical processes and mitochondria along the basal border. (C, D) Host (albino) RPE cells in a retina that was injected with RPE cells (and contains transplanted cells elsewhere). Lipofuscin-like granules (arrows) are evident in the transplanted cells in (A) and (B) and in the host cells shown in (C) and (D). Scale bar = 2 μm.
Fig. 9.

Electron micrographs of the RPE layer after injection. (A) The boundary between two RPE cells, one (lower) that possesses apical processes that interdigitate around the tips of photoreceptor outer segments and one (upper) whose apical surface abuts the basal surface of the lower cell. The lower cell appears to have originated from the population of injected cells (note melanosome in lower right). Desmosomes (arrowheads) are evident along the junction of the two cells. Scale bar = 2 μm. (B) Higher magnifications of boundary between two RPE cells, where one cell resides on top of the other. Arrowheads indicated desmosomes. Scale bar = 200 nm. (C) Apical region of an RPE cell containing melanosomes that displays normal orientation and localization, indicating that this cell originated from the population of injected cells. AP, apical processes. Scale bar = 1 μm. (D) Melanosomes and cellular debris that appear to be clustered in a phagocytic vacuole within a host RPE cell. Scale bar = 500 nm.
Cells that contained clusters of melanosomes and cellular debris were also observed (Fig. 9D). Light microscopy suggested that these cells were normally pigmented transplanted cells. However, electron microscopy suggests that they were likely host cells that had ingested injected pigmented cells or their debris. In Fig. 8B, for example, the melanosomes indicated by large arrowheads appear to be nearly all clustered within a phagocytic vacuole. Interestingly, most of the transplanted cells and original host cells contained lipofuscin-like granules (e.g., arrows in Fig. 8A–8D), suggesting that they had been challenged with excessive demands for degradation of internalized products.
Discussion
Using a combination of noninvasive and invasive methods, we have monitored retinal structure and function following the subretinal injection of RPE cells. Recovery from the initial retinal detachment was observed in live animals, and the resulting transplantation was analyzed by light and electron microscopy.
We injected cultured RPE cells to mimic biological conditions currently under investigation for cell replacement strategies (e.g., Lund et al., 2001; Seiler et al., 2010). In the future, stem cell-derived RPE cells will be a common source for transplantation, and these will likely be grown in confluent culture prior to injection, not unlike the cells used in the present study. After each injection, a bleb of retinal detachment was evident by sdOCT. This noninvasive approach, which has relatively recently been adapted for use with mouse eyes (Ruggeri et al., 2007; Fischer et al., 2009; Huber et al., 2009; Cebulla et al., 2010; Gabriele et al., 2010), allowed us to monitor the reattachment process in each eye. Reattachment took significantly longer than the ~1 day reported previously for fluid injections (Timmers et al., 2001). The time taken for reattachment is likely to be an important parameter in the recovery of retinal structure and function and is likely to be responsible for the permanent structural and functional losses we observed in many retinas.
Comprehensive data from the cat retina show that the RPE–photoreceptor interface and the inner retina undergo significant structural changes after retinal detachment, and that the severity of these changes depends on the extent of the detachment (Anderson et al., 1983). In particular, proliferation of the RPE has been observed within the detachment bleb during the first days of detachment (Anderson et al., 1981), and areas where this proliferation has occurred are evident after reattachment (Anderson et al., 1986). In the present study, RPE proliferation may have contributed to the perturbed organization of the RPE and limited outer segment recovery that was evident near the site of injection (as in Fig. 6F), although, even in these regions, we observed cells with apical melanosomes, indicating that they had not resulted from proliferation of the host RPE, which was albino.
Consistent with the structural changes that were observed, rod-and cone-mediated retinal functions, as assayed with full-field ERGs, were also compromised after injection. Disruption of the circulating current in the outer retina due to the separation of the photoreceptors from the RPE is likely to have contributed to the decrease in function shortly after injection. However, the lack of full recovery of rod photoreceptor function by 8 weeks post-injection is likely due to photoreceptor cell loss, especially near the site of injection.
In contrast to rod-mediated function, cone-mediated function recovered almost completely. Following transplantation of RPE cells into the Royal College of Surgeons (RCS) rat retina, a previous study also observed different effects on cone and rod function (Pinilla et al., 2005). Cone function may be less affected since their visual pigment can be cycled through Müller cells, and thus, they are less dependent on an intimate relationship with the RPE (Mata et al., 2002).
In studying the fate of the injected cells by light and electron microscopy, we determined that some of the injected cells appeared to have established contact with Bruch’s membrane, while others formed a second layer by resting on the apical surface of the host’s cells, thus confirming interpretations from some earlier studies (Li & Turner, 1988b, 1991; Sheedlo et al., 1991; Zhang & Bok, 1998). Since cell density was not altered, cells that were transplanted on to Bruch’s membrane are likely to have filled spaces left by host cells that were dislodged during the injection and detachment of the retina. Images of patches of denuded Bruch’s membrane, immediately after injection, have been shown previously (Lopez et al., 1987; Li & Turner, 1988a).
Electron microscopy also indicated that the cells of the “new” RPE had undergone a heavy digestive load. Both host and transplanted cells contained numerous lipofuscin granules, and host cells, in particular, had large phagocytic vacuoles containing debris, including melanosomes, which were probably from injected cells (some of which may have become lysed during preparation or injection). Presumably, ingestion of dislodged host cells also contributed to this digestive load. The ingestion of melanosomes by host cells resulted in large areas of what appeared, by light microscopy, to be contiguous pigmented (and therefore transplanted) RPE cells; in fact, these areas were a mixture of transplanted and host cells.
The observation of abnormal numbers of lipofuscin-like granules indicates that the demand for degradation of the large amount of internalized products was deleterious. This may be of particular relevance to proposed treatments by RPE cell transplantation of retinal disease that is characterized by an abnormal accumulation of lipofuscin, such as Stargardt macular degeneration (Weng et al., 1999; Lu et al., 2009).
In an additional observation, we found where injected cells established themselves on top of the host RPE cells, rather than on Bruch’s membrane, the interacting surface membranes change their shape—the basal infoldings of the injected cell and the apical microvilli of the host cell are lost—and they appose each other with desmosome junctions. The resulting bilayer interfaces with Bruch’s membrane and interdigitates with the outer segments in the same manner as a normal RPE, which is a monolayer. However, the effect of a bilayer on RPE physiology is unclear.
In conclusion, we show by noninvasive structural and functional monitoring as well as conventional microscopy that the injection of RPE cells into the subretinal space can be quite disruptive. The retina remains detached for a significantly longer period than that described for the injection of fluid. This detachment was monitored by sdOCT and shown to affect retinal electrophysiology adversely. However, retinas showed structural and functional recovery after the injection, as well as the successful integration of injected cells into the host RPE layer. A concern is raised over the presence of lipofuscin granules in the resulting RPE cells, particularly with respect to the use of RPE cell transplantation for treatment of retinal diseases that include lipofuscin accumulation as part of their pathology.
Acknowledgments
The authors thank Douglas Yasumura and Michael Matthes (Beckman Vision Center, University of California, San Francisco) for expert technical advice. We also thank Gabriel Travis, Dean Bok, Xanjie Yang (Jules Stein Eye Institute, UCLA), and Guoping Fan (Department of Human Genetics, UCLA) for valuable discussions. This study was funded by the California Institute of Regenerative Medicine (CIRM TR1-01272), NIH Core Grant 2P30EY000331, and NIH Grant 5R01EY007042. D.S.W. is a Jules and Doris Stein RPB Professor.
References
- Anderson DH, Guerin CJ, Erickson PA, Stern WH, Fisher SK. Morphological recovery in the reattached retina. Investigative Ophthalmology & Visual Science. 1986;27:168–183. [PubMed] [Google Scholar]
- Anderson DH, Stern WH, Fisher SK, Erickson PA, Borgula GA. The onset of pigment epithelial proliferation after retinal detachment. Investigative Ophthalmology & Visual Science. 1981;21:10–16. [PubMed] [Google Scholar]
- Anderson DH, Stern WH, Fisher SK, Erickson PA, Borgula GA. Retinal detachment in the cat: The pigment epithelial-photoreceptor interface. Investigative Ophthalmology & Visual Science. 1983;24:906–926. [PubMed] [Google Scholar]
- Arai S, Thomas BB, Seiler MJ, Aramant RB, Qiu G, Mui C, de Juan E, Sadda SR. Restoration of visual responses following transplantation of intact retinal sheets in rd mice. Experimental Eye Research. 2004;79:331–341. doi: 10.1016/j.exer.2004.05.013. [DOI] [PubMed] [Google Scholar]
- Cebulla CM, Ruggeri M, Murray TG, Feuer WJ, Hernandez E. Spectral domain optical coherence tomography in a murine retinal detachment model. Experimental Eye Research. 2010;90:521–527. doi: 10.1016/j.exer.2010.01.008. [DOI] [PMC free article] [PubMed] [Google Scholar]
- Fischer MD, Huber G, Beck SC, Tanimoto N, Muehlfriedel R, Fahl E, Grimm C, Wenzel A, Reme CE, van de Pavert SA, Wijnholds J, Pacal M, Bremner R, Seeliger MW. Noninvasive, in vivo assessment of mouse retinal structure using optical coherence tomography. PLoS One. 2009;4:e7507. doi: 10.1371/journal.pone.0007507. [DOI] [PMC free article] [PubMed] [Google Scholar]
- Futter CE, Ramalho JS, Jaissle GB, Seeliger MW, Seabra MC. The role of Rab27a in the regulation of melanosome distribution within retinal pigment epithelial cells. Molecular Biology of the Cell. 2004;15:2264–2275. doi: 10.1091/mbc.E03-10-0772. [DOI] [PMC free article] [PubMed] [Google Scholar]
- Gabriele ML, Ishikawa H, Schuman JS, Bilonick RA, Kim JS, Kagemann L, Wollstein G. Reproducibility of spectral-domain optical coherence tomography total retinal thickness measurements in mice. Investigative Ophthalmology & Visual Science. 2010;51 (12):6519–6523. doi: 10.1167/iovs.10-5662. [DOI] [PMC free article] [PubMed] [Google Scholar]
- Gibbs D, Azarian SM, Lillo C, Kitamoto J, Klomp AE, Steel KP, Libby RT, Williams DS. Role of myosin VIIa and Rab27a in the motility and localization of RPE melanosomes. Journal of Cell Science. 2004;117:6473–6483. doi: 10.1242/jcs.01580. [DOI] [PMC free article] [PubMed] [Google Scholar]
- Gibbs D, Williams DS. Isolation and culture of primary mouse retinal pigmented epithelial cells. Advances in Experimental Medicine & Biology. 2003;533:347–352. doi: 10.1007/978-1-4615-0067-4_44. [DOI] [PubMed] [Google Scholar]
- Gouras P, Kong J, Tsang SH. Retinal degeneration and RPE transplantation in Rpe65(−/−) mice. Investigative Ophthalmology & Visual Science. 2002;43:3307–3311. [PubMed] [Google Scholar]
- Huber G, Beck SC, Grimm C, Sahaboglu-Tekgoz A, Paquet-Durand F, Wenzel A, Humphries P, Redmond TM, Seeliger MW, Fischer MD. Spectral domain optical coherence tomography in mouse models of retinal degeneration. Investigative Ophthalmology & Visual Science. 2009;50:5888–5895. doi: 10.1167/iovs.09-3724. [DOI] [PMC free article] [PubMed] [Google Scholar]
- Lamba DA, Karl MO, Reh TA. Strategies for retinal repair: Cell replacement and regeneration. Progress in Brain Research. 2009;175:23–31. doi: 10.1016/S0079-6123(09)17502-7. [DOI] [PubMed] [Google Scholar]
- Li LX, Turner JE. Transplantation of retinal pigment epithelial cells to immature and adult rat hosts: Short- and long-term survival characteristics. Experimental Eye Research. 1988a;47:771–785. doi: 10.1016/0014-4835(88)90044-9. [DOI] [PubMed] [Google Scholar]
- Li LX, Turner JE. Transplantation of retinal pigment epithelial cells to immature and adult rat hosts: Short- and long-term survival characteristics. Experimental Eye Research. 1988b;47:771–785. doi: 10.1016/0014-4835(88)90044-9. [DOI] [PubMed] [Google Scholar]
- Li L, Turner JE. Optimal conditions for long-term photoreceptor cell rescue in RCS rats: The necessity for healthy RPE transplants. Experimental Eye Research. 1991;52:669–679. doi: 10.1016/0014-4835(91)90019-b. [DOI] [PubMed] [Google Scholar]
- Liu X, Ondek B, Williams DS. Mutant myosin VIIa causes defective melanosome distribution in the RPE of shaker-1 mice. Nature Genetics. 1998;19:117–118. doi: 10.1038/470. [DOI] [PubMed] [Google Scholar]
- Lopez R, Gouras P, Brittis M, Kjeldbye H. Transplantation of cultured rabbit retinal epithelium to rabbit retina using a closed-eye method. Investigative Ophthalmology & Visual Science. 1987;28:1131–1137. [PubMed] [Google Scholar]
- Lu B, Malcuit C, Wang S, Girman S, Francis P, Lemieux L, Lanza R, Lund R. Long-term safety and function of RPE from human embryonic stem cells in preclinical models of macular degeneration. Stem Cells. 2009;27:2126–2135. doi: 10.1002/stem.149. [DOI] [PubMed] [Google Scholar]
- Lund RD, Adamson P, Sauve Y, Keegan DJ, Girman SV, Wang S, Winton H, Kanuga N, Kwan AS, Beauchene L, Zerbib A, Hetherington L, Couraud PO, Coffey P, Greenwood J. Subretinal transplantation of genetically modified human cell lines attenuates loss of visual function in dystrophic rats. Proceedings of the National Academy of Sciences of the United States of America. 2001;98:9942–9947. doi: 10.1073/pnas.171266298. [DOI] [PMC free article] [PubMed] [Google Scholar]
- Mata NL, Radu RA, Clemmons RC, Travis GH. Isomerization and oxidation of vitamin a in cone-dominant retinas: A novel pathway for visual-pigment regeneration in daylight. Neuron. 2002;36:69–80. doi: 10.1016/s0896-6273(02)00912-1. [DOI] [PMC free article] [PubMed] [Google Scholar]
- Nusinowitz S, Ridder WH, III, Ramirez J. Temporal response properties of the primary and secondary rod-signaling pathways in normal and Gnat2 mutant mice. Experimental Eye Research. 2007;84:1104–1114. doi: 10.1016/j.exer.2007.02.009. [DOI] [PubMed] [Google Scholar]
- Pinilla I, Lund RD, Lu B, Sauve Y. Measuring the cone contribution to the ERG b-wave to assess function and predict anatomical rescue in RCS rats. Vision Research. 2005;45:635–641. doi: 10.1016/j.visres.2004.09.014. [DOI] [PubMed] [Google Scholar]
- Ruggeri M, Wehbe H, Jiao S, Gregori G, Jockovich ME, Hackam A, Duan Y, Puliafito CA. In vivo three-dimensional high-resolution imaging of rodent retina with spectral-domain optical coherence tomography. Investigative Ophthalmology & Visual Science. 2007;48:1808–1814. doi: 10.1167/iovs.06-0815. [DOI] [PubMed] [Google Scholar]
- Seiler MJ, Rao B, Aramant RB, Yu L, Wang Q, Kitayama E, Pham S, Yan F, Chen Z, Keirstead HS. Three-dimensional optical coherence tomography imaging of retinal sheet implants in live rats. Journal of Neuroscience Methods. 2010;188:250–257. doi: 10.1016/j.jneumeth.2010.02.018. [DOI] [PMC free article] [PubMed] [Google Scholar]
- Sheedlo HJ, Li LX, Turner JE. Functional and structural characteristics of photoreceptor cells rescued in RPE-cell grafted retinas of RCS dystrophic rats. Experimental Eye Research. 1989;48:841–854. doi: 10.1016/0014-4835(89)90067-5. [DOI] [PubMed] [Google Scholar]
- Sheedlo HJ, Li L, Turner JE. Photoreceptor cell rescue at early and late RPE-cell transplantation periods during retinal disease in RCS dystrophic rats. Journal of Neural Transplantation & Plasticity. 1991;2:55–63. doi: 10.1155/NP.1991.55. [DOI] [PMC free article] [PubMed] [Google Scholar]
- Timmers AM, Zhang H, Squitieri A, Gonzalez-Pola C. Subretinal injections in rodent eyes: Effects on electrophysiology and histology of rat retina. Molecular Vision. 2001;7:131–137. [PubMed] [Google Scholar]
- Weng J, Mata NL, Azarian SM, Tzekov RT, Birch DG, Travis GH. Insights into the function of Rim protein in photoreceptors and etiology of Stargardt’s disease from the phenotype in abcr knockout mice. Cell. 1999;98:13–23. doi: 10.1016/S0092-8674(00)80602-9. [DOI] [PubMed] [Google Scholar]
- Zhang X, Bok D. Transplantation of retinal pigment epithelial cells and immune response in the subretinal space. Investigative Ophthalmology & Visual Science. 1998;39:1021–1027. [PubMed] [Google Scholar]