

Abstract
Genome-wide association studies (GWAS) have identified 36 loci associated with body mass index (BMI), predominantly in populations of European ancestry. We conducted a meta-analysis to examine the association of >3.2 million SNPs with BMI in 39,144 men and women of African ancestry, and followed up the most significant associations in an additional 32,268 individuals of African ancestry. We identified one novel locus at 5q33 (GALNT10, rs7708584, p=3.4×10⁻¹¹) and another at 7p15 when combined with data from the Giant consortium (MIR148A/NFE2L3, rs10261878, p=1.2×10⁻¹⁰). We also found suggestive evidence of an association at a third locus at 6q16 in the African ancestry sample (KLHL32, rs974417, p=6.9×10⁻⁸). Thirty-two of the 36 previously established BMI variants displayed directionally consistent effect estimates in our GWAS (binomial p=9.7×10⁻⁷), of which five reached genome-wide significance. These findings provide strong support for shared BMI loci across populations as well as for the utility of studying ancestrally diverse populations.
There are notable racial and ethnic disparities in the prevalence of obesity in the United States; nearly 50% of African American adults are classified as obese compared to 35% of non-Hispanic whites1. Genome-wide association studies (GWAS) have identified 36 BMI loci at statistically significant levels (p<5.0×10⁻⁸)2–13, of these, 32 were identified in individuals of European ancestry3–8 and four in East Asian populations9,10. Large GWAS of BMI in populations of African ancestry are lacking, and will be important for identifying genetic variants that are unique or of greater importance to this population14–17. In this study, we conducted a large GWAS meta-analysis of BMI in men and women of African ancestry to search for novel loci, and tested associations with common variation at the 36 known loci to better understand their relevance in African ancestry populations.
Thirty-six GWAS, totaling 39,144 men and women of African ancestry, were included in the Stage 1 meta-analysis of as many as 3,283,202 (minor allele frequency >1%) genotyped and imputed single nucleotide polymorphisms (SNPs) (Online Methods, Supplementary Tables 1–3, Supplementary Note). After applying both study-specific and overall Stage 1 genomic-control corrections (Supplementary Table 2), 11 SNPs at five loci achieved genome-wide significance (p<5×10⁻⁸) (Table 1, Figure 1, Supplementary Figure 1). Four of these loci are known BMI loci (1q25, SEC16B; 4p12, GNPDA2; 16q12, FTO; and 18q21, MC4R). The fifth locus, at 5q33 (rs7708584, approximately 27 kb upstream of GALNT10, p=8.02×10⁻⁹), has not been previously associated with BMI at genome-wide significant levels in any population.
Table 1.
Summary of the eight independent SNPs that were associated with BMI at genome-wide significant (p<5.0×10⁻⁸) levels in men and women of African ancestry
| Previously identified BMI loci | Newly identified BMI loci | |||||||
|---|---|---|---|---|---|---|---|---|
|
| ||||||||
| rs543874 | rs7586879 | rs348495 | rs17817964 | rs6567160 | rs7708584 | rs974417 | rs10261878d | |
| Nearest gene | SEC16B | ADCY3 | GNPDA2 | FTO | MC4R | GALNT10 | KLHL32 | MIR148A/NFE2L3 |
| Chr | 1 | 2 | 4 | 16 | 18 | 5 | 6 | 7 |
| Position (Build 37) | 177889480 | 25116977 | 45184442 | 53828066 | 57829135 | 153543466 | 97419598 | 25917070 |
| Allelesa | G/A | T/C | G/A | T/C | C/T | A/G | C/T | C/A |
| EAFb | 0.25 | 0.77 | 0.34 | 0.12 | 0.21 | 0.32 | 0.66 | 0.44 |
|
| ||||||||
| Stage 1 | ||||||||
| N | 38899 | 38948 | 39097 | 39080 | 39103 | 38219 | 39120 | 39101 |
| β (SE) | 0.057 (0.009) | 0.042 (0.010) | 0.048 (0.009) | 0.074 (0.012) | 0.062 (0.010) | 0.050 (0.009) | 0.040 (0.008) | 0.030 (0.008) |
| p-value | 1.80E-10 | 1.05E-05 | 2.70E-08 | 2.27E-09 | 2.41E-10 | 8.02E-09 | 1.49E-06 | 1.66E-04 |
|
| ||||||||
| Stage 2 | ||||||||
| N | 6805 | 6817 | 6817 | 6769 | 6817 | 6817 | 6816 | 6817 |
| β (SE) | 0.074 (0.020) | 0.073 (0.020) | 0.067 (0.021) | 0.068 (0.027) | 0.045 (0.021) | 0.047 (0.018) | 0.053 (0.018) | 0.017 (0.017) |
| p-value | 1.49E-04 | 3.12E-04 | 1.19E-03 | 0.012 | 0.032 | 9.35E-03 | 3.47E-03 | 0.330 |
|
| ||||||||
| Stage 3 | ||||||||
| N | N/A | N/A | N/A | N/A | N/A | 25337 | 25451 | 25308 |
| β (SE) | 0.026 (0.010) | 0.015 (0.009) | 0.029 (0.009) | |||||
| p-value | 7.08E-03 | 0.091 | 1.01E-03 | |||||
|
| ||||||||
| Combined | ||||||||
| N | 45704 | 45765 | 45914 | 45849 | 45920 | 70373 | 71387 | 194931 |
| β (SE) | 0.060 (0.008) | 0.047 (0.009) | 0.051 (0.008) | 0.073 (0.011) | 0.059 (0.009) | 0.040 (0.006) | 0.031 (0.006) | 0.032 (0.005) |
| p-value | 2.00E-13 | 3.60E-08 | 1.60E-10 | 1.05E-10 | 2.96E-11 | 3.37E-11 | 6.88E-08 | 1.23E-10 |
|
| ||||||||
| Explained variancec (%) | 0.21% | 0.19% | 0.20% | 0.10% | 0.07% | 0.04% | 0.02% | 0.03% |
Effect allele listed first;
Frequencies from Stage 1 sample;
Using results from Stage 2 for previously-identified BMI loci and results from Stage 2+Stage 3 for newly-identified BMI loci, the total fraction of variance explained was calculated using the formula [2f(1−f)*a2]*100, where f is the frequency of the variant and a is the additive effect of the variant (see Thorleifsson G et al, 20093);
Combined=African ancestry stages 1+2+3+GIANT [GIANT results are N=123706, β (SE)=0.045 (0.011), p-value=2.21E-05]. SNP, single nucleotide polymorphism; Chr, chromosome; EAF, effect allele frequency; β (beta estimate) reported in inverse-normally transformed units; SE, standard error. P-values for between-study heterogeneity all >0.1.
Figure 1.

Manhattan plot displaying results of the BMI association meta-analysis in the Stage 1 studies. Colored genomic loci indicate novel associations (red) and those detected previously (blue).
We subsequently selected the 1,500 most significantly associated SNPs from Stage 1 (p<1.19×10⁻³) and examined associations with BMI in an independent sample of 6,817 men and women of African ancestry from seven additional studies (Stage 2) (Online Methods, Supplementary Tables 1–3, Supplementary Note). Of these 1,500 SNPs, 179 replicated at nominal significance (p<0.05) and had effects directionally consistent with Stage 1 (Supplementary Table 4). A meta-analysis of Stages 1 and 2 revealed a second novel locus, 6q16 (rs974417, located in an intronic region of KLHL32; Stage 2 p=3.5×10⁻³; Stage 1+2 p=2.2×10⁻⁸) and confirmed our finding at rs7708584 at 5q33 near GALNT10 (Stage 2 p=9.4×10⁻³; Stage 1+2 p=2.2×10⁻¹⁰). We further examined the associations of these two variants in a third stage composed of 25,451 individuals of African ancestry from an additional 12 studies. Support for an association was noted with both variants, although the strength of the association was greater for rs7708584 (GALNT10, p=7.1×10⁻³) than for rs974417 (KLHL32, p=0.09). In combining results across all three stages (n=71,412), rs7708584 (GALNT10) was significantly associated with BMI (p=3.4×10⁻¹¹), whereas rs974417 (KLHL32) was nearly genome-wide significant (p=6.9×10⁻⁸) (Table 1, Figure 2a, b).
Figure 2.
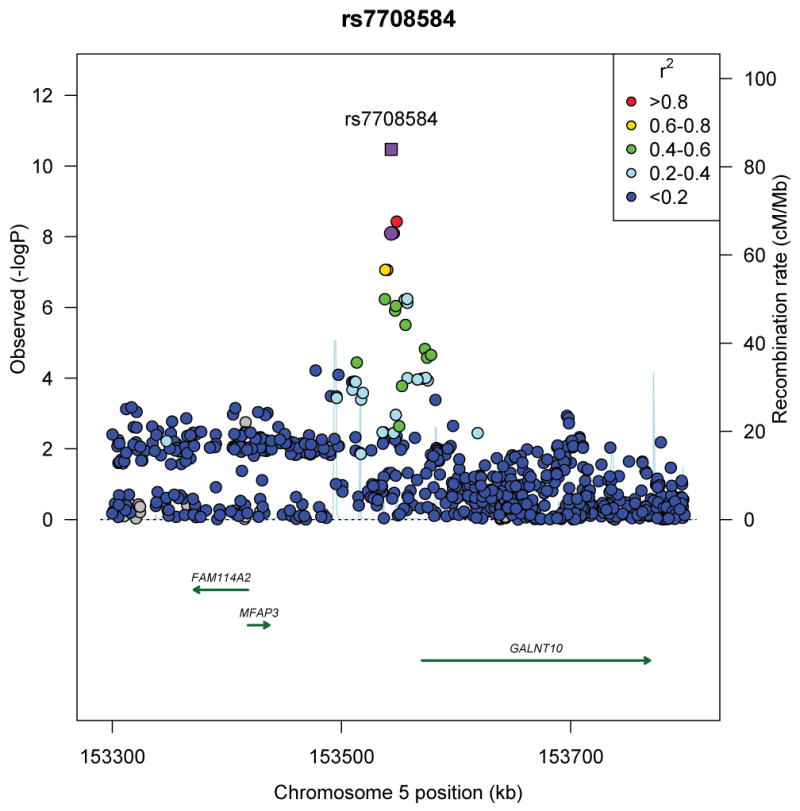
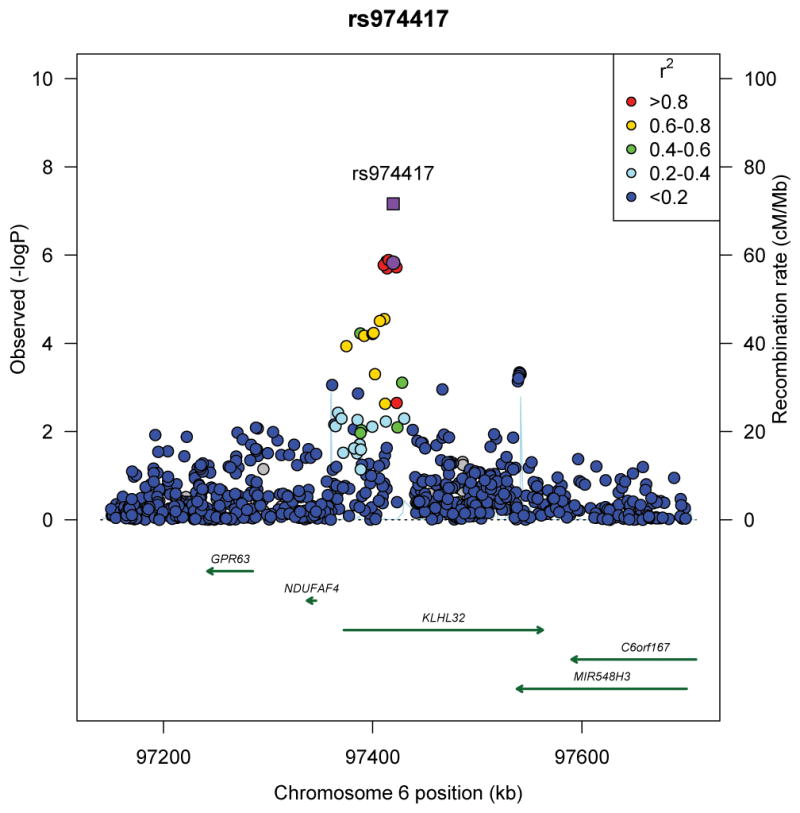
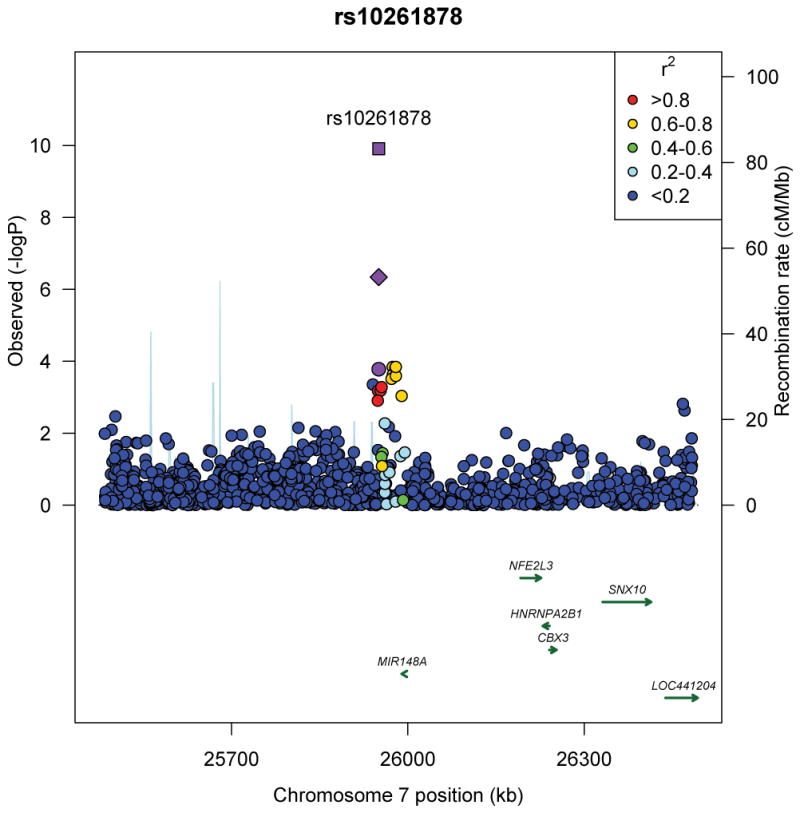
Regional plots of three novel genome-wide significant loci identified in men and women of African ancestry. (a) rs7708584 (GALNT10 region), (b) rs974417 (KLHL32 region), and (c) rs10261878 (MIR148A/NFE2L3 region). For 2a and b, Stage 1 p-value represented by purple circle and Stage 1+2+3 p-value represented by purple square; for 2c, Stage 1 p-value represented by purple circle, African ancestry Stage 1+2+3 p-value represented by purple diamond, and African ancestry + GIANT p-value represented by purple square. SNPs are plotted by their position 500kb on either side of the index SNP on the chromosome against their association (−log10 P) with BMI using the Stage 1 data. SNPs surrounding the top SNPs are colored to indicate the local LD structure using pairwise r2 data from the May 2012 AFR panel of the 1000 genomes.
To identify additional novel loci that may be of importance across populations, we examined the 1,500 most significant SNPs from Stage 1 in publicly available data from the GIANT consortium of ~124,000 individuals European ancestry7 (Online methods). While rs7708584 (GALNT10) was significantly associated with BMI in European ancestry populations (effect allele frequency [EAF]=0.42; p=1.2×10⁻⁵), rs974417 (KLHL32) was not (EAF=0.85; p=0.45), although it was directionally consistent. Through a meta-analysis of European and African ancestry individuals, we identified an additional novel variant at 7p15 (rs10261878) that was also associated with BMI in European ancestry populations (GIANT: EAF=0.94, p=2.2×10⁻⁵). SNP rs10261878 at 7p15 is located in an intergenic region 39 kb upstream of microRNA 148a (MIR148A) and approximately 241 kb upstream of the gene NFE2L3. This variant was positively associated with BMI in Stages 1 (p=1.7×10⁻⁴) and 3 (p=1.0×10⁻³) in the African ancestry GWAS, with a directionally consistent yet non-significant association noted in the smaller Stage 2 (p=0.33) (Figure 2c, Supplementary Table 5). In combining results across studies of African (Stages 1, 2 and 3) and European ancestry (combined n=194,247), both SNPs rs7708584 (GALNT10, p=5.1×10⁻¹⁴) and rs10261878 (MIR148a/NFE2L3, p=1.2×10⁻¹⁰) were significantly associated with BMI; SNP rs974417 (KLHL32) failed to meet the genome-wide significance threshold (p=5.7×10⁻⁶). In individuals of East Asian descent from the AGEN10 and RIKEN9 consortia (n=27,715 and 26,620, respectively) (Figure 3, Supplementary Table 6, Online Methods) rs7708584 (GALNT10, p=0.002) and rs974417 (KLHL32, p=0.023) were directionally consistent and significantly associated with BMI, while rs10261878 (MIR148A/NFE2L3) was neither directionally consistent nor statistically significantly associated with BMI (p = 0.053). Lastly, we examined the associations with BMI in children of African ancestry (n=3,751) (Online Methods) and for all three SNPs, the associations were directionally consistent, but did not reach statistical significance (p>0.05) (Supplementary Table 7).
Figure 3.
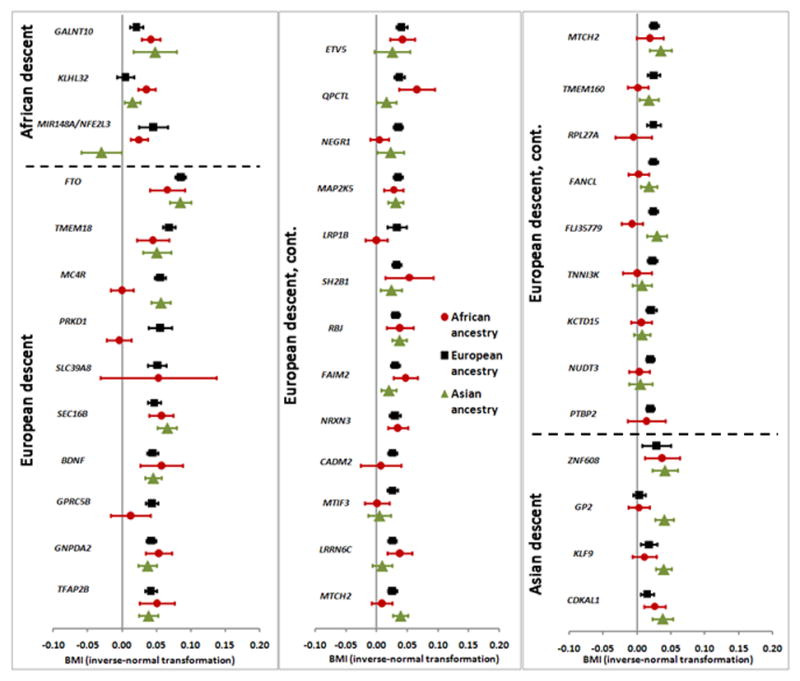
Effect estimates (95% CI) per BMI-increasing allele for the 3 novel loci discovered in individuals of African ancestry (1st section, in descending order of African effect size), the 32 loci discovered in individuals of European ancestry (2nd section, in descending order of European effect size), and the 4 loci discovered in individuals of Asian ancestry (3rd section, in descending order of Asian effect size). Results for individuals of African ancestry depicted by red dots (Stage 1+2+3 for novel loci, Stage 1 for previously-discovered loci); results for individuals of European ancestry depicted by black squares from Speliotes EK et al, 20107; and results for individuals of Asian ancestry depicted by green triangles from Okada Y et al, 20129 and Wen W et al, 201210.
To further understand differences by ancestral background as well as characterize the functional and genetic epidemiologic architecture of the two novel BMI loci (5q33, GALNT10; 7p15, MIR148A/NFE2L3) and the suggestive locus at 6q16 (KLHL32), we performed several additional analyses. Local ancestry adjustment (in 69% of the Stage 1 sample; Online Methods) resulted in numerically similar effect estimates (Supplementary Table 8) and we did not detect evidence of significant effect heterogeneity in analyses stratified by local ancestry (Supplementary Table 9). We found that the three BMI loci were associated with waist circumference (among n~20,000, of which many individuals overlap those studied here), but not with BMI-adjusted waist circumference, waist-to-hip ratio, or height18 (Supplementary Table 10), suggesting that the three loci are associated with overall body size, rather than with fat distribution. We found no evidence of pleiotropy with adiposity-related metabolic traits using GWAS data provided by trait-specific consortia in men and women predominantly of European ancestry19–23 (Supplementary Table 11).
We examined associations with BMI in our African ancestry Stage 1 sample of the index SNPs reported for the 36 previously established BMI loci in the European and Asian populations7,9,10 (Figure 3, Supplementary Table 12). The associations were directionally consistent with the effects reported in the original papers for 32 of the 36 established BMI loci (p-value for binomial test of direction=9.7×10⁻⁷) of which 16 variants associated with BMI at p<0.01 (p-value for binomial test <1.0×10⁻¹⁵) (Supplementary Table 12).
Using the results from the Stage 1 meta-analysis, we searched for common variants within the established loci that better captured the association of the index SNP reported in the European and Asian populations. Seven regions (PTBP2, TMEM18, RBJ, NUDT3, BDNF, FTO, MC4R) harbored at least one variant that was correlated with the index SNP in the referent population (r2≥0.4) and was associated with BMI in the African ancestry GWAS at a significance level that was at least one order of magnitude greater than that observed for the index SNP (Online Methods, Supplementary Table 13, Supplementary Figure 2a–g). These variants were also associated with BMI in GIANT (Supplementary Table 13) and are likely to be better markers of the biologically functional allele, at least in populations of African ancestry. We also interrogated the evidence for possible independent secondary signals by visual inspection of all p-values of SNP – BMI associations for SNPs with r2< 0.2 within the 1 Mb region of the index SNP. We did not detect evidence of independent secondary signals at any of the known BMI loci (at p<6.7×10⁻⁶; see Online Methods). As illustrated in Supplementary Figure 3, for most loci, the genetic data from African ancestry populations may assist in refining the location of the risk variant as there are fewer markers correlated with the strongest signals and/or a more narrowed region in which proxies reside.
To direct us to positional candidate genes, we examined the cis-associations between the index SNP and expression of gene transcripts within the flanking 1Mb-region (500 kb each side) in human brain, subcutaneous and omental adipose tissue, and liver24–27 (Online Methods, Supplementary Table 14). SNP rs7708584 near GALNT10 showed nominally significant (p<0.05) associations with GALNT10 expression (for two of the three transcripts available) in liver, omental, and subcutaneous fat (p=0.048, 0.00010, and 0.00017, respectively). Furthermore, we found suggestive cis-associations for rs10261878 near NFE2L3 with NFE2L3 expression in the same three tissues (p=0.039, 0.015, and 0.036 for liver, omental, and subcutaneous fat, respectively). However, despite the consistent associations observed for our lead SNPs in the GALNT10 and NFE2L3 loci, other nearby SNPs showed stronger association with the expression levels for the respective transcripts (Supplementary Figure 4). Subsequent conditional analyses adjusting for the most significant eQTL SNP in the region abolished the cis-associations between the BMI-associated SNPs and the respective transcript expression levels (Supplementary Table 15). Taken together, these eQTL analyses could not confirm that the identified BMI-SNPs affect GALNT10 and NFE2L3 expression directly.
We did not find non-synonymous SNPs in GALNT10, NFE2L3 or KLHL32 that were correlated (r2> 0.2) with the most significant SNPs in the 1000 Genomes Project African ancestry populations (AFR). However, we did detect a number of correlated SNPs (r2>0.5) in regulatory sequences determined based on overlapping chromatin marks in multiple cell types, including brain and adipose tissue (Online Methods). Many of these SNPs (or good proxies in the 1000 Genomes Project AFR, r2 range 0.59–1.0), which are located in putative enhancer and promoter regions, had only marginally weaker associations in Stage 1 than the most significant SNPs reported in these regions (Supplementary Tables 16–19, Supplementary Figure 5a–c). Together these data suggest that the biologically relevant variants in all three regions may be regulatory in function.
The variant rs7708584 at chromosome 5q33 is located upstream of the gene galactosamine:polypeptide N-acetylgalactosaminyltransferase 10 (GALNT10), which catalyzes the first step in the synthesis of mucin-type oligosaccharides (Supplementary Note). The protein is highly expressed in the small intestine and at intermediate levels in the stomach, pancreas, ovary, thyroid gland and spleen28. Suggestive associations between BMI and GALNT10 have been observed in a smaller sample of African Americans14 that are included in the present Stage 1 meta-analysis, although the lead SNP differed (rs2033195) and displayed only moderate LD (r2 = 0.27) with the lead SNP discovered herein. The variant at 7p15, rs10261878, is intergenic and located 39 kb from a microRNA gene (MIR148A), which has been found to be significantly up-regulated during adipogenesis29 as well as in human adipocytes30. In addition, human miR-148a has been shown to regulate CCKBR (cholecystokinin B receptor), which has been reported to play a regulatory role in the control of food intake31. The next closest gene (241 kb from rs10261878) is the nuclear factor (erythroid-derived 2)-like 3 gene (NFE2L3), a transcription factor that binds to antioxidant response elements of target genes and appears to play a role in differentiation, inflammation, and carcinogenesis32.
The most significant SNP at chromosome 6q16 (rs974417) is intronic in the kelch-like 32 gene (KLHL32). Kelch-like genes have propeller domains that bind substrate proteins, promoting substrate ubiquitination, which modulates protein function. We also detected evidence of recent positive selection in and downstream of KLHL32 (Supplementary Figures 6–9, Supplementary Note).
In the largest GWAS meta-analysis of African ancestry populations to date, we identified two novel loci and one highly suggestive locus influencing BMI. The most informative SNPs in each of these three loci explain 0.10% of the variance in BMI in African ancestry populations compared to 0.05% in Europeans and 0.03% in Asians (Table 1, Supplementary Table 6). Using the most significant ancestry-specific markers from each locus, the 36 known BMI loci explain 1.30% of the variance in BMI in men and women of African ancestry compared with 1.67% and 1.25% in European and Asian ancestry populations, respectively (Supplementary Tables 12 and 13). We provide evidence for a shared genetic influence on BMI across populations, as directionally consistent associations were observed with the majority of known BMI risk variants. This observation suggests that the biologically functional alleles are ancient and likely arose before migrations out of Africa. In addition, we were able to refine the window of association of some of the previously established BMI loci, which may eventually help identify the biologically functional variant(s). In this study, we did not identify common variants for BMI that are likely to contribute to population differences in the prevalence of obesity. The ability to map novel loci and replicate signals at established loci found in other populations reflects differences in allele frequency and effect size, which are influenced by population differences in recent demographic history and linkage disequilibrium with the functional variant as well as genetic and environmental modifying factors. Further studies will be needed to test the biologically functional alleles at the known loci as well as the contribution of less common variation that has yet to adequately surveyed by genome-wide SNP arrays. Taken together, these findings demonstrate the importance of conducting genetic studies in diverse populations in order to identify novel susceptibility loci for common traits.
Online Methods
Study Design
We utilized a three-stage design consisting of a GWAS meta-analysis (Stage 1), a follow-up of 1,500 SNPs (Stage 2), and a focused follow-up of the three novel loci (Stage 3). Stage 1 included results from 36GWAS of 39,144 men and women of African ancestry (37,956 African American and 1,188 African; Supplementary Table 1). We took forward the 1,500 most significantly associated SNPs (p-value <0.0003) for examination in 6,817 additional men and women of African ancestry from seven GWAS (Stage 2, all African American). The three SNPs that reached genome-wide significance (p<5×10⁻⁸) after the meta-analysis of Stage 1 and Stage 2 results were taken forward for further confirmation in 25,451 additional African ancestry subjects from twelve studies. All participants in these studies provided written informed consent for the research, and approval for the study was obtained from the ethics review boards at all institutions. A description of each participating study as well as details regarding the measurement and collection of height and weight data are provided in the Supplementary Note.
Genotyping and Quality Control
Genotyping in each study was conducted using Illumina or Affymetrix genome-wide SNP arrays. The size of each study ranged from 50 to 8,421 individuals. The details of the array, genotyping quality control procedures, and sample exclusions for each study that contributed data are listed in Supplementary Table 1 and Supplementary Table 2.
Statistical Analysis
In all GWAS, imputation to phased haplotype data from the founders of the CEU and YRI HapMap Phase 2 samples (build 21) was performed using MACH 1, IMPUTE22 or BEAGLE3. SNPs with lower imputation quality scores (r2<0.3) (Supplementary Table 2) as well as SNPs with a small number of allele counts after stratifying by sex and case-control status were excluded from analyses. Local ancestry, defined as the number of European chromosomes (continuous between 0–2), was estimated for the majority of the Stage 1 African ancestry studies (Supplemental Table 8), using HAPMIX4. To evaluate the effect of admixture on the allele distribution between African and European segments we stratified the analysis of each variant by local ancestry at each locus (Supplementary Table 9).
Stage 1
GWA analyses were performed by each of the participating studies. BMI was regressed on age, age2, and study site (if needed) to obtain residuals, separately by sex and case-control status, if needed. Residuals were inverse-normally transformed to obtain a standard normal distribution with a mean of 0 and a SD of 1. For studies with unrelated subjects, each SNP was tested for additive association with BMI by regressing the transformed residuals on the number of copies of the SNP effect allele, adjusting for population structure as measured by the first ten eigenvectors calculated for each study. Analyses were stratified by sex and case-control status (if needed). For studies that included related individuals, family-based association tests were conducted that take into consideration the genetic relationships among the individuals. Study-specific lambda values ranged from 0.95 to 1.08 (Supplementary Table 2). We applied genomic control (GC) in the Stage 1 analysis (i.e. divided by the median of all χ2 statistics for each study) to eliminate any remaining over dispersion before combining the GWAS in the meta-analysis. In Stage 1, we conducted a fixed effect meta-analysis using the inverse variance weighted method implemented in the program METAL5. We performed a second GC correction of the Stage 1 meta-analysis results (lambda = 1.136) before selecting SNPs for follow-up.
Stages 2 and 3
The 1,500 most significant SNPs from Stage 1 were examined in an additional 6,817 individuals, with each SNP being analyzed as described for Stage 1 and meta-analyzed using the inverse-variance method using METAL. As in Stage 1, each SNP was tested for association with BMI by regressing the transformed residuals on the number of copies of the SNP effect allele, adjusting for population structure as measured by the first ten eigenvectors calculated for each study. Further testing of the 3 novel variants was conducted in an additional 25,451 individuals (Stage 3). Results from all stages were meta-analyzed using the inverse-variance method in METAL.
Examination in individuals of European ancestry
We also examined the 1,500 most statistically significant SNPs from Stage 1 in the GIANT consortium (n=123,706 individuals of European ancestry)6. Of these, 1,390 were genotyped or imputed in GIANT and 1,328 had data for n>50,000 and a MAF>1%. We conducted a meta-analysis of Stages 1+2+3+GIANT in the same manner as described above. The three novel variants were also examined in the AGEN and RIKEN consortia7,8 and the Pediatric Research Consortium (PeRC) (see Supplementary Note).
Estimation of Variance Explained
The total fraction of variance explained was calculated using the formula 2f(1−f)*a2, where f is the frequency of the variant and a is the additive effect of the variant9. When calculating percent variance explained in the African ancestry sample, for the previously-discovered BMI variants that were not genome-wide significant in Stage 1, we used data from the Stage 1 sample; for those that were genome-wide significant we used data from the Stage 2 sample; and for the novel BMI variants we used data from the Stage 2+3 samples to avoid inflating the estimates due to the winner’s curse. When summing percent variance explained for the 36 previously-discovered BMI variants (Supplemental Table 12), we utilized the more informative SNP discovered through fine-mapping at the seven loci (listed in Supplemental Table 13). However, for these seven variants Stage 1 results were used and estimates may be biased; Stage 2 and 3 studies only participated in the look-up of the top SNPs from preceding Stages.
Bioinformatic Analysis of the Novel BMI Loci
In an attempt to identify functionality in non-coding regions at the three loci, we utilized FunciSNP version 0.9910, which systematically integrates the 1,000 Genomes SNP data (1KGP, April 2012) with chromatin features of interest. In order to capture regulatory elements, we used 73 different chromatin features generated by next-generation sequencing technologies in brain and adipose tissues from the NIH Epigenomics Roadmap11 as well as known DNaseI hypersensitive locations, FAIRE-seq peaks, and CTCF binding sites from more than 100 different cell types, which were collected from the ENCODE data12.
All SNPs with an r2 value >0.5 with each index SNP in the 1KGP AFR populations in a 1Mb window around each index variant were catalogued. We used the UCSC Genome Browser (http://genome.ucsc.edu/) to illustrate the correlated SNPs which overlap chromatin features from these tissues as well as chromatin features from seven cell lines utilized in the ENCODE Project (Supplementary Figures 5a–c). All of the results from these analyses are provided in Supplementary Tables 16–19.
eQTL Analyses
Liver, subcutaneous, and omental fat tissue
The determination of eQTLs in liver, subcutaneous and omental fat tissue have been described in detail previously13. In brief, liver, subcutaneous, and omental fat tissue were obtained from patients of European ancestry who underwent bariatric surgery. Expression of a total of 39,280 oligonucleotide probes targeting transcripts representing 34,266 known and predicted genes was assessed. All patients were genotyped on a genome-wide SNP array and association between SNPs and gene expression data was adjusted for age, race, gender, and surgery year using linear regression. Results are presented in Supplementary Table 14 and Supplementary Figure 4.
Brain cortical tissue
We examined the cis-associations (defined as genes within 1 Mb) between each of the BMI SNPs and expression of nearby genes in brain (cortical tissue)14. The eQTL analyses have been described in detail previously (GEO database: GSE8919)14. In brief, DNA and RNA of neuropathologically normal cortical brain samples of 193 individuals (average age [range]: 81 [65–100] yrs) of European ancestry were isolated and genotyped for a genome-wide SNP array and HapMap genotypes were imputed. RNA expression was assessed for 24,357 transcripts of which 14,078 transcripts met the QC criteria. Association analyses between SNPs and expression data assumed an additive model and were adjusted for sex and age at death. Results are presented in Supplementary Table 14 and Supplementary Figure 4.
Association Testing of Previously Established BMI Loci
To characterize alleles that might better represent the biologically functional variant at the 36 previously-discovered BMI loci, we searched for LD proxies among individuals of African ancestry. Using HapMap data (CEU or JPT/CHB) to estimate LD, we identified all SNPs that were correlated (r2≥0.4) with the index SNP (within 250 kb, or larger to include a nearby gene). Next, we tested these SNPs for association with BMI in the Stage 1 African ancestry sample. We applied a locus-specific significance criterion α, which accounts for multiple testing [the number of tag SNPs in the HapMap YRI population that capture (r2≥0.8) all common SNPs (MAF ≥0.05) correlated with the index signal in the HapMap CEU or JPT/CHB populations]. This alpha level does not account for the number of regions evaluated and reflects a balance between the need to correct for multiple comparisons and the prior knowledge that each region harbors a risk variant for BMI. We also looked for novel independent associations, focusing on the genotyped and imputed SNPs that were uncorrelated with the index signal in the initial GWAS populations (r2<0.2). Here, we applied a Bonferroni correction for defining novel associations as significant in each region, as 0.05/the total number of tags needed to capture (r2≥0.8) all common risk alleles across all risk regions in the YRI population (α=6.7×10⁻⁶).
Detection of recent positive selection in Africans and Europeans at a novel BMI locus
We evaluated the evidence for recent positive selection at our novel loci using several statistical techniques, the BioVU African American GWAS data, and data from the International HapMap Project and the Human Genome Diversity Project (HGDP). We compared adjusted allele frequencies among BioVU, and HapMap phase 3 participants from West African Yoruban (YRI) and East African Luhya (LWK) using Treeselect15. The LWK sample is differentiated from the YRI and samples of African Americans16. Allele frequencies in the African American sample were adjusted by subtracting the expected contribution of European alleles, where pAA is the allele frequency in African Americans obtained from experimental data, pEA is the allele frequency in Europeans obtained from HapMap, pAF is the estimated allele frequency in African founders, and α is the average proportion of ancestry from Europeans, or 0.2. The adjustment is then performed by solving the following expression for pAF.
We also evaluated the HapMap Phase II and HGDP data with the integrated haplotype score (iHS)17 and Haplotter and the cross-population extended haplotype homozygosity (XP-EHH) statistic using the HGDP selection browser18,19. We also evaluated BioVU using 5,000 random autosomal SNPs with STRUCTURE v2.3.3, and on average the participants were 20.7% European and 79.3% African ancestry20,21.
We observed evidence for recent selection near the KLHL32 gene within the YRI HapMap data using iHS (Supplementary Figure 4) and in the HGPD African participants (Supplementary Figures 5a–d). Nominal evidence of selection was observed within YRI and African American populations using the Treeselect statistic, with the transcription factor binding site SNP rs1206131 (p = 0.003 in the African Americans, and p = 0.005 in YRI and at the SNP rs9387284 (p = 0.004 in the YRI and p = 0.026 in the African Americans) (Supplementary Figure 6a, b). The Treeselect method also demonstrated a significant allele frequency differentiation between African and African-ancestry populations (Fst~0.01) at the transcription factor binding site SNP rs1206131. In panel (b), rs1206131 is the most significant SNP for this test in the region +/− 400kb. The test from the African American branch of the tree in (a) was slightly less significant at rs1206131 and the most significant SNP was downstream, which is also under the iHS and XP-EHH peaks from Africans in the HGDP and HapMap data. The graph of HGDP allele frequencies at this SNP shows that the ancestral T allele has increased frequencies throughout Africa relative to other major global populations (Supplementary Figure 7). Average (standard deviation, maximum) Fst values in this region between YRI and African American were 0.001(0.001, 0.015), between YRI and CEU were 0.040 (0.045, 0.304), and between African American and CEU were 0.011(0.013, 0.082).
Supplementary Material
Acknowledgments
A full listing of acknowledgments is detailed in the Supplementary Note.
Footnotes
Author Contributions
Design and/or Management of the Individual Studies: AA, AAA, CBA, CIA, DKA, LA, MCA, MAA, SA, CHB, DMB, DWB, EPB, EVB, GB, IBB, JPB, NPB, LB, SIB, WJB, CC, GC, GSC, JC, LC, MC, NEC, QC, RSC, SJC, JD, PD, RWD, SLD, JD, MKE, TLE, CF, JKF, EMG, PJG, SFAG, AH, AJMH, BEH, BVH, CAH, CCH, DH, HH, KJH, JJH, JNH, UJH, SAI, EMJ, FJ, JMJ, CK, DLK, EAK, EKK, LNK, LK, RAK, SJK, SK, LL, AML RL, SL, YL, ABM, BM, KRM, RCM, THM, JHM, IHM, IM, KEN, MCYN, SN, CND, UN, BN, SN, KLN, TOO, OO, OIO, BP, UP, BMP, CAP, GP, JRP, MFP, PAP, SRP, EAR, BAR, CNR, SR, JLR-G, ABS, AGS, JLS, LBS, PJS, VJH, SBS, SS, MS, IJS, SSS, HT, MJT, MAT, MV, JSWXW, JKW, SMW, LKW, MW, JJY, NAZ, RGZ, WZ, ABZ, KAZ, YZ, XZ
Genotyping: AB, UB, SJC, YIC, DD, SFAG, XG, DGH, JHH, JNH, TDH, TH, KCJ, YL, YCL, WM, RN, JRP, NDP, SS, DJV
Phenotyping: AAA, DKA, MAA, EPB, RSC, ED, BIF, OG, SFAG, JH, TH, KCJ, AK, CK, EKK, SL, JEM, MN, RN, AO, HO-B, BMP, JRP, SRP, CNR, ER, SR, BS, DS, LS, BOT, TRY
Statistical Methods and Data analysis: AAA, DKA, LFB, CWKC, GKC, GC, NEC, WC, GAC, YIC, JD, PD, TLE, CF, MFF, JPB, EMG, MG, OG, XG, CAH, MRI, AK, BJK, CK, EKK, SJK, CDL, GL, G Li, HL, KL, LAL, RJFL, VL, YL, Youfang Liu, YCL, KL, BM, KLM, YAM, AN, KEN, MAN, MCYN, AND, CDP, JRP, EAR, SKR, BP, APR, LJR-T, DAS, EKS, E Schadt, YVS, BOT, KCT, DRV-E, MKW, ZW, LKW, TWW, LRY, JZ, JHZ, NAZ, JZ, JMZ, WZ
Writing Group: GKC, TLE, MG, BEH, JNH, RJFL, CAH, LAL, KLM, KEN, MCYN, CP, GP, APR, KCT
Critical Review of Manuscript: AAA, AA, CBA, CIA, DKA, LA, MAA, MCA, SA, AB, CHB, DMB, DWB, EPB, EVB, GB, IBB, JPB, LFB, LB, SIB, UB, WJB, CWKC, CC, FC, GAC, GKC, GC, G Chen, JC, LC, MC, NEC, QC, RSC, SJC, W-MC, Y-DIC, DD, ED, JD, PD, RWD, SLD-H, MKE, TLE, CF, JKF, MFF, BIF, EMG, GSG, MG, OG, PJG, SFAG, WTG, XG, AJMH, AH, BEH, BVH, CAH, CCH, DGH, DH, HH, JJH, JNH, KJH, TDH, TH, T Harris, VJH, JHM, MRI, SAI, EMJ, JMJ, KCJ, AK, BJK, CK, DLK, EAK, EKK, LNK, LK, RAK, SJK, SLRK, SK, AML, CDL, GL, G Li, HL, KL, LAL, LL, MCL, RJFL, SL, VL, YL, Youfang Liu, YCL, ABM, BM, JCM, JEM, LHM, KLM, KRM, RCM, THM, WM, YAM, IM-B, AN, BN, KEN, KLN, MAN, MCYN, MN, RN, SN, UN, CN-D, OIO, OO, TOO, AO, HO-B, BMP, BP, CAP, CDP, GP, JRP, MFP, NDP, PAP, SRP, UP, APR, BAR, CNR, ER, SKR, SR, JLR-G, EAR-N, LJR-T, ABS, AGS, BS, DAS, DS, EKS, E Schadt, IJS, JLS, LBS, LS, MMS, MRS, PJS, SBS, SSS, YVS, BOT, KCT, MAT, HT, MJT, MV, DJV, DRVE, JKW, KW, MW, SMW, S-YW, SW-S, TWW, XW, ZW, LKW, JSW, MKW, JJY, LRY, TRY, ABZ, JZ, JMZ, JHZ, KAZ, NAZ, RGZ, WZ, W Zheng, XZ, YZ
References
- 1.Flegal KM, Carroll MD, Kit BK, Ogden CL. Prevalence of obesity and trends in the distribution of body mass index among US adults, 1999–2010. Jama. 2012;307:491–7. doi: 10.1001/jama.2012.39. [DOI] [PubMed] [Google Scholar]
- 2.Bradfield JP, et al. A genome-wide association meta-analysis identifies new childhood obesity loci. Nat Genet. 2012 doi: 10.1038/ng.2247. [DOI] [PMC free article] [PubMed] [Google Scholar]
- 3.Thorleifsson G, et al. Genome-wide association yields new sequence variants at seven loci that associate with measures of obesity. Nat Genet. 2009;41:18–24. doi: 10.1038/ng.274. [DOI] [PubMed] [Google Scholar]
- 4.Frayling TM, et al. A common variant in the FTO gene is associated with body mass index and predisposes to childhood and adult obesity. Science. 2007;316:889–94. doi: 10.1126/science.1141634. [DOI] [PMC free article] [PubMed] [Google Scholar]
- 5.Scuteri A, et al. Genome-Wide Association Scan Shows Genetic Variants in the FTO Gene Are Associated with Obesity-Related Traits. PLoS Genet. 2007;3:e115. doi: 10.1371/journal.pgen.0030115. [DOI] [PMC free article] [PubMed] [Google Scholar]
- 6.Loos RJF, et al. Common variants near MC4R are associated with fat mass, weight and risk of obesity. Nat Genet. 2008;40:768–775. doi: 10.1038/ng.140. [DOI] [PMC free article] [PubMed] [Google Scholar]
- 7.Speliotes EK, et al. Association analyses of 249,796 individuals reveal 18 new loci associated with body mass index. Nat Genet. 2010;42:937–48. doi: 10.1038/ng.686. [DOI] [PMC free article] [PubMed] [Google Scholar]
- 8.Willer CJ, et al. Six new loci associated with body mass index highlight a neuronal influence on body weight regulation. Nat Genet. 2009;41:25–34. doi: 10.1038/ng.287. [DOI] [PMC free article] [PubMed] [Google Scholar]
- 9.Okada Y, et al. Common variants at CDKAL1 and KLF9 are associated with body mass index in east Asian populations. Nat Genet. 2012;44:302–6. doi: 10.1038/ng.1086. [DOI] [PMC free article] [PubMed] [Google Scholar]
- 10.Wen W, et al. Meta-analysis identifies common variants associated with body mass index in east Asians. Nat Genet. 2012;44:307–11. doi: 10.1038/ng.1087. [DOI] [PMC free article] [PubMed] [Google Scholar]
- 11.Chambers JC, et al. Common genetic variation near MC4R is associated with waist circumference and insulin resistance. Nat Genet. 2008;40:716–8. doi: 10.1038/ng.156. [DOI] [PubMed] [Google Scholar]
- 12.Meyre D, et al. Genome-wide association study for early-onset and morbid adult obesity identifies three new risk loci in European populations. Nat Genet. 2009;41:157–9. doi: 10.1038/ng.301. [DOI] [PubMed] [Google Scholar]
- 13.Scherag A, et al. Two new Loci for body-weight regulation identified in a joint analysis of genome-wide association studies for early-onset extreme obesity in French and german study groups. PLoS Genet. 2010;6:e1000916. doi: 10.1371/journal.pgen.1000916. [DOI] [PMC free article] [PubMed] [Google Scholar]
- 14.Ng MC, et al. Genome-wide association of BMI in African Americans. Obesity (Silver Spring) 2012;20:622–7. doi: 10.1038/oby.2011.154. [DOI] [PMC free article] [PubMed] [Google Scholar]
- 15.Kang SJ, et al. Genome-wide association of anthropometric traits in African- and African-derived populations. Hum Mol Genet. 2010;19:2725–38. doi: 10.1093/hmg/ddq154. [DOI] [PMC free article] [PubMed] [Google Scholar]
- 16.Shifman S, Kuypers J, Kokoris M, Yakir B, Darvasi A. Linkage disequilibrium patterns of the human genome across populations. Hum Mol Genet. 2003;12:771–6. doi: 10.1093/hmg/ddg088. [DOI] [PubMed] [Google Scholar]
- 17.Campbell MC, Tishkoff SA. African genetic diversity: implications for human demographic history, modern human origins, and complex disease mapping. Annu Rev Genomics Hum Genet. 2008;9:403–33. doi: 10.1146/annurev.genom.9.081307.164258. [DOI] [PMC free article] [PubMed] [Google Scholar]
- 18.N’Diaye A, et al. Identification, replication, and fine-mapping of Loci associated with adult height in individuals of african ancestry. PLoS Genet. 2011;7:e1002298. doi: 10.1371/journal.pgen.1002298. [DOI] [PMC free article] [PubMed] [Google Scholar]
- 19.Teslovich TM, et al. Biological, clinical and population relevance of 95 loci for blood lipids. Nature. 2010;466:707–13. doi: 10.1038/nature09270. [DOI] [PMC free article] [PubMed] [Google Scholar]
- 20.Dupuis J, et al. New genetic loci implicated in fasting glucose homeostasis and their impact on type 2 diabetes risk. Nat Genet. 2010;42:105–16. doi: 10.1038/ng.520. [DOI] [PMC free article] [PubMed] [Google Scholar]
- 21.Saxena R, et al. Genetic variation in GIPR influences the glucose and insulin responses to an oral glucose challenge. Nat Genet. 2010;42:142–8. doi: 10.1038/ng.521. [DOI] [PMC free article] [PubMed] [Google Scholar]
- 22.Voight BF, et al. Twelve type 2 diabetes susceptibility loci identified through large-scale association analysis. Nat Genet. 2010;42:579–89. doi: 10.1038/ng.609. [DOI] [PMC free article] [PubMed] [Google Scholar]
- 23.Ehret GB, et al. Genetic variants in novel pathways influence blood pressure and cardiovascular disease risk. Nature. 2011;478:103–9. doi: 10.1038/nature10405. [DOI] [PMC free article] [PubMed] [Google Scholar]
- 24.Nalls MA, et al. Imputation of sequence variants for identification of genetic risks for Parkinson’s disease: a meta-analysis of genome-wide association studies. Lancet. 2011;377:641–9. doi: 10.1016/S0140-6736(10)62345-8. [DOI] [PMC free article] [PubMed] [Google Scholar]
- 25.Hernandez DG, et al. Distinct DNA methylation changes highly correlated with chronological age in the human brain. Hum Mol Genet. 2011;20:1164–72. doi: 10.1093/hmg/ddq561. [DOI] [PMC free article] [PubMed] [Google Scholar]
- 26.Zhong H, Yang X, Kaplan LM, Molony C, Schadt EE. Integrating pathway analysis and genetics of gene expression for genome-wide association studies. Am J Hum Genet. 2010;86:581–91. doi: 10.1016/j.ajhg.2010.02.020. [DOI] [PMC free article] [PubMed] [Google Scholar]
- 27.Myers AJ, et al. A survey of genetic human cortical gene expression. Nat Genet. 2007;39:1494–9. doi: 10.1038/ng.2007.16. [DOI] [PubMed] [Google Scholar]
- 28.Cheng L, et al. Characterization of a novel human UDP-GalNAc transferase, pp-GalNAc-T10. FEBS Lett. 2002;531:115–21. doi: 10.1016/s0014-5793(02)03399-9. [DOI] [PubMed] [Google Scholar]
- 29.Xie H, Lim B, Lodish HF. MicroRNAs induced during adipogenesis that accelerate fat cell development are downregulated in obesity. Diabetes. 2009;58:1050–7. doi: 10.2337/db08-1299. [DOI] [PMC free article] [PubMed] [Google Scholar]
- 30.Ortega FJ, et al. MiRNA expression profile of human subcutaneous adipose and during adipocyte differentiation. PLoS One. 2010;5:e9022. doi: 10.1371/journal.pone.0009022. [DOI] [PMC free article] [PubMed] [Google Scholar]
- 31.Clerc P, et al. Involvement of cholecystokinin 2 receptor in food intake regulation: hyperphagia and increased fat deposition in cholecystokinin 2 receptor-deficient mice. Endocrinology. 2007;148:1039–49. doi: 10.1210/en.2006-1064. [DOI] [PubMed] [Google Scholar]
- 32.Chevillard G, Blank V. NFE2L3 (NRF3): the Cinderella of the Cap’n’Collar transcription factors. Cell Mol Life Sci. 2011;68:3337–48. doi: 10.1007/s00018-011-0747-x. [DOI] [PMC free article] [PubMed] [Google Scholar]
Associated Data
This section collects any data citations, data availability statements, or supplementary materials included in this article.