

Abstract
The development of T cells with a regulatory phenotype after thymus transplantation has not been examined previously in complete DiGeorge anomaly (cDGA). Seven athymic infants with cDGA and non-maternal pretransplantation T cell clones were assessed. Pretransplantation forkhead box protein 3 (Foxp3)+ T cells were detected in five of the subjects. Two subjects were studied in greater depth. T cell receptor variable β chain (TCR-Vβ) expression was assessed by flow cytometry. In both subjects, pretransplantation FoxP3+ and total CD4+ T cells showed restricted TCR-Vβ expression. The development of naive T cells and diverse CD4+ TCR-Vβ repertoires following thymic transplantation indicated successful thymopoiesis from the thymic tissue grafts. Infants with atypical cDGA develop rashes and autoimmune phenomena before transplantation, requiring treatment with immunosuppression, which was discontinued successfully subsequent to the observed thymopoiesis. Post-transplantation, diverse TCR-Vβ family expression was also observed in FoxP3+ CD4+ T cells. Interestingly, the percentages of each of the TCR-Vβ families expressed on FoxP3+ and total CD4+ T cells differed significantly between these T lymphocyte subpopulations before transplantation. By 16 months post-transplantation, however, the percentages of expression of each TCR-Vβ family became significantly similar between FoxP3+ and total CD4+ T cells. Sequencing of TCRBV DNA confirmed the presence of clonally amplified pretransplantation FoxP3+ and FoxP3− T cells. After thymus transplantation, increased polyclonality was observed for both FoxP3+ and FoxP3− cells, and pretransplantation FoxP3+ and FoxP3− clonotypes essentially disappeared. Thus, post-transplantation thymic function was associated with the development of a diverse repertoire of FoxP3+ T cells in cDGA, corresponding with immunological and clinical recovery.
Keywords: DiGeorge, FoxP3, repertoire, thymus, transplantation
Introduction
Infants with complete DiGeorge anomaly (cDGA) are born without thymic function, resulting in a severe T cell immunodeficiency 1–5. Approximately 40% of infants with cDGA form T cells spontaneously before thymus transplantation 6,7. These T cells do not express CD45RA, a marker of thymic emigrants; they display limited T cell receptor variable β chain (TCR-Vβ) repertoire diversity by flow cytometry and spectratyping analyses 6–8. The T cells are host-derived and not acquired transplacentally 8. Children with these pretransplantation T cells have an ‘atypical’ form of cDGA with clinical evidence of unregulated T cell-mediated inflammation, including rash from T cell infiltration of the skin, lymphadenopathy and, in some cases, autoimmune tissue damage 6–8. They require immune suppression of the oligoclonal T cells. Allogeneic thymus transplantation in both typical and atypical cDGA results in the development of naive (CD45RA+CD62L+) T cells that express diverse TCR-Vβ repertoires and normal T cell proliferative responses to mitogens and antigens 8–13. In children with atypical cDGA, thymus transplantation results in the ability to discontinue immunosuppressive therapy for those subjects with ‘autoimmune-type’ disease manifestations.
The development of regulatory T cells (Tregs) after thymus transplantation has not been studied in infants with cDGA. The majority of Tregs co-express forkhead box protein 3 (FoxP3) and CD4 after developing in the thymus (‘natural’ Tregs) 14. FoxP3 induction can also occur extrathymically, either from T cell activation or in the generation of ‘induced’ or ‘adaptive’ Tregs 14. The inability to produce a diverse repertoire of natural and adaptive Tregs results in autoimmunity 15–21. Thymus transplantation was shown recently to result in the generation of a diverse repertoire of FoxP3+ T cells with a regulatory phenotype in a child with athymia due to FOXN1 deficiency 22. We wondered whether infants with cDGA would develop a broad repertoire of similar FoxP3+ T cells after thymus transplantation. We further hypothesized that in infants with atypical cDGA who received thymus transplantation, absence of pretransplantation T cell-mediated inflammation after stopping immunosuppression would be associated with increased FoxP3+ T cell diversity. We found that thymus transplantation results in the production of diverse repertoires of FoxP3+ and FoxP3− T cells, which correct the pretransplantation unregulated T cell-mediated inflammation found in children with atypical cDGA.
Materials and methods
Subjects
All subjects were enrolled in protocols approved by the Duke Institutional Review Board and reviewed by the United States Food and Drug Administration. Informed consent for these studies was obtained from a parent of each infant. Seven subjects (Table 1) met criteria for the diagnosis of atypical cDGA 6–8 and were studied. All subjects had clinical features of DiGeorge anomaly (cardiac anomalies, hypoparathyroidism or both), circulating T cells and rash and lymphadenopathy 7. Flow cytometry and spectratyping confirmed that the T cells were oligoclonal (data not shown). The subjects had no detectable circulating maternal T cells 8 pretransplantation. Cyclosporin was started with or without corticosteroids, as per the clinical protocol.
Table 1.
Atypical complete DiGeorge anomaly subject data and characteristics
| Subject | Sex | Age (months) | Time relative to transplant (months) | IS | IS time (months) | Total CD3 (/mm3) | CD4+ T cells (/mm3) | FoxP3 expressed |
|---|---|---|---|---|---|---|---|---|
| DIG113 | M | 3·2 | −0·3 | N | – | 3488 | 1625 | + |
| DIG405 | M | 6·9 | −1·2 | C | 1·8 | 893 | 74 | − |
| DIG406 | M | 7·7 | −6·5 | C | 0·2 | 3404 | 768 | − |
| DIG409 | M | 5·2 | −2·0 | C, S | 2·0 | 104 | 98 | + |
| DIG411 | F | 3·3 | −6·0 | N | – | 2942 | 2209 | + |
| 6·6 | −2·6 | C, S | 3·1 | n.a. | n.a. | + | ||
| 6·8 | −2·5 | C, S | 3·3 | 152 | 110 | + | ||
| 8·6 | −0·6 | C | 5·1 | n.a. | n.a. | + | ||
| 24·8 | +15·5 | N | – | n.a. | n.a. | + | ||
| DIG413 | F | 3·9 | −0·2 | C, S | 0·5 | 7756 | 4126 | + |
| DIG416 | F | 4·1 | −18·0 | N | – | 5791 | 3320 | + |
| 7·8 | −14·3 | C | 3·7 | 566 | 335 | + | ||
| 28·1 | +6·0 | C | 24·0 | 592 | 304 | + | ||
| 31·8 | +9·7 | C | 27·7 | n.a. | n.a. | + | ||
| 34·4 | +12·3 | N | – | 345 | 230 | + |
Information provided include the sex and age of the subject, time relative to allogeneic thymus transplantation, type of immunosuppression and duration of immunosuppression at the time of each sample draw, respectively. For time relative to transplantation, negative numbers designate months before transplantation; positive numbers denote months after transplantation. C: cyclosporin A; F: female; FoxP3: forkhead box protein 3; IS: immunosuppression; M: male; N: none; n.a.: not available; S, systemic corticosteroids.
Quantitative real-time reverse transcription–polymerase chain reaction (RT–PCR) analyses
Peripheral blood mononuclear cells (PBMCs) were separated from whole blood by density centrifugation over Lymphoprep (Axis-Shield, Oslo, Norway). CD4+ T cells (more than 99% purity) were obtained by positive selection using magnetic bead-conjugated antibodies (CD4 MicroBeads, MS columns and MACS Separation Buffer; Miltenyi Biotec, Auburn, CA, USA). Total RNA was extracted from the isolated cells with RNeasy kits (Qiagen, Valencia, CA, USA), according to the manufacturer's instructions. cDNA samples were synthesized using the Qiagen Quantitect Reverse Transcription kit or iScript cDNA Synthesis kit (Bio-Rad, Hercules, CA, USA). Real-time PCR was performed using Bio-Rad iQ SYBR Green Supermix. Forward and reverse primers for FoxP3 were applied as described previously 18. Glyceraldehyde 3-phosphate dehydrogenase served as a housekeeping gene for normalization of gene expression data 23. After 3 min at 95°C in a Bio-Rad iCycler, triplicate samples underwent 45 cycles of 15 s at 94°C followed by 60 s at 60°C. Specific binding of the primers was confirmed by melting curves. Data were collected by the Bio-Rad MyiQ real-time PCR detection system and analysed using Bio-Rad iQ5 software.
Flow cytometry assessments of FoxP3 expression and TCR-Vβ repertoires
Intracellular staining for FoxP3 was performed using an anti-human FoxP3 staining kit (clone PCH101; eBioscience, San Diego, CA, USA), according to the manufacturer's instructions. Fresh and cryopreserved PBMCs were analysed. For subject DIG416 at 18 months pretransplantation, additional antibodies (BD Biosciences, San Jose, CA, USA) were used to assess CD127 expression in FoxP3+ CD4+ cells. Cells were processed in the flow cytometry facility within 24 h of staining, and results were gated using FlowJo software (Tree Star, Ashland, OR, USA).
The TCR-Vβ repertoires of the total and FoxP3+ CD4+ T cell populations in subjects DIG411 and DIG416 were analysed by flow cytometry. Fresh or cryopreserved PBMCs were stained with antibodies that recognized a designated panel of TCR-Vβ families (IOTest Beta Mark kit; Immunotech S.A.S., Marseille, France). The TCR-Vβ nomenclature used to report the flow cytometry data corresponds with the antibodies in this kit. DIG411 was tested pretransplantation using 15 TCR-Vβ antibodies in the kit, based upon a previous analysis that demonstrated the presence of T cells expressing 12 of the 15 TCR-Vβ families. (The combinations of Vβ antibodies supplied by the Beta Mark kit resulted in testing of three additional Vβ families.) All other samples were tested using the full panel of 24 antibodies provided in the kit. CD4 antibodies (clone Leu-3a; BD Biosciences) were included for each sample. The samples were then stained for FoxP3 as described above. To analyse TCR-Vβ expression, the lymphocyte population was gated first according to standard forward- and side-scatter characteristics with subsequent gating for CD4+ cells. Within the lymphocyte gate for these analyses, almost all CD4+ cells were CD3+; fewer than 1% of CD4+ cells were CD14+. The FoxP3+ cells within the CD4+ cells were selected (circled) so that the FoxP3 gate was applied identically across all samples. More than 1000 events were present within these CD4+ FoxP3+ gates. The quadrant gates used for TCR-Vβ expression analysis within the total CD4+ cells were applied to the circled FoxP3+ CD4+ cells. Results for TCR-Vβ5·3 expression in DIG411 pretransplantation were excluded because of technical difficulties (the assay showed non-specific binding).
TCRBV DNA sequencing
TCRBV complementarity determining region 3 (CDR3) genomic DNA sequencing was performed to assess T cell clonality, as described previously 24. Briefly, flow cytometric sorting was performed to collect FoxP3+ and FoxP3− CD4+ T cells from cryopreserved PBMCs. Approximately 35 000 live cells of each population were collected and lysed. Hemi-nested multiplex polymerase chain reactions were performed using 23 TCRBV, 13 external TCRBJ and 13 internal TCRBJ primers 24. The final PCR products were ligated and transformed into Escherichia coli. Individual bacterial colonies were selected randomly, amplified by PCR and then sequenced to obtain the TCRBV CDR3 sequences. The sequence data were analysed using SoDA 25 and IMGT/V-QUEST 26 to identify the presence of identical and non-identical sequences. The analysed samples were collected from subject DIG416 at 14·3 months before thymus transplantation and 7·4 months after thymus transplantation.
Statistical analyses
The TCR-Vβ repertoires of the total and FoxP3+ CD4+ T cell populations were compared by assessing differences in cell percentages between the two populations for each TCR-Vβ family. The total and FoxP3+ CD4+ T cells were expected to have very similar TCR-Vβ repertoires in the healthy adult controls 27. Options for comparison included absolute differences in cell percentages and the ratios of cell percentages. For total CD4+ and FoxP3+ CD4+ T cell populations containing the same TCR-Vβ repertoires, the absolute differences of cell percentages for each TCR-Vβ family would be expected to be close to zero. Similarly, total CD4+ and FoxP3+ CD4+ cell populations with similar TCR-Vβ repertoires should have ratios of cell percentages for each TCR-Vβ family close to 1. We generated 182 differences in percentages among the 24 TCR-Vβ families from eight assessments of seven healthy adults (analysable data were available for only 14 of the TCR-Vβ families for one of the seven adult volunteers). These healthy adult control assays were combined and used to evaluate the distribution of data. Using the healthy adult control data, the ratios for individual TCR-Vβ cell percentages of FoxP3+ to total CD4+ T cells produced a superior distribution of values to the absolute differences by Q-Q plot analysis (kurtosis of 0·34 for ratios versus 11·4 for differences; skewness of 0·27 for ratios versus 0·10 for differences). The adult control data produced a normal distribution of ratios with a mean of 1·0 [standard deviation (s.d.) = 0·2]. This distribution was applied to all results in two-tailed analyses. Ratios of TCR-Vβ expression between the total and FoxP3+ CD4+ T cells were considered significantly outside the normal distribution in either direction when P-values were less than 0·025.
Changes in TCR-Vβ family repertoire matching were evaluated using two-tailed Fisher's exact tests. Each TCR-Vβ family was considered ‘matched’ if the ratio of expression between the total and FoxP3+ CD4+ T cells for that family was determined to be not significantly different and ‘non-matched’ if a significant difference was found. Then numbers of ‘matched’ and ‘non-matched’ TCR-Vβ families for each subject were then compared before and after transplantation using conventional 2 × 2 contingency tables.
Results
Thymopoiesis in infants with cDGA after thymus transplantation
We assessed seven subjects (Table 1) with atypical cDGA who developed rash and lymphadenopathy prior to allogeneic thymus transplantation. These clinical findings were associated with the presence of oligoclonal T cells in the circulation 6–8. Despite significant numbers of T cells, none of the subjects had greater than 50 naive (CD45RA+CD62L+) T cells/mm3; all had naive T cell percentages less than 5% of total T cells (Fig. 1a). Thus, the infants met criteria for congenital athymia and atypical cDGA 13. The subjects were started on systemic immunosuppression in accordance with the clinical protocol, resulting in rapid improvement of the rash and lymphadenopathy.
Figure 1.
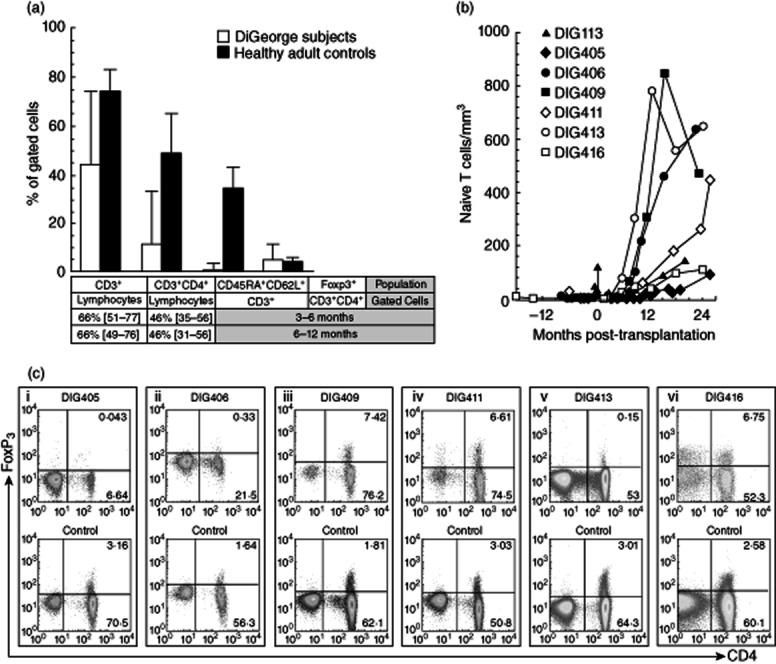
T cells in complete DiGeorge anomaly subjects. (a) T cell percentages (median values with ranges) are shown for complete DiGeorge anomaly subjects DIG405, DIG406, DIG409, DIG411, DIG413 and DIG416 (white bars) and six simultaneously assessed healthy adult controls (black bars). Historical median percentages [with 10th and 90th percentiles] for total and CD4+ T cells are provided for 3–6-month-old and 6–12-month-old infants 32. The percentages of total T cells, CD4+ T cells, naive (CD45RA+CD62L+) T cells and forkhead box protein 3 (FoxP3)+ CD4+ T cells were obtained using the first pretransplantation samples tested for FoxP3 expression after starting immunosuppression. Subject DIG113 was not assessed for FoxP3+ T cells by flow cytometry but had 79% CD3+ lymphocytes (< 3% expressing CD45RA and CD62L) when examined for FoxP3 expression by quantitative real-time polymerase chain reaction (PCR) analysis. (b) Absolute numbers of naive T cells in the peripheral blood are shown for all seven subjects before and after allogeneic thymus transplantation. (c) Flow cytometry results are displayed gated on CD3+ cells. Scatterplots for subjects DIG405, DIG406, DIG409, DIG411, DIG413 and DIG416 are shown in the top row. The examples given are the first pretransplantation samples tested for FoxP3 expression after starting immunosuppression (at 1·2, 6·5, 2·0, 2·6, 0·2 and 14·3 months pretransplantation, respectively). The FoxP3 expression analyses for the healthy adult controls tested simultaneously with the subject samples are displayed in the bottom row.
All recipients demonstrated post-transplantation thymus graft function. They developed naive T cells (Fig. 1b). Immunosuppression was discontinued successfully between 8 and 20 months post-transplantation in all recipients without recurrence of rash and lymphadenopathy.
Detection of pretransplantation FoxP3+ T cells in atypical complete DiGeorge anomaly
Five of seven subjects had FoxP3+ CD4+ T cells present prior to allogeneic thymus transplantation. FoxP3 mRNA expression was identified in CD4+ T cells of subject DIG113 at 0·3 months pretransplantation, subject DIG411 at 6 and 0·6 months pretransplantation and subject DIG416 at 18 months pretransplantation (Table 1). Flow cytometry analyses for subjects DIG405 and DIG406 at 1·2 and 6·5 months before thymus transplantation, respectively, showed no FoxP3 protein expression within T cells (Fig. 1c, panels i and ii). Subjects DIG409, DIG411, DIG413 and DIG416 all had FoxP3+ CD4+ T cells present by flow cytometry (Fig. 1c, panels iii–vi). Concurrent quantitative real-time RT–PCR analyses and flow cytometry testing for DIG411 and DIG416 at 0·6 and 18 months before thymus transplantation, respectively, confirmed simultaneous FoxP3 mRNA and protein expression in the CD4+ T cells. Most of the subjects did not have additional pretransplantation PBMCs available after the screening analyses for further characterization of the FoxP3+ T cells. For subject DIG416, however, extra PBMCs were available from 18 months before thymus transplantation. The PBMCs were reassessed with a larger panel of flow cytometry antibodies. The FoxP3+ CD4+ T cells were CD25+ and CD127lo (data not shown), which could be consistent with a Treg phenotype 28,29. Taken together, these results suggest that most infants with atypical cDGA form FoxP3+ T cell subpopulations before transplantation and that the presence of FoxP3+ T cells does not necessarily indicate normal thymic function in human subjects.
Development of FoxP3+ T cell repertoire diversity after thymus transplantation
Flow cytometry was performed to evaluate TCR-Vβ expression in FoxP3+ and total CD4+ T cells. We studied the TCR-Vβ repertoires in two subjects (DIG411 and DIG416). The other subjects were excluded from these subsequent analyses due to lack of samples. Pretransplantation FoxP3+ and total CD4+ T cells demonstrated restricted TCR repertoire diversity (Fig. 2a). After transplantation, the TCR-Vβ repertoires diversified for both FoxP3+ and overall CD4+ T cells (Fig. 2a).
Figure 2.

T cell receptor variable β chain (TCR-Vβ) repertoires in forkhead box protein 3 (FoxP3)+ and total CD4+ T cells. (a) TCR-Vβ repertoires of FoxP3+ CD4+ T cells (white bars) and total CD4+ T cells (black bars) were assessed by flow cytometry. The various TCR-Vβ families tested are shown along the horizontal axes. Data are shown for adult controls (means with standard error bars), subject DIG411 and subject DIG416. The times before (negative values) or after (positive values) thymus transplantation at which the samples were obtained are shown above each panel. (b) TCR-Vβ repertoires of FoxP3+ CD4+ T cells were compared to the repertoires of total CD4+ T cells. Ratios of the percentages of FoxP3+ to total CD4+ T cells expressing a given TCR-Vβ chain are displayed for various TCR-Vβ families (shown along the x-axes). The dotted lines demarcate 2 standard deviations above and below the mean (1·0) as determined from healthy adult controls. Data are shown for subjects DIG411 and DIG416 (open circles) and concurrently tested healthy adult controls (triangles). The times before or after thymus transplantation at which the samples were obtained are shown above each panel. Significant differences in TCR-Vβ expression between the FoxP3+ CD4+ and total T cell populations for each subject or control, defined as ratios outside the dotted lines, are designated (*P < 0·025; **P < 0·0001).
We also observed differences in matching between FoxP3+ and total CD4+ T cells for percentages of cells expressing individual TCR-Vβ families before thymus transplantation. For DIG411 at 2·5 months before thymus transplantation (Fig. 2b, top left panel), significant differences in percentages between the FoxP3+ gated cells and the overall CD4+ T cells were observed for 13 of the 14 TCR-Vβ families tested. Ten of the families showed highly significant (P < 0·0001) differences in percentages. For DIG416 at 14·3 months before thymus transplantation (Fig. 2b, bottom left panel), significant differences in percentages were found between the FoxP3+ and total CD4+ T cells for 18 of 24 TCR-Vβ families, with 16 of the differences measured as highly significant.
After thymus transplantation, the percentage of FoxP3+ CD4+ T cells expressing each Vβ family of T cell receptors became matched to the percentage of total CD4+ T cells exhibiting the same TCR-Vβ family. For DIG411, who was weaned off immunosuppression at 12 months post-transplantation, a broad distribution of T cells expressing various TCR-Vβ families was observed at 15·5 months post-transplantation (Fig. 2b, top right panel). Disparate TCR-Vβ family expression between the FoxP3+ and total CD4+ T cells was found for only one (TCR-Vβ16) of 24 families (P = 3·5 × 10−8 compared to pretransplantation, Table 2). For DIG416, increased similarity between FoxP3+ and total CD4+ T cells for percentages of cells expressing each TCR-Vβ family was observed by 6 months post-transplantation (Fig. 2b, bottom middle panel). At 9·7 months post-transplantation (not shown in Fig. 2), the percentages of cells expressing various TCR-Vβ families were sufficiently matched to show statistical improvement (P = 0·04, Table 2) from before transplantation, but 10 of 24 TCR-Vβ families still demonstrated significant differences in percentages. At 12·3 months post-transplantation (Fig. 2b, bottom right panel), however, significant differences between the FoxP3+ and overall CD4+ T cells for percentages of cells expressing individual TCR-Vβ families were observed for only four of 24 TCR-Vβ families (P = 1·1 × 10−4, Table 2). The subject had just been able to discontinue immunosuppression successfully at 11·9 months post-transplantation.
Table 2.
Changes in T cell receptor variable β chain (TCR-Vβ) repertoire matching before and after thymus transplantation
| Subject | Time-point | Vβ families matched† | Vβ families non-matched | P‡ |
|---|---|---|---|---|
| DIG411 | Pretransplantation | 1 | 13 | – |
| Post-transplantation (15·5 months) | 23 | 1 | 3·5 × 10−8 | |
| DIG416 | Pretransplantation | 6 | 18 | – |
| Post-transplantation (6 months) | 13 | 11 | 0·08 | |
| Post-transplantation (9·7 months) | 14 | 10 | 0·04 | |
| Post-transplantation (12·3 months) | 20 | 4 | 1·1 × 10−4 |
Individual TCR-Vβ families were ‘matched’ if the ratio of expression between the forkhead box protein 3 (FoxP3)+ and total CD4+ T cells for that family was within the normal distribution (1·0 ± 2 standard deviations).
Changes in numbers of matched and non-matched Vβ families were compared between pretransplantation and post-transplantation samples using two-tailed Fisher's exact tests.
T cell clonotypes before and after thymus transplantation
We investigated FoxP3+ and FoxP3− T cell clonotypes in DIG416 before and after allogeneic thymus transplantation. We did not have extra pretransplantation PBMCs from DIG411 to perform similar studies. The flow cytometry analyses of FoxP3 and TCR-Vβ expression in DIG416 had suggested the presence of clonally expanded FoxP3+ T cells. In order to assess clonotypes directly, we performed genomic DNA sequencing of the TCRBV CDR3 region of FoxP3+ and FoxP3− CD4+ T cells 24. Each unique, non-identical sequence was considered to represent an individual clonotype. Our low-throughput sequencing methods (random sequencing of fewer than 200 sequences per cell population from 35 000 sorted cells) could not be used to evaluate broad TCR-Vβ repertoire differences between the populations. The sequencing analyses were critical for two key assessments: (i) examination of numbers of repeated sequences to validate the presence of clonality and (ii) following the contributions of individual pretransplantation clonotypes to the post-transplantation FoxP3+ and FoxP3− T cell repertoires.
Clonal amplifications of FoxP3+ and FoxP3− T cells were confirmed before thymus transplantation. FoxP3+ T cells had 192 (nine non-CDR3, 72 CDR3 non-shared and 111 CDR3 shared with FoxP3− cells) pretransplantation sequences analysed; 192 (seven non-CDR3, 74 CDR3 non-shared and 111 CDR3 shared with FoxP3+ cells) pretransplantation sequences were obtained similarly from FoxP3− cells (Table 3). Thus, of the total 384 sequences, 16 were non-CDR3 sequences and 368 (183 for FoxP3+ and 185 for FoxP3− T cells) contained the CDR3 region, of which 111 sequences were shared between FoxP3+ and FoxP3− T lymphocytes (Table 3). For pretransplantation FoxP3+ T cells, of the 183 TCRBV sequences identified only 68 unique clonotypes (52 present only in FoxP3+ cells, 16 also found in FoxP3− cells) were present (Table 3). Clonotype sequences were repeated one to 25 times (median four repeats; s.d. 6·9). For pretransplantation FoxP3− T cells, of the 185 TCRBV sequences, 80 clonotypes (64 present only in FoxP3− cells, 16 also observed among FoxP3+ cells) were found (Table 3). Clonotype sequences were repeated one to 33 times (median three repeats, s.d. 8·7).
Table 3.
Relative disappearance of pretransplantation T cell clonotypes and changes in TCRBV CDR3 sequence sharing between forkhead box protein 3 (FoxP3)+ and FoxP3− CD4+ T cells after allogeneic thymus transplantation (DIG416)
| FoxP3+ | FoxP3− | ||||
|---|---|---|---|---|---|
| Non-CDR3 | CDR3 non-shared | CDR3 shared | Non-CDR3 | CDR3 non-shared | |
| Pretransplantation sequences (−14·3 months) | |||||
| From FoxP3+ | 9 | 72 | 111 | ||
| From FoxP3− | 111 | 7 | 74 | ||
| Total shared sequences | 222 | ||||
| Clonotypes | 52 | 16 | 64 | ||
| Observed in post-transplantation FoxP3+ cells | 1† | 1‡ | 0 | ||
| Observed in post-transplantation FoxP3− cells | 0 | 1§ | 1¶ | ||
| Post-transplantation sequences (+7·4 months) | |||||
| From FoxP3+ | 31 | 76 | 1 | ||
| From FoxP3− | 1 | 4 | 67 | ||
| Total shared sequences | 2 | ||||
| Clonotypes | 49 | 1 | 52 | ||
TRBV11-2*03.
Also TRBV11-2*03 but with a different J sequence from VDJ sequence in footnote ‘†’.
TRBV7-2*01.
TRBV10-3*01.
After transplantation, T cells tended to be more polyclonal compared to pretransplantation, consistent with the results of the flow cytometry-based analyses of TCR-Vβ repertoire diversity. A total of 145 (76 FoxP3+ non-shared, one FoxP3+ shared with FoxP3− cells, 67 FoxP3− non-shared, one FoxP3− shared with FoxP3+ cells) CDR3 TCRBV sequences (Table 3) were obtained from FoxP3+ and FoxP3− cells (Table 3). For FoxP3+ cells, 50 clonotypes (49 present only in FoxP3+ cells, one also identified in FoxP3− cells) were found among the 77 CDR3 sequences (Table 3). Clonotype sequences were repeated one to eight times (median 2·5 repeats; s.d. 2·5). For FoxP3− cells, 53 clonotypes (52 present only in FoxP3− cells, one also found among FoxP3+ cells) were identified from the 68 CDR3 sequences (Table 3). Clonotype sequences were repeated one to five times (median 1·5 repeats; s.d. 1·4).
Pretransplantation clonotypes appeared to be suppressed or extinguished within the post-transplantation FoxP3+ and FoxP3− CD4+ T cell populations. Only two TCRBV sequences that were identified in FoxP3+ T cells before transplantation were found in FoxP3+ cells post-transplantation. Pretransplantation FoxP3− T cell clonotypes were also difficult to detect after transplantation: only two TCRBV sequences present in FoxP3− cells before transplantation were seen in FoxP3− cells post-transplantation. One TRBV11-2*03 sequence found in both pretransplantation FoxP3+ and FoxP3− CD4+ T cells was observed only in post-transplantation FoxP3+ CD4+ T cells. One TRBV7-2*01 sequence shared between both pretransplantation populations was found only in post-transplantation FoxP3− CD4+ T cells. No TCRBV sequences were present in all four of the CD4+ T cell populations. Thus, the post-transplantation FoxP3− population did not appear to consist of pretransplantation FoxP3+ clonotypes that had simply down-regulated FoxP3 expression 30 in the single subject tested. It is important to note that the diversification of the post-transplantation cells probably exceeded the limitations of low-throughput sequencing to yield definitive conclusions in these analyses.
Interestingly, we observed remarkable sharing of sequences between FoxP3+ and FoxP3− cells before transplantation that decreased substantially after transplantation. Sixteen pretransplantation FoxP3+ and FoxP3− clonotypes accounted for 60% (222 of 368) of the total TCRBV sequences obtained from the two populations (Table 3). By chance, exactly 111 sequences were contributed equally by FoxP3+ and FoxP3− cells to the 222 shared sequences. The sequence sharing suggested the induction of FoxP3+ T cells from FoxP3− T cells before thymus transplantation. After allogeneic thymus transplantation, sharing of sequences between FoxP3+ and FoxP3− CD4+ T cells decreased substantially. Only one FoxP3+ clonotype was detected among FoxP3− cells (Table 3). A possible explanation for the decreased sequence sharing could include the hypothesis that most of the FoxP3+ T cells after transplantation were natural Tregs produced due to increased thymic function, not cells that had FoxP3 expression induced from FoxP3− cells. Because the data to support this hypothesis remain limited to results from the single subject tested, further analyses are necessary to draw firmer conclusions. Unfortunately, additional samples are not available to extend these investigations.
Discussion
Our findings support the development of T cells with a regulatory phenotype possessing high repertoire diversity and polyclonality in infants with atypical cDGA after thymus transplantation. Before transplantation the subjects required immunosuppression, due presumably to the presence of unregulated, activated pretransplantation T cell clonotypes. Variable-number tandem repeat DNA analyses confirmed that all T cells were host-derived and not of maternal origin. Pretransplantation FoxP3+ and FoxP3− CD4+ T cells in two subjects studied in detail demonstrated restricted TCR-Vβ repertoire diversity. We also used TCRBV sequence analyses in one of these two subjects to confirm the presence of clonally amplified populations of FoxP3+ and FoxP3− T cells in that subject before transplantation. After transplantation, both T cell populations developed diverse TCR-Vβ repertoires. A more polyclonal distribution of FoxP3+ clonotypes was observed in TCRBV sequencing analyses. The sequencing analyses also demonstrated that pretransplantation clonotypes essentially disappeared after thymus transplantation. The changes were associated with the ability of the recipients to discontinue immunosuppression successfully without recurrence of pretransplantation T cell-mediated inflammation. Our results compare favourably with assessments conducted in an infant with congenital athymia due to FOXN1 deficiency, who also received thymus transplantation 22.
Interestingly, we also found an effect of thymus transplantation on skewing of the FoxP3+ CD4+ TCR-Vβ repertoire from the total CD4+ TCR-Vβ repertoire. Before thymus transplantation, the percentages of individual TCR-Vβ families that were expressed, as assessed by flow cytometry, differed significantly between FoxP3+ and total CD4+ T cells. After thymus transplantation, matching of the percentages of TCR-Vβ families expressed by the two populations improved substantially. Similar, unquantified changes were observed in the subject with FOXN1 deficiency after thymus transplantation 22. The exact significance of these findings remains unclear and deserves further investigation. In our analyses, TCRBV sequence sharing was not detected readily between post-transplantation FoxP3+ and FoxP3− T cells. Clearly, exact TCR-Vβ clonotype sequence-matching between Tregs and FoxP3− T cells is neither common nor necessary for control of effector T cells 24. Our findings support the notion that some degree of functional overlap exists within TCR-Vβ families, allowing Tregs that bear a specific TCR to suppress or extinguish clones of effectors possessing receptors that share similar specificities for an autoantigen. At the least, we have shown that comparing percentages of FoxP3+ and total CD4+ T cells expressing individual TCR-Vβ families provides a useful tool for assessing Treg development and reconstitution.
The exact role of pretransplantation FoxP3+ T cells in atypical cDGA remains unclear. Not every subject developed FoxP3+ T cells before transplantation. Pretransplantation sharing of TCRBV sequences between FoxP3+ and FoxP3− T clonotypes suggested that FoxP3 expression was induced. We cannot exclude the possibility that many of the pretransplantation FoxP3+ T cells may have been activated T cell clones or other T cells that up-regulate FoxP3 expression in inflammatory conditions 31. One subject had extra cells available that allowed us to demonstrate low expression of CD127 in the FoxP3+ T cells before transplantation, suggesting a regulatory phenotype 28,29. However, we were unable to test the ability of pretransplantation FoxP3+ cells to suppress because additional samples were not available to conduct standard co-culture assays. Ultimately, most of the pretransplantation FoxP3+ T cell clonotypes were not detected after transplantation.
In summary, thymus transplantation resulted in the development of diverse repertoires of T cells with regulatory phenotypes in subjects with atypical complete DiGeorge anomaly. Our results suggest the significance of thymic function in expanding the human Treg repertoire. Our observations also argue that evaluations of FoxP3+ and total CD4+ TCR-Vβ repertoires should be included in assessments of thymic function. Lastly, thymus transplantation appears to be effective for reconstituting T cells with regulatory phenotypes in congenital athymia from either cDGA or FOXN1 deficiency. Taken together, these findings argue that the effect of thymus transplantation on Treg formation in human subjects deserves further, more extensive investigation.
Acknowledgments
This work was supported by the American Academy of Allergy, Asthma and Immunology 2008 Senior Allergy/Immunology Fellow Transition Award and NIH grants R01 AI 047040, R01 AI 054843, M03 RR 30 (General Clinical Research Center, National Center for Research Resources), T32 AI 007062 28A2 and 2 K12 HD043494 06. This effort was also supported by the intramural research programme of the National Institute of Allergy and Infectious Diseases. The authors appreciate the assistance of Dr J. Michael Cook of the Duke Comprehensive Cancer Center flow cytometry facility in processing samples. The statistical support provided by Dr Yi-Ju Li of the Duke Translational Medicine Institute is kindly acknowledged. The authors express gratitude to Dr Gregory D. Sempowski of the Duke Human Vaccine Institute for assistance with reviewing the manuscript. The authors thank Dr Blythe H. Devlin, Jie Li, Chia-San Hsieh, Dr Bin Li, Stephanie E. Gupton, Elizabeth A. McCarthy, Michele E. Cox and Judy Stelling for technical, laboratory and clinical research support. The clinical care of the subjects provided by the Duke Pediatric Allergy and Immunology faculty and fellows is appreciated. The authors are grateful for the efforts of the referring physicians in obtaining and sending blood samples and data for the research.
Disclosure
I.K.C. has received speaker's fees from Baxter Healthcare Corporation. M.L.M. is a member of the Duke Comprehensive Cancer Center. The other authors declare that they have no competing interests.
References
- 1.DiGeorge AM. Discussion of Cooper MD, Peterson RDA, Good RA. A new concept of cellular basis of immunity. J Pediatr. 1965;67:907–908. [Google Scholar]
- 2.Conley ME, Beckwith JB, Mancer JFK, Tenckhoff L. The spectrum of the DiGeorge syndrome. J Pediatr. 1979;94:883–890. doi: 10.1016/s0022-3476(79)80207-3. [DOI] [PubMed] [Google Scholar]
- 3.Müller W, Peter H, Wilken M, et al. The DiGeorge syndrome. I. Clinical evaluation and course of partial and complete forms of the syndrome. Eur J Pediatr. 1988;147:496–502. doi: 10.1007/BF00441974. [DOI] [PubMed] [Google Scholar]
- 4.Bastian J, Law S, Vogler L, et al. Prediction of persistent immunodeficiency in the DiGeorge anomaly. J Pediatr. 1989;115:391–396. doi: 10.1016/s0022-3476(89)80837-6. [DOI] [PubMed] [Google Scholar]
- 5.Markert ML, Hummell DS, Rosenblatt HM, et al. Complete DiGeorge syndrome: persistence of profound immunodeficiency. J Pediatr. 1998;132:15–21. doi: 10.1016/s0022-3476(98)70478-0. [DOI] [PubMed] [Google Scholar]
- 6.Markert ML, Alexieff MJ, Li J, et al. Postnatal thymus transplantation with immunosuppression as treatment for DiGeorge syndrome. Blood. 2004;104:2574–2581. doi: 10.1182/blood-2003-08-2984. [DOI] [PubMed] [Google Scholar]
- 7.Markert ML, Alexieff MJ, Li J, et al. Complete DiGeorge syndrome: development of rash, lymphadenopathy, and oligoclonal T cells in 5 cases. J Allergy Clin Immunol. 2004;113:734–741. doi: 10.1016/j.jaci.2004.01.766. [DOI] [PubMed] [Google Scholar]
- 8.Markert ML, Devlin BH, Alexieff MJ, et al. Review of 54 patients with complete DiGeorge anomaly enrolled in protocols for thymus transplantation: outcome of 44 consecutive transplants. Blood. 2007;109:4539–4547. doi: 10.1182/blood-2006-10-048652. [DOI] [PMC free article] [PubMed] [Google Scholar]
- 9.Markert ML, Boeck A, Hale LP, et al. Thymus transplantation in complete DiGeorge syndrome. N Engl J Med. 1999;341:1180–1189. doi: 10.1056/NEJM199910143411603. [DOI] [PubMed] [Google Scholar]
- 10.Markert ML, Sarzotti M, Ozaki DA, et al. Thymus transplantation in complete DiGeorge syndrome: immunologic and safety evaluations in 12 patients. Blood. 2003;102:1121–1130. doi: 10.1182/blood-2002-08-2545. [DOI] [PubMed] [Google Scholar]
- 11.Rice HE, Skinner MA, Mahaffey SM, et al. Thymic transplantation for complete DiGeorge syndrome: medical and surgical considerations. J Pediatr Surg. 2004;39:1607–1615. doi: 10.1016/j.jpedsurg.2004.07.020. [DOI] [PubMed] [Google Scholar]
- 12.Markert ML, Devlin BH, Chinn IK, McCarthy EA. Thymus transplantation in complete DiGeorge anomaly. Immunol Res. 2009;44:61–70. doi: 10.1007/s12026-008-8082-5. [DOI] [PMC free article] [PubMed] [Google Scholar]
- 13.Markert ML, Devlin BH, McCarthy EA. Thymus transplantation. Clin Immunol. 2010;135:236–246. doi: 10.1016/j.clim.2010.02.007. [DOI] [PMC free article] [PubMed] [Google Scholar]
- 14.Curotto de Lafaille MA, Lafaille JJ. Natural and adaptive Foxp3+ regulatory T cells: more of the same or a division of labor? Immunity. 2009;30:626–635. doi: 10.1016/j.immuni.2009.05.002. [DOI] [PubMed] [Google Scholar]
- 15.Bennett CL, Christie J, Ramsdell F, et al. The immune dysregulation, polyendocrinopathy, enteropathy, X-linked syndrome (IPEX) is caused by mutations of FOXP3. Nat Genet. 2001;27:20–21. doi: 10.1038/83713. [DOI] [PubMed] [Google Scholar]
- 16.Wildin RS, Ramsdell F, Peake J, et al. X-linked neonatal diabetes mellitus, enteropathy and endocrinopathy syndrome is the human equivalent of mouse scurfy. Nat Genet. 2001;27:18–20. doi: 10.1038/83707. [DOI] [PubMed] [Google Scholar]
- 17.Hori S, Nomura T, Sakaguchi S. Control of regulatory T cell development by the transcription factor Foxp3. Science. 2003;299:1057–1061. [PubMed] [Google Scholar]
- 18.Yagi H, Nomura T, Nakamura K, et al. Crucial role of FOXP3 in the development and function of human CD25+CD4+ regulatory T cells. Int Immunol. 2004;16:1643–1656. doi: 10.1093/intimm/dxh165. [DOI] [PubMed] [Google Scholar]
- 19.Milner JD, Ward JM, Keane-Myers A, Paul WE. Lymphopenic mice reconstituted with limited repertoire T cells develop severe, multiorgan, Th2-associated inflammatory disease. Proc Natl Acad Sci USA. 2007;104:576–581. doi: 10.1073/pnas.0610289104. [DOI] [PMC free article] [PubMed] [Google Scholar]
- 20.Adeegbe D, Matsutani T, Yang J, Altman NH, Malek TR. CD4+ CD25+ Foxp3+ T regulatory cells with limited TCR diversity in control of autoimmunity. J Immunol. 2010;184:56–66. doi: 10.4049/jimmunol.0902379. [DOI] [PMC free article] [PubMed] [Google Scholar]
- 21.Haribhai D, Williams Jason B, Jia S, et al. A requisite role for induced regulatory T cells in tolerance based on expanding antigen receptor diversity. Immunity. 2011;35:1–14. doi: 10.1016/j.immuni.2011.03.029. [DOI] [PMC free article] [PubMed] [Google Scholar]
- 22.Albuquerque AS, Marques JG, Silva SL, et al. Human FOXN1-deficiency is associated with αβ double-negative and FoxP3+ T-cell expansions that are distinctly modulated upon thymic transplantation. PLoS ONE. 2012;7:e37042. doi: 10.1371/journal.pone.0037042. [DOI] [PMC free article] [PubMed] [Google Scholar]
- 23.Walker MR, Kasprowicz DJ, Gersuk VH, et al. Induction of FoxP3 and acquisition of T regulatory activity by stimulated human CD4+CD25− T cells. J Clin Invest. 2003;112:1437–1443. doi: 10.1172/JCI19441. [DOI] [PMC free article] [PubMed] [Google Scholar]
- 24.Scheinberg P, Melenhorst JJ, Hill BJ, et al. The clonal composition of human CD4+CD25+Foxp3+ cells determined by a comprehensive DNA-based multiplex PCR for TCRB gene rearrangements. J Immunol Methods. 2007;321:107–120. doi: 10.1016/j.jim.2007.01.005. [DOI] [PMC free article] [PubMed] [Google Scholar]
- 25.Volpe JM, Cowell LG, Kepler TB. SoDA: implementation of a 3D alignment algorithm for inference of antigen receptor recombinations. Bioinformatics. 2006;22:438–444. doi: 10.1093/bioinformatics/btk004. [DOI] [PubMed] [Google Scholar]
- 26.Brochet X, Lefranc M-P, Giudicelli V. IMGT/V-QUEST: the highly customized and integrated system for IG and TR standardized V-J and V-D-J sequence analysis. Nucleic Acids Res. 2008;36:W503–508. doi: 10.1093/nar/gkn316. [DOI] [PMC free article] [PubMed] [Google Scholar]
- 27.Fazilleau N, Bachelez H, Gougeon M-L, Viguier M. Cutting edge: size and diversity of CD4+CD25high Foxp3+ regulatory T cell repertoire in humans: evidence for similarities and partial overlapping with CD4+CD25 T cells. J Immunol. 2007;179:3412–3416. doi: 10.4049/jimmunol.179.6.3412. [DOI] [PubMed] [Google Scholar]
- 28.Liu W, Putnam AL, Xu-yu Z, et al. CD127 expression inversely correlates with FoxP3 and suppressive function of human CD4+ Treg cells. J Exp Med. 2006;203:1701–1711. doi: 10.1084/jem.20060772. [DOI] [PMC free article] [PubMed] [Google Scholar]
- 29.Seddiki N, Santner-Nanan B, Martinson J, et al. Expression of interleukin (IL)-2 and IL-7 receptors discriminates between human regulatory and activated T cells. J Exp Med. 2006;203:1693–1700. doi: 10.1084/jem.20060468. [DOI] [PMC free article] [PubMed] [Google Scholar]
- 30.Miyao T, Floess S, Setoguchi R, et al. Plasticity of Foxp3+ T cells reflects promiscuous Foxp3 expression in conventional T cells but not reprogramming of regulatory T cells. Immunity. 2012;36:262–275. doi: 10.1016/j.immuni.2011.12.012. [DOI] [PubMed] [Google Scholar]
- 31.Allan SE, Crome SQ, Crellin NK, et al. Activation-induced FOXP3 in human T effector cells does not suppress proliferation or cytokine production. Int Immunol. 2007;19:345–354. doi: 10.1093/intimm/dxm014. [DOI] [PubMed] [Google Scholar]
- 32.Shearer WT, Rosenblatt HM, Gelman RS, et al. Lymphocyte subsets in healthy children from birth through 18 years of age: the pediatric AIDS clinical trials group P1009 study. J Allergy Clin Immunol. 2003;112:973–980. doi: 10.1016/j.jaci.2003.07.003. [DOI] [PubMed] [Google Scholar]