Abstract
Bronchiolitis obliterans syndrome (BOS) is associated with lack of immunosuppression of T cell proinflammatory cytokines and increased T cell granzyme B. Repeated antigen-driven proliferation down-regulates T cell CD28. We hypothesized that down-regulation of CD28 and up-regulation of alternate co-stimulatory molecules (CD134, CD137, CD152 and CD154) on T cells may be associated with BOS. Co-stimulatory molecules, granzyme B, perforin and intracellular cytokines were measured by flow cytometry on T cells from stable lung transplant patients (n = 38), patients with BOS (n = 20) and healthy controls (n = 10). There was a significant increase in the percentage of CD4/28null and CD8/28null T cells producing granzyme B, interferon (IFN)-γ and tumour necrosis factor (TNF)-α in BOS compared with stable patients. Down-regulation of CD28 was associated with steroid resistance and up-regulation of CD134, CD137, CD152 and CD154 on CD4+ T cells and CD137 and CD152 on CD8+ T cells. There was a significant correlation between increased CD28null/CD137 T cells producing IFN-γ, TNF-α with BOS grade (r = 0·861, P < 0·001 for CD28null/CD137 IFN-γ/CD8) and time post-transplant (r = 0·698, P < 0·001 for CD28null/CD137 IFN-γ/CD8). BOS is associated with down-regulation of CD28 and up-regulation of alternate co-stimulatory molecules on steroid-resistant peripheral blood proinflammatory CD4+ and CD8+ T cells. Therapeutic targeting of alternate co-stimulatory molecules on peripheral blood CD28null T cells and monitoring response using these assays may help in the management of patients with BOS.
Keywords: BOS, CD28null, lung transplant, proinflammatory T cells
Introduction
Bronchiolitis obliterans syndrome (BOS) is the single most important factor that limits long-term survival following lung transplantation 1.
We have shown that BOS is associated with lack of immunosuppression of T cell T helper type 1 (Th1) cell proinflammatory cytokines and increased T cell granzyme B by peripheral blood T cells 2,3. Current immunosuppressive therapies target Th1 proinflammatory cells 4; however, they are relatively non-specific and, as we have shown, ineffective at reducing proinflammatory mediators produced by major lymphocyte subsets in the peripheral blood of lung transplant patients undergoing and preceding diagnosis of BOS 2,3,5. Hence, there is an urgent need for new targeted therapy to prevent BOS.
Following adhesion and antigen presentation, T cells require co-stimulatory signals from professional antigen-presenting cells through surface receptors for T cell proliferation and cytokine production 6. Repeated antigen-driven proliferation down-regulates T cell CD28 and expansion of late-differentiated, antigen-specific, oligoclonal T cells 7. Recently, we have shown CD28 down-regulation on CD8+ T cells, the main effector T cells in patients with chronic obstructive pulmonary disease (COPD), another important chronic pulmonary disease 8. We hypothesized that down-regulation of CD28 (to a ‘CD28null’ phenotype) and corresponding up-regulation of alternate co-stimulatory molecules may play an important role in the generation of steroid-resistant cytotoxic molecules such as granzymes/perforin and proinflammatory cytokine production by T cells in BOS. Down-regulation of CD28 expression following persistent antigenic stimulation has also been shown to be associated with up-regulation of CD57 expression, a terminally sulphated carbohydrate determinant found on subsets of natural killer (NK) cells and NK T-like cells associated with ageing 9. Interestingly, we have shown recently that there are increased peripheral blood CD56+CD3+ NK T-like cells in blood from stable lung transplant patients and that these cells exhibit increased production of proinflammatory cytokines interferon (IFN)-γ and tumour necrosis factor (TNF)-α and expression of cytotoxic molecules, perforin and granzymes 10. We hypothesized that dysregulated expression of T cell co-stimulatory molecules may be associated with steroid resistance and BOS, and identify potential new therapeutic targets that are needed urgently to improve the morbidity and mortality rates following lung transplantation. We therefore measured CD28, alternate co-stimulatory molecules CD40L (CD154), CD152 (CTLA-4), CD137 (4-1BB) and CD134 (OX40), granzyme B, perforin and proinflammatory cytokines on peripheral blood T cells from lung transplant patients with stable graft function, BOS and healthy controls.
Materials and methods
Patient and control groups
Twenty lung transplant recipients with clinical and physiological evidence of BOS were invited to participate in the study and fully informed consent was obtained. Ethics approval for the study was obtained from the Royal Adelaide Hospital Ethics Committee (protocol 010711) in compliance with the Helsinki Declaration. Rejection status was also categorized histologically on transbronchial biopsies according to standard criteria 11. Demographic details of these patients are shown in Table 1. Predisposing pathology and other patient demographics are shown in Table 2. As restrictive allograft syndrome is a novel form of chronic allograft dysfunction exhibiting characteristics of peripheral lung fibrosis 12, patients with a Ras phenotype were excluded from the study. Hence, all patients with forced expiratory volume in 1 s (FEV1) < 80% baseline and total lung capacity < 90% baseline were excluded with or without peripheral pulmonary fibrosis, as well as all patients with peripheral lung fibrosis. Thirty-eight lung transplant recipients with stable lung function (FEV1) and no clinical evidence of current acute or chronic rejection or infection were invited to participate in the study. All patients were submitted to the same protocol and analysis performed retrospectively. All transplant patients were at least 8 months post-transplant (median 49 months, range 8–87 months). All patients with clinically significant infections were omitted from the study.
Table 1.
Demographic details of the patient populations studied
| Subjects | Controls | Stable transplant | BOS |
|---|---|---|---|
| No. of subjects | 10 | 38 | 20 |
| †Months post-transplant | 48 | 49 | |
| Age (years) | 48 (± 7) | 42 (± 15) | 44 (± 14) |
| FEV1, % predicted | 100·8 (± 14) | 72·8 (± 24) | 45·8 (± 18) |
| FVC, % predicted | 99·6 (± 12) | 77·9 (± 14) | 53·7 (± 13) |
| FEV1, % FVC | 96·9 (± 15) | 77·5 (± 15) | 45·4 (± 14) |
Median months post-transplant. BOS: bronchiolitis obliterans syndrome; FEV1: forced expiratory volume in 1 s; FVC: forced vital capacity.
Table 2.
Predisposing pathology and other patient demographics
| Patient | Predisposing pathology | CMV | Gender | Time post-transplant at FOB‡ | BOS grade | SLT/DLT | Number prior ACR episodes | Time post-transplant- current | †CsA/Tac levels |
|---|---|---|---|---|---|---|---|---|---|
| 1 | COPD | N | M | 58m | 3 | S | 0 | 70m | Tac 9·8 |
| 2 | CF | N | F | 20m | 1 | D | 0 | 34m | CsA 510 |
| 3 | CF | N | F | 28m | 1 | D | 2 | 23m | Tac 10 |
| 4 | LAM | N | M | 30m | 2 | S | 2 | 22m | CsA 340 |
| 5 | COPD | N | F | 12m | 2 | D | 1 | 46m | CsA 226 |
| 6 | COPD | N | M | 38m | 2 | S | 2 | 60m | Tac 11·8 |
| 7 | UIP | N | M | 17 | 1 | D | 0 | 32m | Tac 12·4 |
| 8 | COPD | N | F | 6m | 1 | D | 1 | 24m | Tac 12·3 |
| 9 | IF | P | F | 28m | 3 | D | 0 | 34m | CsA 243 |
| 10 | Bronchiectasis | N | M | 26m | 1 | D | 1 | 24m | Tac 19 |
| 11 | LAM | N | M | 18m | 3 | D | 1 | 26m | CsA 271 |
| 12 | Bronchiectasis | N | F | 32m | 3 | D | 0 | 42m | Tac 15 |
| 13 | COPD | N | F | 24m | 2 | D | 0 | 36m | Tac 13·4 |
| 14 | IF | N | M | 110m | 2 | S | 1 | 112m | CsA 222 |
| 15 | LAM | N | M | 88m | 3 | D | 2 | 94m | Tac 10·5 |
| 16 | α1 AT/emphysema | N | M | 74m | 2 | D | 1 | 82m | CsA 520 |
| 17 | COPD | N | F | 58m | 2 | D | 1 | 68m | CsA 150 |
| 18 | COPD | N | M | 40m | 1 | S | 2 | 44m | Tac 16 |
| 19 | CF | N | M | 58m | 1 | D | 0 | 62m | CsA 186 |
| 20 | COPD | N | F | 18m | 3 | D | 1 | 54m | Tac 17·5 |
Therapeutic range for cyclosporin A (CsA) (80–250 μg/l) and tacrolimus (Tac) (5–15 μg/l).
Time in months post-transplant at fibreoptic bronchoscopy (FOB). ACR: acute cellular rejection; CF: cystic fibrosis; CMV: cytogegalovirus; COPD: chronic obstructive pulmonary disease; F: female; Grade Rej: rejection grade; IF: idiopathic fibrosis; IPF: interstitial pulmonary fibrosis; LAM: lymphangioleimyomatosis; M: male; N: negative antibody titre; P: positive antibody titre; SLT/DLT: single lung transplant/double lung transplant; UIP: usual interstitial pneumonia.
Immunosuppression therapy comprised combinations of either cyclosporin A (CsA) or tacrolimus (Tac) with prednisolone, and azathioprine or mycophenolate mofetil. Trough plasma drug levels of either CsA or Tac were within or above the recommended therapeutic ranges [range for CsA (80–250 μg/l) and Tac (5–15 μg/l)]. Ten healthy age-matched volunteers with no evidence of lung disease were recruited as controls. Venous blood was collected into 10 U/ml of preservative-free sodium heparin (DBL, Sydney, Australia) and blood samples were maintained at 4°C until processing.
CD3, CD4, CD8 and CD28 expression by T cell subsets
Full blood counts, including white cell differential counts, were determined on blood specimens using a CELL-DYN 4000 (Abbot Diagnostics, Sydney, Australia). One hundred and fifty microlitres of peripheral blood were stained with monoclonal antibodies as reported previously to CD8 fluorescein isothiocyanate (FITC) (BD Biosciences (BD), Sydney, Australia), CD4 phycoerythrin (PE) (BD), CD3 peridinin chlorophyll-cyanine 5·5 (PerCP-Cy5·5) (BD), CD28 PE-Cy7 (BD) and CD45V450 (BD) and analysed as reported previously 8,10,13.
Perforin/granzyme expression by CD28null and CD28+ T cell subsets
To enumerate CD4 and CD8 T cell granzyme B and perforin, 150 ul of peripheral blood was added to fluorescence activated cell sorter (FACS) tubes. To lyse red blood cells, 2 ml of FACSlyse solution (BD) was added and tubes incubated for 10 min at room temperature in the dark. Tubes were decanted after centrifugation at 500 g for 5 min. Cells were permeabilized by the addition of 0·5 ml 1:10 diluted FACSperm (BD) to each tube, mixed and incubated for a further 10 min at room temperature in the dark. Two ml 0·5% bovine serum albumin (Sigma, St Louis, MO, USA) in IsoFlow (Beckman Coulter, Lane Cove, NSW, Australia) was then added and the tubes centrifuged at 300 g for 5 min. After decanting supernatant, Fc receptors were blocked with 10 μl human immunoglobulin (Intragam, CSL, Parkville, Australia) for 10 min at room temperature. Five μl of appropriately diluted anti-CD8 FITC (BD), anti-CD3 PerCP-Cy5·5 (BD), CD28 PE-Cy7 (BD) and PE-conjugated granzyme B (BD), 10 μl undiluted perforin (BD) or isotype control monoclonal antibody was added for 15 min in the dark at room temperature. Cells were analysed within 1 h. Samples were analysed by live gating using FL3 staining versus side-scatter (SSC). A minimum of 10 000 CD3-positive, low-SSC events were acquired in list-mode format for analysis. Control staining of cells with anti-mouse immunoglobulin (Ig)G1-PE/IgG-PC5 was performed on each sample and background readings of < 2% were obtained as described previously 8.
Alternate co-stimulatory molecule expression by T cell subsets
Significant co-stimulatory molecule expression on T cells other than CD28 requires T cell stimulation similar to that required for intracellular cytokine production 14. For CD154, CD152, CD137 and CD134, 1-ml aliquots of blood (diluted 1:2 with RPMI-1640 medium) were placed into 10 ml sterile conical polyvinyl chloride (PVC) tubes (Johns Professional Products, Sydney, Australia). Phorbol myristate (25 ng/ml) and ionomycin (1 mg/ml) were added to stimulate the T cells. Brefeldin A (10 mg/ml) was added to prevent shedding of the co-stimulatory molecules from the T cell surface, as reported previously 15. The tubes were incubated in a humidified 5%CO2/95% air atmosphere at 37°C. At 16 h 100 ml 20 mM ethylenediamine tetraacetic acid/phosphate-buffered saline (EDTA/PBS) was added to the culture tubes, which were vortexed vigorously for 20 s to remove adherent cells. Three hundred microlitre aliquots of cells were treated with 2 ml FACSLyse for 10 min. Cells were centrifuged, supernatant discarded and 500 ml FACSPerm added for 10 min. Two ml 0·5% bovine serum albumin (BSA) (Sigma) in IsoFlow (Beckman Coulter) was then added and the tubes centrifuged at 300 g for 5 min. After decanting supernatant, Fc receptors were blocked with 10 ml human immunoglobulin (Intragam, CSL, Parkville, Victoria, Australia) for 10 min at room temperature. Five μl of appropriately diluted CD8 FITC [allophycocyanin (APC)-Cy7], CD3 PerCP-Cy5·5 (BD), CD28 PE-Cy7 (BD), CD45 V450 (BD) and PE-conjugated monoclonal antibodies to CD40L, CD152, CD137, CD134 or isotype control (BD) were added for 15 min in the dark at room temperature. Cells were washed and events acquired and analysed as described above.
Alternate co-stimulatory molecule and IFN-γ, TNF-α and interleukin (IL)-2 expression by CD28null/CD28+ T cell subsets
To determine the possible association of proinflammatory cytokine expression by CD28null T cells, whole blood was stimulated as described above and stained with various combinations of antibodies to CD28, alternate co-stimulatory molecules and anti-IFN-γ, TNF-α and IL-2. Following stimulation and processing, 5 μl of appropriately diluted IFN-γ Alexa488 (BD), CD3 PerCP·Cy5.5 (BD), CD28 PE-Cy7 (BD), TNF-α V450 (BD), IL-2 Alexa488 (BD), CD45 V500 (BD) and PE-conjugated monoclonal antibodies to CD40L, CD152, CD137, CD134 or isotype control were added for 15 min in the dark at room temperature. Cells were washed and events acquired and analysed as described above.
Inhibitory effect of methylprednisolone on IFN-γ and TNF-α expression by CD28null/CD28+ T cell subsets
Aliquots of whole blood were incubated with 10−6 M methylprednisolone for 18 h then stimulated for cytokine production and analysed as reported previously 8.
Statistical analysis
Statistical analysis was performed using the Kruskal–Wallis test and post-hoc analysis using Mann–Whitney and Spearman's rho correlation tests using spss software and differences between groups of P < 0·05 were considered significant. Corrections for multiple comparisons were not performed.
Results
Blood CD4 and CD8 T cell counts
There was no significant difference in the absolute lymphocyte counts for controls and transplant patients [1·5 (1·4–1·9), 1·6 (1·3–2·1), 1·6 (1·3–2·2) × 109/l, median and range for controls, stable patients and patients with BOS, respectively, P > 0·05].
There was no change in the percentage of CD4 or CD8 T cells between controls or transplant groups (61 ± 11·7, 62 ± 12·8, 60 ± 11·9 CD4 and 39 ± 6·7, 38 ± 6·8, 39 ± 8·1 CD8 T cells for controls, stable transplant and BOS patients, respectively).
CD4 and CD8+ CD28null/T cells
The percentage of CD28null/CD4+ T cells in stable transplant patients was decreased significantly compared to control subjects (Fig. 1). In BOS, there were significant increases in the percentage of both CD28null/CD4+ and CD28null/CD8+ T cells compared with both controls and stable transplant patients (Fig. 1). CD28null/CD8+ T cells were increased significantly when compared to CD28null/CD4+ in patients with BOS (Fig. 1).
Figure 1.
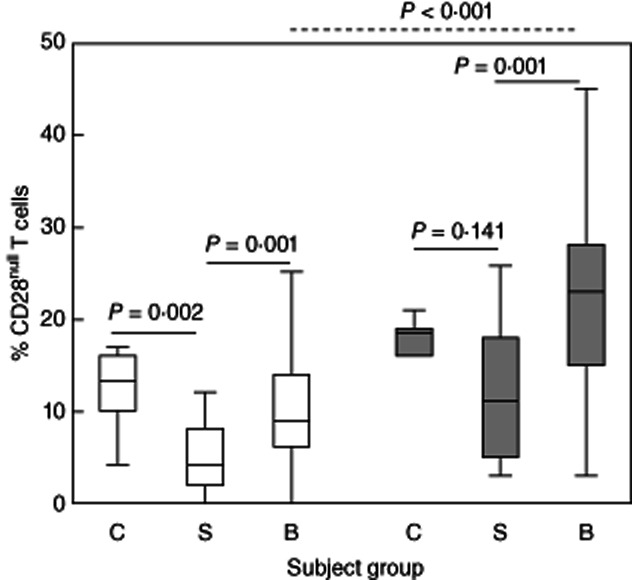
Box-plots showing the percentage of CD28null/CD4+ (clear bars) and CD8+ T cells (grey bars) in control subjects (C), stable transplant patients (S) and patients with bronchiolitis obliterans syndrome (BOS) (B). There was a significant decrease in the percentage of CD28null/CD4+ cells in stable transplant patients compared with controls. There was a significant increase in the percentage of CD28null/CD4+ and CD28null/CD8+ T cells in patients with BOS compared with stable transplant patients. There was a significant increase in the percentage of CD28null/CD8+ T cells compared with CD28null/CD4+ in patients with BOS (dotted line). There were no changes between the percentages of CD4 or CD8/CD28null cells between control subjects and BOS patients (P > 0·05, not shown).
Perforin/granzyme B expression by CD28+ and CD28null T cell subsets
There was a significant increase in the percentage of both CD28null/CD4+ and CD28null/CD8+ T cells expressing perforin in stable transplant patients and in patients with BOS compared with controls (Fig. 2a). A similar increase was noted in the CD28+ subgroup (0·2%, 1·0% and 1·1%; and 0·3%, 2·3% and 2·5% CD28+/perforin+/CD4+ and CD28+/perforin+/CD8+ for controls, stable patients and patients with BOS, respectively) (all P < 0·05).
Figure 2.
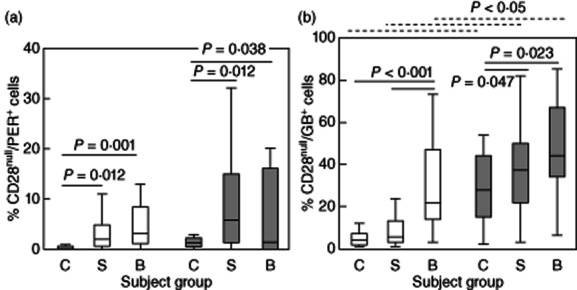
(a) Box-plots showing the percentage of CD28null/perforin+/CD4+ (clear bars) and CD28null/perforin+/CD8+ T cells (grey bars) in control subjects (C), stable transplant patients (S) and patients with BOS (B). There was a significant increase in the percentage of CD28null/perforin+/CD4+ and CD28null/perforin+/CD8+ T cells in stable transplant patients and patients with bronchiolitis obliterans syndrome (BOS) compared with controls. (b) Box-plots showing the percentage of CD28null/granzyme B+ (GB)/CD4+ (clear bars) and CD28null/GB+/CD8+ T cells (grey bars) in control subjects (C), stable transplant patients (S) and patients with BOS (B). There was a significant increase in the percentage of CD28null/GB+/CD4+ and CD28null/GB+/CD8+ T cells in patients with BOS compared with controls. There was a significant increase in the percentage of CD28null/GB+/CD4+ in BOS patients compared with stable transplant patients and CD28null/GB+/CD4+ T cells in stable transplant patients compared with controls. There was a significant increase in the percentage of CD28null/GB+/CD8+ T cells in controls, stable patients and patients with BOS compared with CD28null/GB+/CD4+ cells (dotted line).
There was an increase in the percentage of both CD28null/CD4+ and CD28null/CD8+ T cells expressing granzyme B (GB) in patients with BOS compared with controls (Fig. 2b). For CD4+ T cells expressing GB, the increase was significantly greater in BOS patients compared with stable transplant patients and controls, and in stable transplant patients compared with controls (Fig. 2b). The percentage of CD28null/GB+/CD8+ T cells was higher in all groups compared to the CD4+ subset (Fig. 2b).
There was an increase in GB production by both CD28+/CD4+ and CD28+/CD8+ T cells in stable transplant patients compared with controls (1·4%, 9·5% and 6·8%; and 4·8%, 8·1% and 7·5% CD28+/GB+/CD4+ and CD28+/GB+/CD8+ for controls, stable patients and patients with BOS, respectively) (all P < 0·05) but no differences between stable patients and patients with BOS (all P > 0·05).
IFN-γ, TNF-α and IL-2 expression by CD28null and CD28+ T cell subsets
CD28 expression was unaltered on either CD4 or CD8 T cell subsets following stimulation over this time-period. There was, however, a significant increase in the production of IFN-γ by both CD28null/CD4+ and CD28null/CD8+ T cells in patients with BOS compared with stable transplant patients and controls (Fig. 3a). The percentage of CD28null/IFN-γ/CD8+ T cells was also increased in all groups compared to the CD28null/CD4+ subset (Fig. 3a). There were no significant differences in the percentage of IFN-γ-producing CD28+/CD8+ or CD28+/CD4+ T cells in any of the groups studied {12·5 ± 8·3%, 10·1 ± 7·6% and 11·6 ± 9·1%; and 15·1 ± 8·9%, 15·4 ± 7·1% and 14·6 ± 6·3% CD28+/CD4+/IFN-γ+ and CD28+/IFN-γ+/CD8+ [mean ± standard deviation (s.d.)] for controls, stable patients and patients with BOS, respectively} (all P < 0·05).
Figure 3.
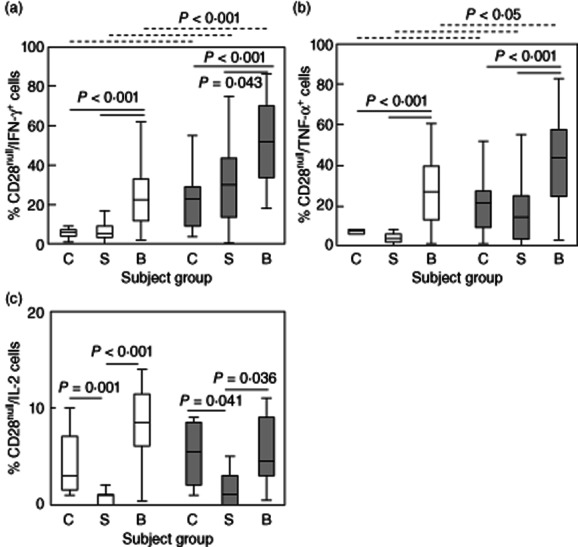
Box-plots showing the percentage of (a) CD28null/interferon (IFN)-γ+/CD4+ (clear bars) and CD28null/IFN-γ+/CD8+ T cells (grey bars) in control subjects (C), stable transplant patients (S) and patients with bronchiolitis obliterans syndrome (BOS) (B). There was a significant increase in the percentage of CD28null/IFN-γ+/CD4+ and CD28null/IFN-γ+/CD8+ T cells in patients with BOS compared with stable transplant patients and controls. There was a significant increase in the percentage of CD28null/IFN-γ+/CD8+ T cells in controls, stable patients and patients with BOS compared with CD28null/IFN-γ+/CD4+ cells (dotted line). (b) CD28null/tumour necrosis factor (TNF)-α+/CD4+ (clear bars) and CD28null/TNF-α+/CD8+ T cells (grey bars) in control subjects (C), stable transplant patients (S) and patients with BOS (B). There was a significant increase in the percentage of CD28null/TNF-α+/CD4+ and CD28null/TNF-α+/CD8+ T cells in patients with BOS compared with stable transplant patients and controls. There was a significant increase in the percentage of CD28null/TNF-α+/CD8+ T cells in controls, stable patients and patients with BOS compared with CD28null/TNF-α+/CD4+ cells (dotted line). (c) CD28null/IL-2+/CD4+ (clear bars) and CD28null/IL-2+CD8+ T cells (grey bars) in control subjects (C), stable transplant patients (S) and patients with BOS (B). There was a significant decrease in the percentage of CD28null/IL-2+/CD4+ and CD28null/IL-2+/CD8+ T cells in stable transplant patients compared with controls. There was a significant increase in the percentage of CD28null/IL-2+/CD4+ and CD28null/IL-2+/CD8+ T cells in patients with BOS compared with stable transplant patients.
There was an increase in the percentage of both CD28nullCD4+ and CD28null/CD8+ T cells producing TNF-α in patients with BOS compared with stable transplant patients and controls (Fig. 3b). The percentage of CD28null/TNF-α/CD8+ T cells was increased compared to CD28null/CD4+ cells in all groups (Fig. 3b). There were no significant changes in the percentage of CD28+/CD8+ or CD28+/CD4+ producing TNF-α between any of the groups studied [12·5 ± 8·9%, 10·1 ± 7·4% and 11·6 ± 6·2%; and −15·1 ± 8·0%, 15·4 ± 9·3% and 14·6 ± 8·4% (mean ± s.d.) CD28+/TNF-α+/CD4+ and CD28+/TNF-α+/CD8+ for controls, stable patients and patients with BOS, respectively] (all P > 0·05).
For IL-2, there was an decrease in the percentage of cytokine-producing CD28null/CD4+ and CD28null/CD8+ T cells in stable transplant patients compared with controls (Fig. 3c), but an increase for both CD4 and CD8+ subsets in patients with BOS compared with both stable transplant patients and controls (Fig. 3c). There was a decrease in the percentage of IL-2-producing CD28+/CD4+ and CD28+/CD8+ cells in stable transplant patients compared with controls and an increase in patients with BOS compared with stable transplant patients [58 ± 19·2%, 18·3 ± 15·5% and 36·6 ± 19·8%; and 19·7 ± 6·4%, 6·9 ± 6·3% and 14·1 ± 17·2% (mean ± s.d.) CD28+/IL-2/CD4+ and CD28+/IL-2/CD8+ for controls, stable patients and patients with BOS, respectively] (all P < 0·05).
Longitudinal studies were performed on three stable lung transplants that subsequently developed BOS (Fig. 4). The percentages of CD28null/CD4+ and CD28null/CD8+ T cells producing IFN-γ and TNF-α for these patients are shown. In brackets are the upper 90% confidence intervals (CI) for the percentage of cells producing cytokine in the stable transplant group. Note the increasing percentages of both CD28null/CD4+ and CD28null/CD8+ T cells producing IFN-γ and TNF-α in all patients preceding BOS compared with the stable patient group. Also note the further increase in the percentage of both CD28null/CD4+ and CD28null/CD8+ T cells producing IFN-γ and TNF-α when patient 3 was diagnosed with stage 3 BOS.
Figure 4.
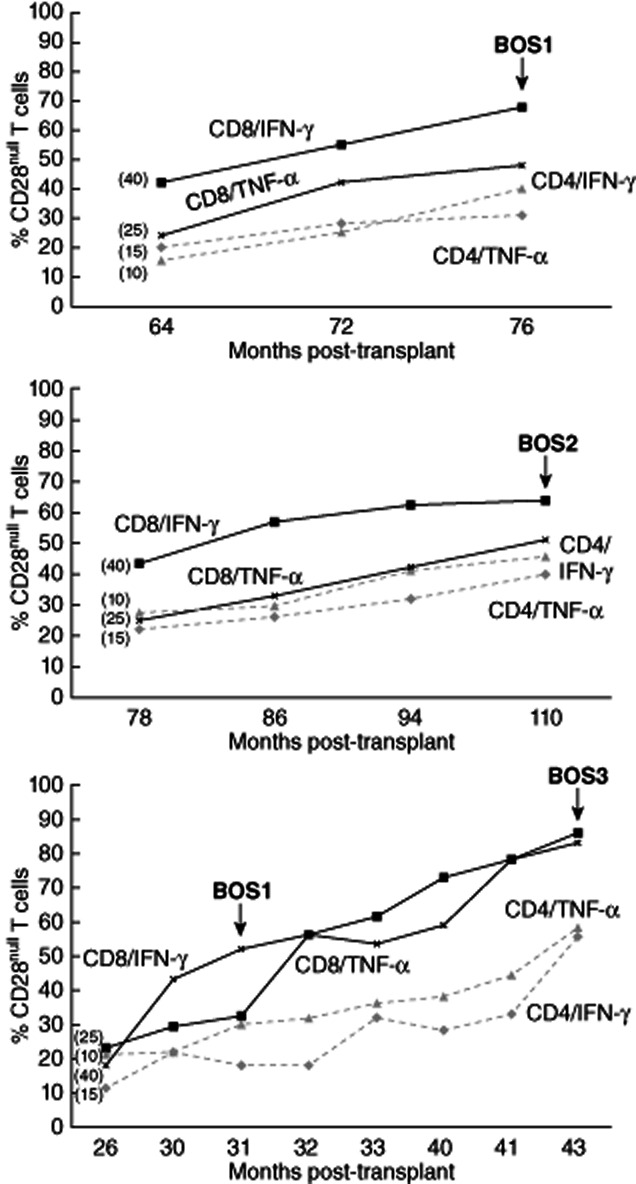
Longitudinal studies were performed on three stable lung transplants that subsequently developed bronchiolitis obliterans syndrome (BOS). The percentage of CD28null/CD4+ and CD28null/CD8+ T cells producing interferon (IFN)-γ and tumour necrosis factor (TNF)-α for these patients are shown. In brackets are the upper 90% confidence interval (CI) for the percentage of cells producing cytokine in the stable transplant group. Note the increasing percentages of both CD28null/CD4+ and CD28null/CD8+ T cells producing IFN-γ and TNF-α in all patients preceding BOS compared with the stable patient group. Also note the further increase in the percentage of both CD28null/CD4+ and CD28null/CD8+ T cells producing IFN-γ and TNF-α when patient 3 was diagnosed with stage 3 BOS.
Alternate co-stimulatory molecule expression by T cell subsets following stimulation
For CD137, there was a significant increase in the percentage of both CD28null/CD4+ and CD28null/CD8+ T cells expressing this co-stimulatory receptor in patients with BOS compared with stable transplant patients and controls (Fig. 5a). The increase was significantly greater for the CD8+ subset compared with the CD4+ cells for all groups (Fig. 5a). For CD28+ cells (both CD8 and CD4 subsets) there was decreased expression of CD137 in stable transplant patients and patients with BOS compared with controls [75 ± 22·2%, 33·6 ± 18·6% and 37·1 ± 18·7%; and 60·1 ± 21·4%, 31·5 ± 16·7% and 28·3 ± 18·2% (mean ± s.d.) CD28+/CD137+/CD4+ and CD28+/CD137+/CD8+ for controls, stable patients and patients with BOS, respectively] (all P < 0·05).
Figure 5.
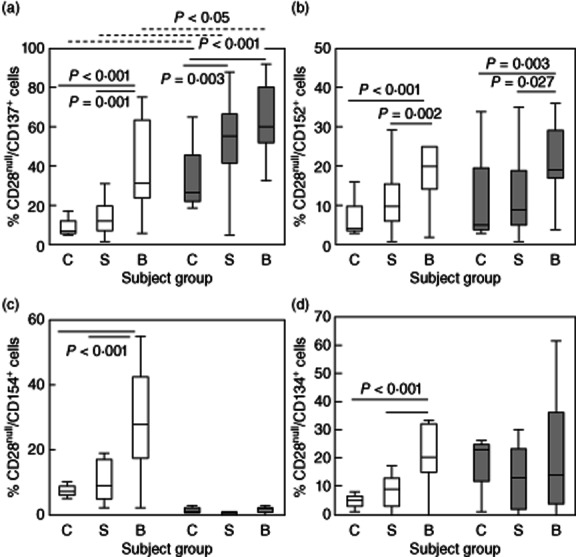
Box-plots showing the percentage of (a) CD28null/CD137+/CD4+ (clear bars) and CD28null/CD137+/CD8+ T cells (grey bars) in control subjects (C), stable transplant patients (S) and patients with bronchiolitis obliterans syndrome (BOS) (B). There was a significant increase in the percentage of CD28null/CD137+/CD4+ and CD28null/CD137+/CD8+ T cells in patients with BOS compared with stable transplant patients and controls. There was a significant increase in the percentage of CD28null/CD137+/CD8+ T cells in controls, stable patients and patients with BOS compared with CD28null/CD137+/CD4+ cells (dotted line). (b) CD28null/CD152+/CD4+ (clear bars) and CD28null/CD152+/CD8+ T cells (grey bars) in control subjects (C), stable transplant patients (S) and patients with BOS (B). There was a significant increase in the percentage of CD28null/CD152+/CD4+ and CD28null/CD152+/CD8+ T cells in patients with BOS compared with stable transplant patients and controls. (c) CD28null/CD154+/CD4+ (clear bars) and CD28null/CD154+/CD8+ T cells (grey bars) in control subjects (C), stable transplant patients (S) and patients with BOS (B). There was a significant increase in the percentage of CD28null/CD154+/CD4+ T cells in patients with BOS compared with stable transplant patients and controls. (d) CD28null/CD134+/CD4+ (clear bars) and CD28null/CD134+/CD8+ T cells (grey bars) in control subjects (C), stable transplant patients (S) and patients with BOS (B). There was a significant increase in the percentage of CD28null/CD134+/CD4+ T cells in patients with BOS compared with stable transplant patients and controls.
For CD152, there was a significant increase in the percentage of both CD28null/CD4+ and CD28null/CD8+ T cells expressing this co-stimulatory receptor in patients with BOS compared with stable transplant patients and controls (Fig. 5b).
There were no significant changes in expression of CD152 by CD28+ (either CD4+ or CD8+) for any group [50·5 ± 18·9%, 42·8 ± 18·9% and 39·4 ± 20·1%; and 19·0 ± 10·6%, 14·7 ± 12·3% and 12·8 ± 11·9% (mean ± s.d.) CD28+/CD152+/CD4+ and CD28+/CD152+/CD8+ for controls, stable patients and patients with BOS, respectively] (all P > 0·05).
For CD154, there was a significant increase in the percentage of CD28null/CD4+ (note: unchanged in the CD8+ subset) expressing this co-stimulatory receptor in patients with BOS compared with stable transplant patients and controls (Fig. 5c). There was decreased expression in the CD28+/CD4+ subset compared to the CD8+ subset in stable transplant patients and patients with BOS compared with controls [81 ± 19·9%, 63·1 ± 17·1% and 48·9 ± 24·2%; and 16·9 ± 4·6%, 6·0 ± 3·1% and 6·4 ± 4·7% (mean ± s.d.) CD28+/CD4+/CD152+ and CD28+/CD8+/CD152+ for controls, stable patients and patients with BOS, respectively] (all P > 0·05).
For CD134, there was significantly increased expression by CD28null/CD4+ T cells (note: unchanged in the CD8+ subset) in patients with BOS compared with stable transplant patients and controls (Fig. 5d). There were no differences in the percentage of CD28+/CD4+ and CD28+/CD8+ cells expressing CD134 in stable transplant patients and patients with BOS compared with control subjects [52·0 ± 21·3%, −51·3·1 ± 22·7% and 35·5 ± 28·2%; and 28·1 ± 16·4%, 18·6 ± 17·8% and 13·8 ± 12·9% (mean ± s.d.) CD28+/CD134+/CD4+ and CD28+/CD134+/CD8+ for controls, stable patients and patients with BOS, respectively] (all P > 0·05).
Correlation between proinflammatory cytokines, co-stimulatory molecules and months post-transplant
There were significant correlations between months post-transplant for all transplant patients, and the percentages of CD28null/IFN-γ/CD8+ cells (r = 0·575, P < 0·001); CD28null/TNF-α/CD4+ cells (r = 0·375, P = 0·007); CD28null/TNF-α/CD8+ cells (r = 0·483, P < 0·001); CD28null/CD137+/CD8+ cells (r = 0·585, P = 0·005), CD28null/CD154+/CD4+ cells (r = 0·536, P = 0·022); CD28null/CD137+/IFN-γ/CD8+ (r = 0·698, P < 0·001); CD28null/CD137+/IFN-γ/CD4+ (r = 0·468, P = 0·038); CD28null/CD137+/IFN-γ/CD8+ (r = 0·654, P < 0·001); CD28null/CD137+/IFN-γ/CD4+ (r = 0·467, P = 0·032); but no other correlations between any other groups including CD28+ subsets (P > 0·05 for all).
Correlation between proinflammatory cytokines and co-stimulatory molecules following stimulation
There was a correlation between CD28null/IFN-γ/CD8+ and CD28null/CD137+/CD8+ (Fig. 6) and CD28null/TNF-α/CD8+ and CD28null/CD137+/CD8+ (r = 0·563, P = 0·015, but no other correlations between any other groups including CD4+ and CD28+ subsets) (all P > 0·05).
Figure 6.
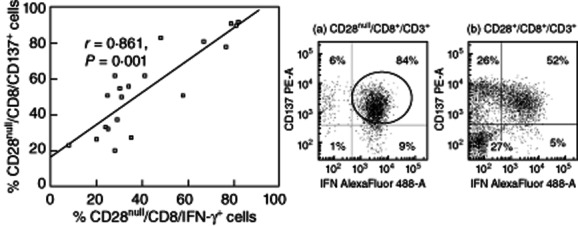
Scatter-plots showing a significant correlation between the percentages of CD28null/CD8/CD137+ cells and CD28null/CD8/interferon (IFN)-γ+ T cells in patients with bronchiolitis obliterans syndrome (BOS). Representative dot-plots of IFN-γ Alexa488 versus CD137 phycoerythrin (PE) of CD28null/CD8+/CD3+ cells from a patient with BOS (a) showing a strong association between CD137+ cells and IFN-γ+ in CD28null/CD8+T cells (circled) but not in CD28+/CD8+/CD3+ T cells (b).
Correlation between proinflammatory cytokines, co-stimulatory molecules and BOS grade
There was a correlation between BOS grade and CD28null/CD137/IFN-γ/CD4+ (r = 0·518, P = 0·021); CD28null/CD137/IFN-γ/CD8+ (r = 0·861, P < 0·001) (Fig. 7); CD28null/TNF-α/CD4+ (r = 0·487, P = 0·037); CD28null/TNF-α/CD8+ (r = 0·692, P < 0·001), but no other correlations between any other groups, including CD28+ subsets (all P > 0·05).
Figure 7.
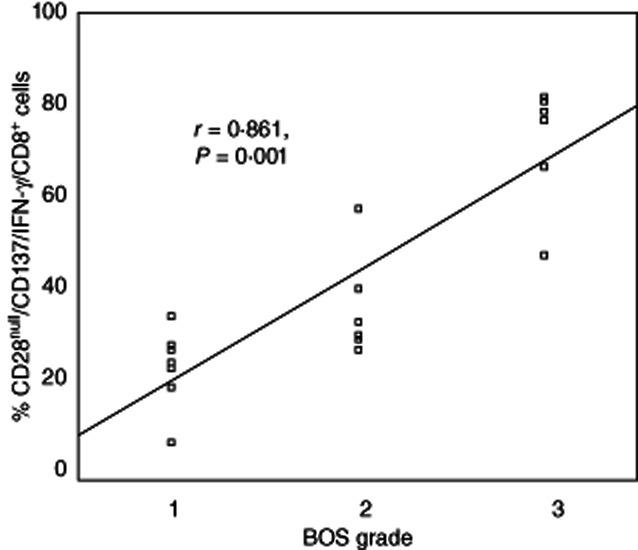
Scatter-plots showing a significant correlation between the percentage of CD28null/CD137/interferon (IFN)-γ/CD8 cells and bronchiolitis obliterans syndrome (BOS) grade in transplant patients.
There was a correlation between CD28null/CD8+ T cells and FEV1 (r = −0·675, P = 0·001).
Inhibitory effect of methylprednisolone on IFN-γ, TNF-α expression by CD28null/CD28+ T cell subsets
There was a significant increase in the percentage of CD28nullCD4+ and CD8CD28null T cells producing IFN-γ and TNF-α than CD28+ subsets (Fig. 8). CD28nullCD4+ and CD8CD28null T cells were more resistant to the inhibitory effects of 10−6 M methylprednisolone on TNF-α and IFN-γ production in vitro compared with CD28+CD8+ T cells.
Figure 8.
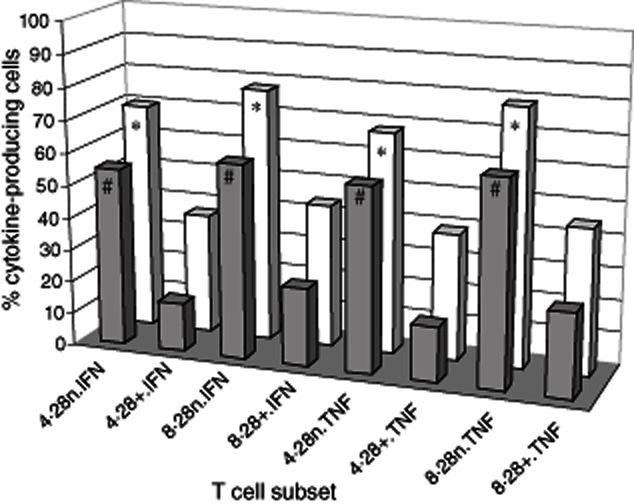
Three-dimensional column plots showing the percentage of CD28null and CD28+/CD4 and CD8 T cells producing tumour necrosis factor (TNF)-α and interferon (IFN)-γ in whole blood following stimulation (clear bars) (mean of five experiments). There was a significant increase in the percentage of CD28null/CD4+ (4·28n) and CD8/CD28null (8·28n) T cells producing IFN-γ and TNF-α than CD28+ subsets (all *P < 0·05). CD28null/CD4+ and CD28null/CD8+ T cells were more resistant to the inhibitory effects of 10−6 M methylprednisolone on TNF-α and IFN-γ production (dark bars) in vitro compared with CD28+ subsets (all *P < 0·05) (mean of five experiments).
Discussion
This is the first study to show that CD28 down-regulation on peripheral blood CD8 T cells is associated with BOS. Persistent antigenic stimulation has been shown to down-regulate CD28 expression progressively and irreversibly on CD8+ T cells and also CD4+ T cells, although at substantially lower frequencies, findings consistent with our current study 16. We have shown that stable transplant patients have decreased numbers of CD28null/CD4+ T cells compared with healthy aged-matched control subjects, although there were no differences in CD28null/CD8+ cells between these groups, suggesting that current therapeutics may be more effective at inhibiting persistent antigenic stimulation of CD4 rather than CD8+ T cells. However, BOS was associated with increased percentages of both CD28null/CD4+ and CD28null/CD8+ T cells, suggesting that therapeutics fail to prevent oligoclonal stimulation and proliferation of both CD28null/T cell subsets. Furthermore, these CD28null T cells are relatively resistant to a commonly used steroid to treat these patients. Consistent with these findings, a previous study showed that CD28null/CD4+ cells were increased in patients with BOS and that these cells were relatively resistant to the anti-proliferative effects of cyclosporin A 17. However, although this study showed that CD28null/CD4+ cells were associated with increased granzyme, perforin and proinflammatory cytokines, they did not study CD28null/CD8+ cells nor did they examine other co-stimulatory molecules that may play a role in driving the proliferation and cytotoxic potential of CD28null T cell subsets.
Our study shows that both CD4+/CD28null and CD8+/CD28null T cells from stable patients express increased perforin and granzyme B and hence have a higher cytotoxic potential than their CD28+ T cell counterparts. The percentage of both CD28null subsets expressing perforin and granzyme levels are increased further in patients with BOS with a greater percentage of CD28null/CD8+ cells expressing these cytotoxic molecules, suggesting that the CD28null/CD8+ subset is potentially the most cytotoxic subset. T cells have been shown to migrate to the lung and re-enter the circulation and, as such, these cytotoxic cells identified in the peripheral blood of these patients may be reflective of cell populations in the lungs of these patients 18. We have shown previously that BOS is associated with increased granzyme B, IFN-γ and TNF-α by CD4 and CD8 T cell subsets 2,3. We now show that CD28null CD4 and CD8 T cell subsets (not their CD28+ counterparts) are the producers of these increased cytotoxic/proinflammatory molecules. The findings of a correlation between CD28null/CD8+ T cells and FEV1 suggest that this T cell subset may be associated with a decline in lung function. Our findings are consistent with other reports of CD28null/CD8+ T cells with high cytotoxic potential in other inflammatory diseases 19–21. Interestingly, cytotoxic CD28null/CD8+ T cells containing high levels of perforin/granzyme have been shown to be increased in sputum from asthmatic patients 22.
Our present study shows that the percentage of both CD28+ and CD28null T cells producing IL-2 was decreased in stable patients compared with healthy controls (consistent with effective therapeutic strategy), while in BOS the percentage was increased, suggesting that strategies applied currently to suppress IL-2 production in BOS may be ineffective. To our knowledge, this is the first study to show an increase in IL-2 production by both CD28+ and CD28null subsets in an inflammatory disease.
While CD28 is the major co-stimulatory molecule on T cells, we hypothesized that following persistent antigenic stimulation, this molecule would be down-regulated and that other co-stimulatory molecules would then play an important role in the co-stimulatory signal required for effective proliferation and cytokine production 6. Consistent with this hypothesis, we showed that both CD137 and CD152 co-stimulatory molecules were up-regulated on CD28null (both CD4+ and CD8+) T cells in BOS, suggesting that alternate co-stimulation to CD28 may be important in the production of cytotoxic T cells at the time of graft failure. CD154 and CD134 expression was also increased on CD28null T cells, but only on the CD4+ subset, suggesting that these co-stimulatory molecules may be important in CD28null/CD4+ proliferation and cytokine production, and targeting these molecules may have potential in reducing CD28null/CD4+ driven inflammation.
The longitudinal studies on three patients that subsequently developed BOS suggests that serially monitoring the percentage of CD4/CD28null and CD8/CD28null subsets producing IFN-γ and TNF-α may prove useful in predicting the development of BOS in patients following lung transplantation. The correlation between CD28null/CD8+ T cells and FEV1 suggests that enumeration of this subset may further simplify monitoring of potential BOS development in patients. However, one must also be cautious in drawing definite conclusions from this small cross-sectional study, particularly the exact role that CD4/CD28null and CD8/CD28null play in the development of BOS, and further longitudinal patient studies are required to confirm these findings.
In conclusion, BOS is associated with down-regulation of CD28 and up-regulation of alternate co-stimulatory molecules on steroid-resistant CD4+ and CD8+ T cells. Early therapeutic targeting of alternate T cell co-stimulatory molecule expression following transplant and monitoring response using these assays may elucidate the exact role played by alternate co-stimulatory molecules in lung transplant rejection and may possibly help to manage patients with BOS, where current treatments are ineffective and following progress is limited to lung function.
Acknowledgments
This study was funded by a National Health and Medical Research Council grant.
Disclosure
The authors have no conflicts of interest.
References
- 1.Lama R, Santos F, Alvarez A, et al. Analysis of lung transplant recipients surviving beyond 5 years. Transplant Proc. 2005;37:1523–1525. doi: 10.1016/j.transproceed.2005.02.032. [DOI] [PubMed] [Google Scholar]
- 2.Hodge S, Hodge G, Ahern J, et al. Increased levels of T cell granzyme B in BOS are not suppressed adequately by current immunosuppressive regimens. Clin Exp Immunol. 2009;158:230–236. doi: 10.1111/j.1365-2249.2009.04008.x. [DOI] [PMC free article] [PubMed] [Google Scholar]
- 3.Hodge G, Hodge S, Chambers D, Reynolds PN, Holmes M. Bronchiolitis obliterans syndrome is associated with absence of suppression of peripheral blood Th1 pro-inflammatory cytokines. Transplantation. 2009;88:211–218. doi: 10.1097/TP.0b013e3181ac170f. [DOI] [PubMed] [Google Scholar]
- 4.Corris PA, Kirby JA. A role for cytokine measurement in therapeutic monitoring of immunosuppressive drugs following lung transplantation. Clin Exp Immunol. 2005;139:176–179. doi: 10.1111/j.1365-2249.2005.02711.x. [DOI] [PMC free article] [PubMed] [Google Scholar]
- 5.Hodge G, Hodge S, Li-Liew C, Chambers D, Reynolds PN, Holmes M. Lymphocytic bronchiolitis is associated with inadequate suppression of blood T-cell granzyme B, IFNγ and TNFα. Transplantation. 2010;89:1283–1289. doi: 10.1097/TP.0b013e3181d75971. [DOI] [PubMed] [Google Scholar]
- 6.Guinan EC, Gribben JG, Bousiottis V, Freeman GJ, Nadler LM. Pivotal role of the B7:CD28 pathway in transplantation tolerance and tumour immunity. Blood. 1994;84:3261–3282. [PubMed] [Google Scholar]
- 7.Strioga M, Pasukoniene V, Characiejus D. CD8+CD28– and CD8+CD57+ T cells and their role in health and disease. Immunology. 2011;134:17–32. doi: 10.1111/j.1365-2567.2011.03470.x. [DOI] [PMC free article] [PubMed] [Google Scholar]
- 8.Hodge G, Mukaro V, Reynolds PN, Hodge S. Role of increased CD8/CD28(null) T cells and alternative co-stimulatory molecules in chronic obstructive pulmonary disease. Clin Exp Immunol. 2011;166:94–102. doi: 10.1111/j.1365-2249.2011.04455.x. [DOI] [PMC free article] [PubMed] [Google Scholar]
- 9.Bandres E, Merino J, Vasquez B, Inoges S, Moreno C, Subira ML. The increase of IFN-gamma production through aging correlates with the expanded CD8+highCD28–CD57+ subpopulation. Clin Immunol. 2000;96:230–235. doi: 10.1006/clim.2000.4894. [DOI] [PubMed] [Google Scholar]
- 10.Hodge G, Hodge S, Liew-Holmes CL, Reynolds PN, Holmes M. Increased natural killer T-like cells are a major source of pro-inflammatory cytokines and granzymes in lung transplant recipients. Respirology. 2011;17:155–163. doi: 10.1111/j.1440-1843.2011.02075.x. [DOI] [PubMed] [Google Scholar]
- 11.Stewart S, Fishbein MC, Snell GI, et al. Revision of the 1996 working formulation for the standardization of nomenclature in the diagnosis of lung rejection. J Heart Transplant. 2007;26:1229–1242. doi: 10.1016/j.healun.2007.10.017. [DOI] [PubMed] [Google Scholar]
- 12.Sato M, Waddell TK, Wagnetz U, et al. Restrictive allograft syndrome (RAS): a novel form of chronic lung allograft dysfunction. J Heart Lung Transplant. 2011;30:735–742. doi: 10.1016/j.healun.2011.01.712. [DOI] [PubMed] [Google Scholar]
- 13.Hodge G, Hodge S, Reynolds P, Holmes M. Intracellular cytokines in blood T cells in lung transplant patients – a more relevant indicator of immunosuppression than drug levels. Clin Exp Immunol. 2005;139:159–164. doi: 10.1111/j.1365-2249.2005.02671.x. [DOI] [PMC free article] [PubMed] [Google Scholar]
- 14.Hodge G, Han P. Effect of Factor VIII on antigen presenting cell (APC)/T cell interactions in vitro: relevance to inhibitor formation and tolerance induction. Br J Haematol. 2000;109:195–200. doi: 10.1046/j.1365-2141.2000.01994.x. [DOI] [PubMed] [Google Scholar]
- 15.Hodge G, Mukaro V, Reynolds PN, Hodge S. Role of increased CD8/CD28(null) T cells in alternative co-stimulatory molecules in chronic obstructive pulmonary disease. Clin Exp Immunol. 2011;166:94–102. doi: 10.1111/j.1365-2249.2011.04455.x. [DOI] [PMC free article] [PubMed] [Google Scholar]
- 16.Vallejo AN. CD28 extinction in the human T cells: altered functions and the program of T-cell senescence. Immunol Rev. 2005;205:158–169. doi: 10.1111/j.0105-2896.2005.00256.x. [DOI] [PubMed] [Google Scholar]
- 17.Struder S, George P, Zhu X, et al. CD28 down-regulation of CD4 T cells is a marker for graft dysfunction in lung transplant recipients. Am J Respir Crit Care Med. 2008;178:765–773. doi: 10.1164/rccm.200701-013OC. [DOI] [PMC free article] [PubMed] [Google Scholar]
- 18.Lehman C, Wilkening A, Lieber N, et al. Lymphocytes in the bronchiolar space reenter the lung tissue by means of the alveolar epithelium, migrate to regional lymph nodes, and subsequently rejoin the systemic immune system. Anat Rec. 2001;264:229–236. doi: 10.1002/ar.1163. [DOI] [PubMed] [Google Scholar]
- 19.LePriol Y, Puthier D, Lecureuil C, et al. High cytotoxic and migratory potencies of senescent CD8+CD57+ cells in HIV-infected and uninfected individuals. J Immunol. 2006;177:5145–5155. doi: 10.4049/jimmunol.177.8.5145. [DOI] [PubMed] [Google Scholar]
- 20.Sada-Ovalle I, Torre-Bouscoulet L, Valdez-Vaquez R, Martinez-Cairo S, Zenito E, Lascurain R. Characterisation of a cytotoxic CD57+ T cell subset from patients with pulmonary tuberculosis. Clin Immunol. 2006;121:314–323. doi: 10.1016/j.clim.2006.08.011. [DOI] [PubMed] [Google Scholar]
- 21.Fasth AE, Dastmalchi M, Rahbar A, et al. T cell infiltrates in the muscles of patients with dermatomyositis and polymyositis are dominated by CD28null T cells. J Immunol. 2009;183:4792–4799. doi: 10.4049/jimmunol.0803688. [DOI] [PubMed] [Google Scholar]
- 22.Hamzaoui A, Chaouch N, Grairi H, Amnar J, Hamzaoui K. Inflammatory processes of CD8+ CD28− T cells in induced sputum from asthmatic patients. Mediators Inflamm. 2005;205:160–166. doi: 10.1155/MI.2005.160. [DOI] [PMC free article] [PubMed] [Google Scholar]


