

Abstract
Structural brain measures are employed as endophenotypes in the search for schizophrenia susceptibility genes. We analyzed two independent structural imaging datasets with voxel-based morphometry and with source-based morphometry, a multivariate, independent components analysis, to determine the stability and heritability of regional gray matter concentration abnormalities in schizophrenia. The samples comprised 209 and 102 patients with schizophrenia and 208 and 96 healthy volunteers, respectively. The second sample additionally included non-ill siblings of participants with and without schizophrenia. A standard voxel-based analysis showed reproducible regional gray matter deficits in the affected participants compared with unrelated, unaffected controls in both datasets: patients showed significant gray matter concentration deficits in cortical frontal, temporal, and insular lobes. Source-based morphometry (SBM) was applied to the gray matter images of the entire sample to determine the effects of diagnosis on networks of covarying structures. The SBM analysis extracted 24 significant sets of covarying regions (components). Four of these components showed significantly lower gray matter concentrations in patients (p < .05). We determined the familiality of the observed SBM components based on 66 sibling pairs (25 discordant for schizophrenia). Two components, one including the medial frontal, insular, inferior frontal, and temporal lobes, and the other including the posterior occipital lobe, showed significant familiality (p < .05). We conclude that structural brain deficits in schizophrenia are replicable, and that SBM can extract unique familial and likely heritable components. SBM provides a useful data reduction technique that can provide measures that may serve as endophenotypes for schizophrenia.
Keywords: Schizophrenia, brain structure, heritability, Independent Components Analysis
Volumetric analysis has been used for at least 20 years in studies of schizophrenia and healthy volunteers, exploring the structural changes that herald the onset of schizophrenia (Steen et al., 2006), relate to various clinical or cognitive symptoms (Antonova et al., 2004; Flashman & Green, 2004; Koutsouleris et al., 2008; Marsh et al., 2001), or reflect the effects of medication (Boonstra et al., 2011; Puri, 2011). The most replicated structural brain abnormalities observed in patients with chronic schizophrenia are enlargement of the lateral and, sometimes, third ventricles, and decreases in whole brain volume and gray matter volume, temporal lobe volume, and hippocampal volume (Honea et al., 2005). Using voxel-based morphometry methods (Ashburner & Friston, 2000), loss of gray matter concentration or density in chronic schizophrenia is consistently found in the superior temporal gyrus, medial temporal lobes, medial frontal lobe, inferior frontal lobe, parahippocampal gyrus, and anterior cingulate (Giuliani et al., 2005; Honea, et al., 2005; Meda et al., 2008; Segall et al., 2009).
Structural measures from MRI are potentially useful endophenotypes (Bearden et al., 2007; van Haren et al., 2008) because genetic influence on brain volume and shape across individuals is significant (for review, see Glahn et al., 2007; Thompson et al., 2002). Heritability measures quantify the proportion of variation in a trait that is attributable to genetics, as opposed to environmental or other factors. Family and twin studies of healthy subjects comparing similarity of brain measures show that whole brain volume and grey and white matter volumes are the most heritable (over 80%). Brain lobe volumes show somewhat lower heritability estimates (with the frontal lobes being the most heritable at 65% and the occipital lobe being the least at 33%), and more subtle variations such as specific regional volumes or the shape of various sulci are even lower (Bartley et al., 1997; Glahn, et al., 2007). Hippocampal volumes are less heritable than more global measures, and reflect stronger environmental effects, at least in schizophrenia (van Erp et al., 2004), but the heritability is still not negligible (Sullivan et al., 2001). The heritability of cortical thickness, rather than volume, varies across the brain surface, with high heritability in the frontal lobes, sensorimotor areas, and heteromodal association areas (Thompson et al., 2001). Studies of the heritability of brain structures in subjects with schizophrenia and their unaffected siblings confirm that the overall brain volume and hippocampal measures are significantly heritable (Goldman et al., 2008; Honea et al., 2008), and that the hippocampal measures have possibly the largest effect in meta-analyses (Boos et al., 2007).
Voxel-based morphometry (VBM) as a regression analysis on gray matter concentration does not take covariation among brain regions into account. Multivariate approaches to structural analyses, in contrast, allow patterns of common differences among regions to be revealed, or relationships between the structural patterns and other measures to be explored. The application of independent component analysis (ICA) to structural images, called source-based morphometry (SBM) (Xu et al., 2009) identifies patterns of covariation in gray matter measures across subjects, which can then be assessed for the effects of diagnosis, age, or other variables. Xu et al. (2009) applied both SBM and VBM analyses to gray matter concentration (GMC) images of subjects with schizophrenia and matched control subjects; while the VBM analysis identified the usual loss of GMC in the thalamus and the temporal, inferior and medial frontal, insular, and parahippocampal areas, the SBM analyses identified these regions and others that VBM did not identify, with a stronger effect of diagnosis. The SBM analysis, in addition to capitalizing on the effect of covariation among voxels as a multivariate approach, allows noise to be parceled out in separate components. This parceling can make it more sensitive to signal in the presence of noise, as Xu et al. demonstrated through simulations.
In this paper we combine multiple, multisite structural imaging datasets from subjects with schizophrenia, control subjects, and siblings of both probands and controls to determine the heritability of the SBM measures of gray matter. To fully separate genetic from shared environmental factors, more than one level of shared genetic load is needed. With sibling pairs, we can assess ‘familiality’, or shared genetic and environmental effects (Rice, 2008). Thus, heritability estimates on sibling pairs provide an upper bound on the true heritability of a phenotype. We perform VBM analyses separately first to confirm the comparability of the datasets, and then perform the SBM analyses on the combined dataset. The familiality of the spatial patterns that show diagnosis effects in both datasets is tested in a set of sibling pairs, both probands and controls.
We chose to work with unmodulated, segmented gray matter images, using gray matter concentration (GMC) rather than modulated images to reconstruct gray matter volume (GMV). The comparison of these two approaches has shown that gray matter concentration is a more sensitive measure to the differences in schizophrenia (Fornito et al., 2009; Meda, et al., 2008; Xu, et al., 2009). Fornito et al. suggest that GMC and GMV may actually track different pathological processes, and that GMC may lead to more robust and spatially consistent findings, though other imaging measures may be relevant as markers for other measures such as IQ (Hartberg et al., 2010; Hartberg et al., 2011; Rimol et al., 2010). In this study we have used GMC measures, in keeping with the other SBM analyses noted below.
Materials and Methods
Subjects
The collection of each dataset was approved by the local review board at that institution. All subjects gave written informed consent for participation.
FBIRN+MCIC Dataset
The data used here were a subset of the combined Functional Imaging Biomedical Informatics Research Network (FBIRN) and Multisite Clinical Imaging Consortium (MCIC) dataset from Segall et al. (2009), including patient and control samples from the University of Minnesota (MINN), the Mind Research Network (MRN), Harvard’s Massachusetts General (MGH) and Brigham and Women’s Hospitals (BWH), the University of California-Irvine (UCI), the University of California-Los Angeles (UCLA), the University of Iowa (IOWA), and Yale University. Four of the sites (MRN, MGH, MINN, and IOWA) participated in both studies, and 53 of the participants were enrolled in both the MCIC and FBIRN studies; for these participants only the FBIRN data were included in the final FBIRN+MCIC data set. The combined FBIRN and MCIC dataset used in this analysis consists of 209 patients with schizophrenia (Affected, or Aff) and 228 healthy volunteers (Unaffected, Unaff), as outlined in Table 1.
TABLE 1.
Clinical and Demographic Summary for the Datasets
| Dataset | Male/Female | Age in years (SD) | Education (years) | Handedness (Right, Left + Mixed) | IQ |
|---|---|---|---|---|---|
| FBIRN+MCIC | |||||
| HS (N = 228) | 141/87 | 33.5 (11.4) | 15.5 (2.1) [96%] | 208/20 | 113 (12) [98%] |
| SZ (N = 209) | 152/57 | 35.5 (11.4) | 13.2 (2.3) [90%] | 185/24 | 102 (16) [97%] |
| WashU-CCNM | |||||
| HS (N = 96) | 55/41 | 31.9 (14.3) | 84/12 | ||
| SZ (N = 102) | 74/28 | 34.1(12.8) | 91/11 | ||
| SZ-Sib (N = 31) | 15/16 | 21.8 (3.5) | 27/4 | ||
| HS-Sib (N = 49) | 14/36 | 20.4 (3.5) | 46/4 | ||
|
| |||||
| Clinical | POS | NEG | Disorg | mean CPZ (SD) | mean DOI in years (SD) |
|
| |||||
| FBIRN+MCIC | 4.7 (2.7) [99%] | 7.6 (3.9) | 1.9 (1.9) | 40.5 (107); 12 neuroleptic naïve; 7 not currently medicated; [52%] | 12 (11) Range 0.25–49 [82%] |
| WashU-CCNM | 16 (14) Range 0.12–45 [44%] | ||||
Note: SD = standard deviation, POS, NEG, Disorg = Positive, Negative, and Disorganized scores (see text for detail), DOI = duration of illness, CPZ = chlorpromazine equivalents for current medication, HS = healthy subjects, SZ = subjects with schizophrenia, SZ-Sib = siblings of SZ, HS-Sib = siblings of HS; percentage reporting is included wherever data were missing for some subjects.
WashU-CCNM Dataset
The subjects in this dataset were recruited through the Conte Center for the Neuroscience of Mental Disorders (CCNMD) at Washington University School of Medicine in St. Louis, and included: (1) probands with DSM-IV schizophrenia (Aff, n = 102); (2) their full siblings with no psychosis (Aff-Sib, n = 31); (3) healthy participants as controls (Unaff, n = 96); and (4) their siblings (Unaff-Sib, n = 49). Siblings were full siblings, based on self-report. This sample overlaps with previous studies that focused on between-group differences (Calabrese et al., 2008; Harms et al., 2010; Mamah et al., 2008). Sibling sets were younger on average and more likely to be female than their counterparts, as shown in Table 1. Not all pairs were available for use in the heritability analysis; there were 66 complete pairs for that analysis, of which 25 were Aff/Aff-Sib pairs.
Clinical Descriptions
All datasets used the Structured Clinical Interview for Diagnosis (SCID) for DSM-IV or DSM-IV-TR to confirm a diagnosis of schizophrenia or schizoaffective disorder; the MCIC dataset also allowed for schizophreniform. In the FBIRN+MCIC dataset, unaffected subjects were free of any Axis-1 disorder, had no history of drug dependence, no major untreated illness, no head injuries, no first-degree relative with history of psychotic illness, and an IQ no less than 75 as measured by the North American Adult Reading Test (Blair & Spreen, 1989) or no less than 70 for the MCIC dataset as measured by Wide Range Achievement Test-3 (WRAT-3). Affected subjects were excluded similarly, and if they had alcohol or substance dependence 2 months prior. In the WashU-CCNM dataset, participants were excluded if they: (a) met DSM-IV criteria for substance dependence or severe/moderate abuse during the 6 months preceding assessment; (b) had a clinically unstable or severe medical disorder, or a medical disorder that confounded the assessment of psychiatric diagnosis or rendered research participation dangerous; (c) had a history of head injury with documented neurological sequels or loss of consciousness; or (d) met DSM-IV criteria for mental retardation (mild or greater in severity). Siblings without psychosis had similar criteria, with the caveat that they could not have an Axis-1 psychotic disorder but could have other disorders. All affected subjects were outpatients, stable on antipsychotic medication (for a minimum of 2 weeks for the CCNM dataset, for 2 months for the FBIRN+MCIC dataset). The clinical measures as available for the different datasets are included in Table 1. Symptom severity (Positive, Negative, and Disorganized) was calculated as the sum of specific questions from the Scales for the Assessment of Negative and Positive Symptoms (SANS and SAPS) where available (i.e., the sum of the values from the Global Rating of Severity of Delusions and the Global Rating of Severity of Hallucinations, for the Positive score; the Global Rating of Affective Flattening, the Global Rating of Alogia, the Global Rating of Avolition–Apathy, and the Global Rating of Anhedonia–Asociality, for the Negative score; and the sum of the Global Rating of Severity of Bizarre Behavior and the Global Rating of Positive Formal Thought Disorder, for the Disorganized score) (Andreasen, 1984a, 1984b).
Medication information was available for 115 of the MCIC affected datasets; antipsychotic history for those subjects was collected as part of the psychiatric assessment using the PSYCH instrument (Andreasen, 1989). Both cumulative and current typical and atypical antipsychotic exposures were calculated using the chlorpromazine (CPZ) conversion factors of Andreasen et al. (2010).
Imaging Methods
All imaging data were collected using scanners with field strengths of 1.5T or 3.0T, as noted in Table 2 below. Each site used its own head restraints system.
TABLE 2.
Scanning Details Across the Datasets and the Number of Subjects from Each Dataset
| Dataset | Scanner | Sequence | Orientation | Voxel dimension (mm) | N (Aff/Unaff) |
|---|---|---|---|---|---|
| FBIRN | Siemens 1.5T | MP-RAGE | Sagittal | 1.25 × 1.25 × 2 | 15/14 |
| Picker Eclipse 1.5T | 3D-FAST | Sagittal | 0.94 × 0.94 × 1.5 | 21/20 | |
| GE Signa 3T | SPGR | Sagittal | 0.94 × 0.94 × 1.5 | 7/2 | |
| Siemens Trio 3T | MP-RAGE | Sagittal | 1 × 1 × 1.2 | 6/4 | |
| Siemens Trio 3T (3 sites) | MP-RAGE | Sagittal | 0.94 × 0.94 × 1.2 | 45/47 | |
| MCIC | Siemens 1.5T (2 sites) | GRE | Coronal | 0.6 × 0.6 × 1.5 | 58/51 |
| GE Signa 1.5T | GRE | Coronal | 0.6 × 0.6 × 1.6 | 32/65 | |
| Siemens Trio 3T | MP-RAGE | Coronal | 0.6 × 0.6 × 1.5 | 25/25 | |
| WashU-CCNM | Siemens Vision 1.5T | MP-RAGE | Sagittal | 1 × 1 × 1.25 | 102/176 |
Note: Aff = affected, Unaff = unaffected; the WashU-CCNM Unaffected number includes siblings, as detailed in text.
Image Preprocessing Methods
All datasets were collated at MRN and analyzed using the same preprocessing pipeline. We followed the methods of Segall et al. (2009) as used on the FBIRN+MCIC data. The original images were visually checked for graininess, nose-wrap, and artifact, and only those that passed these criteria were included in the analysis (all subjects from the available WashU-CCNM dataset passed). Using the unified segmentation methods of SPM5, the images were normalized to MNI space, resliced to 2 × 2 × 2 mm, and segmented into gray, white, and CSF images (Ashburner & Friston, 2000). Data quality was checked by correlations against the segmented templates; if the subject’s segmented gray matter data did not correlate at .9 or higher with the template across all voxels, it was removed from consideration. Data were finally smoothed by a Gaussian filter of 10 mm Full Width Half Maximum (FWHM). Estimated total intracranial volume (eTIV) was the sum of the unsmoothed normalized segmented images. The sample sizes provided above are those that passed these quality assurance methods.
Analyses
VBM Analyses on SZ vs HS
Univariate VBM analyses were conducted as in Segall et al. (2009) for replication, using SPM5 on the FBIRN+MCIC dataset in one analysis separately from a second analysis on the unrelated affected and unaffected subjects from the CCNM datasets. The smoothed, unmodulated gray matter images from the subjects with schizophrenia and the unrelated control subjects were regressed in a General Linear Model (GLM) against disease status, using age, gender, scanning site, and estimated intracranial volume as covariates, in keeping with recommendations from Pell et al. (2008). All sites contributed both Affected and Unaffected data, and site was included as a regressor in keeping with the recommendations of Fennema-Notestine et al. (2007), Pardoe et al. (2008), and Stonnington et al. (2008). The CCNM data had only one scanning site, so that covariate was dropped. The statistical t-maps for the contrast of Unaffected > Affected were correlated between the FBIRN+MCIC and CCNM results to assess reliability of the diagnosis effect. A secondary analysis for the effect of site and possible interactions with disease state is included in the Supplemental Material.
SBM Analyses
Source-based morphometry is ICA applied to structural images (for a more complete explanation, see Xu et al., 2009). The same segmented, unmodulated, smoothed gray matter images are used as input for both VBM and SBM. The images are arrayed into a subjects x voxels array, with each subject comprising a row. ICA is used to decompose this array into a subjects x components mixing matrix, and a components x voxels source matrix. ICA was performed using the GIFT Toolbox (http://mialab.mrn.org/software/gift/index.html) on all datasets together, using the Infomax algorithm to decompose the data matrix of gray matter images into a mixing matrix (subject weights) and source matrix (the gray matter components). The decomposition is done blind to subject diagnosis or family relationships. Following the decomposition, each subject has a loading coefficient on each component, and each component is a spatial map. We used 30 components for comparison with Xu et al. (2009), and ICASSO to determine the stability of the components. Twenty-four of the components, accounting for 82.5% of the variance in the data, were stable (stability index > .95). Thus, each subject has 24 loading coefficients, one for each stable component.
Diagnosis Effects on the SBM Analyses
The loading coefficients on each of the 24 stable components for the subjects with schizophrenia and the unrelated control subjects from both datasets were analyzed in a combined MANCOVA, then separately for comparison. The full model for the full and FBIRN+MCIC analyses included diagnosis, age, age × diagnosis, scanner field strength and model, field strength × model, and diagnosis × field strength × model. In the CCNM data, the analysis included diagnosis, age, and age × diagnosis. Those components that showed a significant diagnosis effect (p < .05) in all three analyses were also analyzed for clinical correlates, and used in the heritability analyses.
Clinical Correlates With ICA Analyses
The loading coefficients for the disease-related components were analyzed using SPSS v. 19 within the SZ data alone for the effects of global Positive and Negative scores while covarying for age and gender, and scanner site. The effects of duration of illness and medication exposure (cumulative typical, atypical, combined, and current typical, atypical, and combined) were analyzed similarly for the subjects for whom that data were available.
Heritability Analyses
The primary analyses were to determine the heritability estimates of those multivariate measures that showed an effect of the disease. These analyses were restricted to the 66 sibling pairs from the CCNM dataset for which imaging data were available in both members of the pair. The loading coefficients on the four disease-related components for each subject and the subject’s sibling were analyzed in a variance components approach using a maximum likelihood approach in Sequential Oligogenic Linkage Analysis Routines (SOLAR) (Almasy & Blangero, 1998) and covarying for differences in age, sex, and sibship (discordant for schizophrenia, healthy). This approach measures heritability as h2, which, in this case, is the portion of the phenotypic variance explained by total additive genetic + total shared environmental variance. Phenotypes that covary more strongly between related than unrelated individuals have higher h2, or familiality.
Results
VBM Results
The univariate VBM results on the nonrelated Affected and Unaffected data (thresholded at p < .05 FDR corrected) for the FBIRN+MCIC and CCNM data are shown in Figure 1. Both analyses show large areas in which the Unaffected data have greater gray matter concentrations than the Affected data. Using the same threshold for the Affected > Unaffected contrast (not shown), the FBIRN+MCIC data showed three clusters of 80 voxels each in the brain stem and cerebellum, but the CCNM data showed no significant effects in these regions.
FIGURE 1.
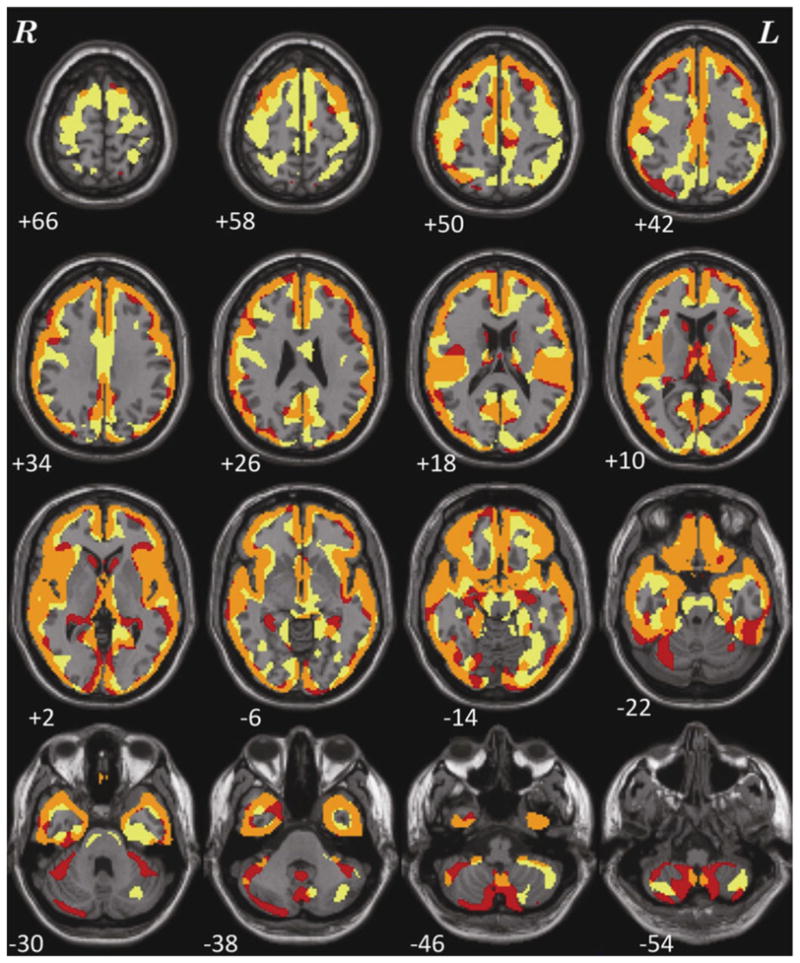
Voxel-based morphometry results showing areas where Unaffected subjects have greater gray matter measures than Affected subjects, when age, gender, and eTIV are included as covariates (p < .05 FDR corrected), overlaid on a standard brain. The FBIRN+MCIC dataset results (which included site as a covariate) are in red, the CCNM dataset results in yellow, and the points of overlap in orange.
The analysis of site as a factor and its interactions with diagnosis in the FBIRN + MCIC dataset are reported in the Supplemental Material. As was found in a different analysis by Segall et al. (2009), while there are widespread site differences in GMC, there was no significant interaction between site and diagnosis. The areas that pass significance for the Unaffected > Affected contrast are unchanged. The correlation across the two Unaffected > Affected analyses, over all within-brain voxels using the unthresholded t-map for this contrast for the FBIRN+MCIC data and the same t-map for the CCNM data, was r = .6 (p < .05). While Figure 1 shows much of the cortex was implicated in these multi-hundred subject samples, the largest diagnosis effects consistent across both analyses were: in the right inferior orbital area into the right insula, temporal pole and superior temporal area (t of 6, effect size 0.58 in the FBIRN+MCIC analysis; t of 6.8, effect size 0.98 in the CCNM analysis); medial frontal cortex from the rectus through the medial orbital to the anterior cingulate/BA 32 (t values of 6.8 and 5.7 and effect sizes 0.66 and 0.82, respectively, for the FBIRN +MCIC and CCNM analyses); left insula into the left superior temporal gyrus and pole (t values of 6.5 and 5.7; effect sizes 0.63 and 0.82); and in right and left Heschl’s gyrus (t values of 6.7 and 5 for FBIRN+MCIC and CCNM, on both sides; effect sizes 0.65 and 0.96). The Affected subjects showed loss of gray matter concentration in all these gray matter regions. Given the similar patterns of the diagnosis effects in both datasets, we combined them for the SBM analysis.
SBM Results
The effect of diagnosis was consistently significant (p < .05) in all three analyses on only four components, which we focus on here. The spatial maps for the four components are shown in Figure 2, thresholded at |z| > 2.5; that is, the voxels shown are the ones that contribute strongly to these components. In Table 3, we present the amount of variance accounted for by each component, and the directions of the effects of diagnosis, age, age × diagnosis interaction, field strength, scanner model, and field strength × scanner model interaction on the loading coefficients for these components. All components showed that Affected subjects have significantly smaller coefficients than Unaffected subjects, that is, less GMC in that network of regions. Age was negatively associated with two of the components, more strongly so in the Affected than in the Unaffected subjects, which indicates the effect of age on GMC loss and its acceleration with disease. The third component, which mainly included the occipital lobe, showed an increase with age and no interaction between age and diagnosis, while the fourth (in the temporal and parietal lobes) showed no effect of age and no interaction with diagnosis. Field strength was not a significant effect on these components, nor was the interaction of field strength and model. However, on two of the four components, there was a difference between the Picker scans and the GE and Siemens scans. The three-way interaction of diagnosis, field strength, and scanner model was not significant on any component.
FIGURE 2.

Spatial maps of the four relevant components. Component A is shown in pink, B in green, C in blue, D in red. All are thresholded at |z| > 2.5, with the color scheme in the lower right.
TABLE 3.
Effects on Each Diagnosis-Related Component From the Global Analysis of Versus Healthy Subjects
| Component | % variance | Diagnosis (D) | Age (A) | D x A | Field Strength (F) | Model (M) | F x M |
|---|---|---|---|---|---|---|---|
| A (c23) | 2.5 | Sz < HS | ↓ | ↓> Sz | ns | Picker < GE + Siemens | ns |
| B (c18) | 1.9 | Sz < HS | ↓ | ↓> Sz | ns | ns | ns |
| C (c15) | 2.2 | Sz < HS | ↑ | ns | ns | Picker > GE + Siemens | ns |
| D (c12) | 4.4 | Sz < HS | ns | ns | ns | ns | ns |
Note: ns = nonsignificant, Sz = subjects with schizophrenia, HS = healthy subjects.
Relationship With Clinical Variables
Because the effect of scanner model consisted primarily of the Picker scanner being different from the GE and Siemens (see Table 3), we dropped those subjects (n = 21) from these analyses. Current medication (typical, atypical, or combined typical and atypical) showed no significant effects on any of the components, though SBM component A (see Figure 2) showed a trend toward decreasing with increasing combined dose, t(103) = −2.1, p < .04, ns after multiple correction. Lifetime exposure to typical and combined antipsychotic medication showed the same effect on component A, t(104) = −3.76, p < .0001, on the cumulative combined measure, t(104) = −2.9, p < .003, on the cumulative typical antipsychotics only. No other significant associations between SBM components and clinical variables were observed.
Heritability
The loading coefficients for the 66 sibling pairs (including 25 Affected) from components A, B, C, and D in Figure 2 were used in the heritability analyses, including age and proband status as covariates. The estimated heritability for components B (h2r = .43) and C (h2r = .49) were both significant (p < .005 and .05, respectively).
The regions comprising the heritable components are listed in Table 4. In each case, because Unaffected subjects are more positively weighted than Affected subjects on these components (see Table 3), areas of the spatial maps with positive weights are areas in which Unaffected subjects generally have greater gray matter concentrations than Affected subjects. In component B, the large positive clusters in the temporal gyri, temporal poles, insular gyri, and medial frontal gyri all reflect the univariate differences found previously. In Component C, the large positive clusters are in the occipital lobe, from the cuneus into the fusiform gyrus, with some parts of the temporal lobe also included. However, the negative weightings in both these components in other regions indicate that it is not only the greater gray matter concentrations in the Unaffected subjects that primarily distinguish these regions, but that there is also some contribution from the negative correlations with gray matter concentration in smaller areas of the frontal and parietal lobes.
TABLE 4.
Areas Comprising the Heritable Components, Both Positively and Negatively Weighted, Thresholded at |z| > 2.5
| B Component
| ||||||
|---|---|---|---|---|---|---|
| Area | Weighting | Brodmann area | L volume (cc) | L Max z (x,y,z) | R volume (cc) | R Max z (x,y,z) |
| Inferior frontal gyrus | Positive | 9, 13, 47 | 4.1 | 6.2 (−44, 15, −7) | 3.3 | 6.1 (40, 15, −14) |
| Anterior cingulate | Positive | 10, 32 | 0.9 | 3.7 (0, 36, 20) | 1.2 | 3.4 (4, 47, 3) |
| Medial frontal gyrus | Positive | 9, 10 | 0.9 | 3.9 (0, 44, 18) | 1 | 3.2 (4, 51, 3) |
| Insula | Positive | 13, 22, 40, 47 | 4.1 | 5.5 (−42, 7, −5) | 3.9 | 5.4 (46, 0, −2) |
| Sub-gyral | Positive | 13, 21 | 0.6 | 4.0 (−44, −4, −7) | 0.3 | 5.0 (44, 5, −10) |
| Extra-nuclear | Positive | 13 | 0.4 | 5.3 (−40, 11, −7) | 0.4 | 5.1 (42, 11, −7) |
| Precentral gyrus | Positive | 6, 13, 43, 44 | 0.4 | 3.6 (−48, −15, 10) | 0.8 | 3.9 (50, −9, 6) |
| Postcentral gyrus | Positive | 40 | 0.3 | 2.9 (−55, −23, 14) | 0.4 | 2.9 (59, −19, 14) |
| Cingulate gyrus | Positive | 32 | 0.2 | 3.2 (0, 23, 30) | 0.1 | 2.6 (4, 29, 26) |
| Superior temporal gyrus | Positive | 13, 22, 38, 41 | 6.1 | 6.7 (−44, 11, −7) | 5.4 | 6.3 (44, 13, −11) |
| Transverse temporal gyrus | Positive | 41, 42 | 0.7 | 3.4 (−44, −21, 12) | 0.4 | 3.5 (51, −15, 10) |
| Parahippocampal gyrus | Positive | 27, 30, 34 | 0.6 | 3.5 (−12, −5, −17) | 0.3 | 3.1 (12, −3, −17) |
| Uncus | Positive | 34 | 0.2 | 2.8 (−14, −1, −20) | 0.1 | 2.7 (28, 9, −22) |
| Culmen | Positive | * | 0.3 | 2.9 (−10, −39, −5) | 0.1 | 3.0 (10, −37, −5) |
|
| ||||||
| C Component
| ||||||
| Area | Weighting | Brodmann Area | L volume (cc) | L Max Z (x, y, z) | R volume (cc) | R Max Z (x, y, z) |
|
| ||||||
| Cuneus | Positive | 7, 17, 18, 19 | 10 | 7.0 (−10, −99, 3) | 10.6 | 6.2 (14, −97, 7) |
| Middle occipital gyrus | Positive | 18, 19 | 6 | 5.8 (−6, −96, 16) | 4.8 | 5.6 (14, −96, 14) |
| Lingual gyrus | Positive | 17, 18 | 3.6 | 6.4 (−10, −97, −4) | 4 | 5.3 (20, −91, 0) |
| Inferior occipital gyrus | Positive | 17, 18 | 1.5 | 4.7 (−22, −96, −7) | 1.1 | 4.0 (28, −91, −4) |
| Precuneus | Positive | 7, 19 | 0.7 | 3.1 (−28, −82, 34) | 0.6 | 3.2 (26, −80, 35) |
| Superior occipital gyrus | Positive | 19 | 0.4 | 3.1 (−32, −84, 28) | 0.2 | 2.7 (34, −82, 30) |
| Calcarine | Positive | 17 | 0.1 | 3.6 (−18, −100, 14) | 0.2 | 4.1 (2, −89, 8) |
| Middle frontal gyrus | Negative | 6, 8, 9 | 2 | 4.0 (−24, 27, 32) | 0.9 | 3.7 (28, 16, 40) |
| Middle frontal gyrus | Negative | 10 | 0.3 | 3.5 (−26, 45, 7) | ||
| Inferior frontal gyrus | Negative | 13, 45 | 0.3 | 3.1 (42, 20, 8) | ||
| Putamen | Negative | 0.8 | 3.0 (24, 15, 38) | |||
Discussion
To our knowledge, this is the first study to determine the familiality of multivariate source-based morphometry components. We interpret the familiality reported in this study to reflect the upper bounds of heritability, as most studies have shown additive genetic and unique environmental contributions to brain morphological measures rather than shared environmental contributions. We have shown that gray matter concentration is lower in subjects with schizophrenia, and that the differences as revealed in univariate analyses are both robust and replicable across several datasets. These findings are consistent with those found in the literature on VBM analyses previously (Honea et al., 2005; Meda et al., 2008): the affected subjects show loss in the temporal lobes and poles, inferior frontal lobes, in-sula, and medial frontal regions, as well as the more lateral frontal regions and, to a lesser extent, most of the cortical gray matter. While this is an extensive effect, it is not surprising given the sample size and choice of FDR correction. Related results presented in Segall et al. (2009) used the more conservative family-wise error correction and thus did not show the extensive GMC loss in other areas.
The multivariate SBM analyses identify a subset of the same regions that were identified in the univariate VBM analyses, as well as novel areas of gray matter loss. Of the four components we identified as repeatedly showing loss of GMC in the subjects with schizophrenia, two were significantly heritable. The individual subject’s weighting on the network of insular/temporal pole/medial and inferior frontal areas was heritable, while a network of posterior occipital and cuneus regions was also heritable in these data. According to the Gottesman and Gould (2003) checklist, gray matter loss in these networks would be an endophenotype if it is associated with the illness in the general population; if it is heritable; if it manifests in the individual whether or not the illness is active; and if, within families, the measure and the illness co-segregate. The multivariate measures identified here are associated with the illness in the general population, and are heritable. Future studies of structural imaging within larger pedigrees and early phases of the disorder are needed to determine the other characteristics.
Given the high heritability of almost all structural brain measures, it is quite likely that other non-disease-related components are also heritable. We did not examine such components, as the sample size limited our ability to correct for multiple tests, and our primary interest was in the heritability of the components that were affected in schizophrenia. The cluster of inferior frontal/insular/temporal pole and temporal lobe loss, however, which is so commonly seen in VBM analyses in schizophrenia, is heritable, in keeping with the findings of Honea et al. (2007) that indicated unaffected siblings also lose gray matter in those regions —although, given their univariate analyses, this effect did not survive correction for multiple testing.
In two of the disease-related components, including medial frontal, temporal, insular, and parahippocampal regions, the effect of age was to decrease the GMC, with a greater effect of age in the Affected group. This is in keeping with the literature showing increased loss of gray matter in the frontal and temporal lobes as schizophrenia progresses (Hulshoff Pol & Kahn, 2008); taking age into account, the similarity in this network across sibling pairs was still greater than across unrelated individuals. Component D, including other areas of the temporal, frontal, and parietal regions, identified a network of regions which, while reduced in the Affected subjects, did not show an effect of age across these groups. This component, however, was not significantly heritable, opening the possibility that it is affected by individual exposure to environmental factors such as exercise, which could counteract age-related declines (Colcombe et al., 2006; Pagnoni & Cekic, 2007). The component primarily in the occipital areas showed an unexpected increase with age, though no interaction between diagnosis and age.
Xu et al. (2009), in their SBM analyses of another large dataset of affected and unaffected subjects, identified five components that showed gray matter loss in patients. Their ‘bilateral temporal source’ is very similar to Component B, including the temporal, frontal, anterior cingulate regions, as well as areas in the pre and post central gyrus. Their ‘frontal source’, which includes both frontal areas away from the midline, and posterior areas, is more similar to our component D. Several of the sources from Xu et al. also included the thalamus and basal ganglia, which ours do not. None of the components identified in this analysis that showed a disease effect showed a strong thalamic or basal ganglia source; component A showed a small effect that included only a part of the thalamus and lentiform nucleus. The lack of component findings in our current study is reflective of lack of volume or gray matter concentration differences, as seen in Figure 1. In fact, in the WU-CCNM sample, parts of which were used in previous analysis of the thalamus, we either saw a weak group difference (Csernansky et al., 2004) or no group difference (Harms et al., 2007) in volume, though there were differences in shape in the thalamus. Component A did, however, also include the cuneus, precuneus, lingual gyrus, posterior cingulate, parahippocampal gyrus, and the inferior parietal lobule, as did the ‘thalamus source’ of Xu et al., but it extends down to the brain stem area, which the thalamus source did not. It is not entirely clear why the components identified in these two studies are not more similar, though we had additional stability criteria for our components, which may have played a role. The Xu et al. study also used a single 1.5T scanner rather than a combination of scanners, and they did not report their subjects’ duration of illness or their antipsychotic exposures. Of the subjects in the current samples, many had long histories of treatment with typical antipsychotics, while others were on atypical antipsychotics or combinations. It is possible that the Xu et al. subjects were on a more consistent regimen of the newer antipsychotics, allowing that component of gray matter loss in the basal ganglia to be identified.
The effect of antipsychotic exposure in a study of chronic schizophrenia must always be considered. We assessed the components for the effects of cumulative medication effects, insofar as that data were available, and did not see any effects in these data. However, Ho et al. (2011) found in a large-scale longitudinal study that duration of illness and antipsychotic medication both have effects on gray matter loss in lobar volumes, with no interaction between them. The fact that the heritability of these components was still significant in the face of these potentially confounding effects is very promising; in a more complete sample where the information regarding antipsychotic medication levels was thorough, we might be able to account for those effects to determine a cleaner measure of the heritability of these spatial patterns.
The parallel ICA analysis of Jagannathan et al. (2010) used a priori candidate genes and gray matter images from affected and unaffected subjects to identify gray matter components that strongly correlated with genetic patterns in the same subjects. They identified two spatial components related to the same genetic component, of which one spatial component showed loss of gray matter in the affected subjects. That component did not include the medial frontal regions seen in Component B here or in the Xu et al. (2009) component, but it did include the thalamic region, which was a separate component in the Xu et al. study. However, it did include parts of the recognizable in-sula/inferior frontal/temporal cluster similar to Component B. It was related to a genetic profile that included single nucleotide polymorphism (SNP) genotypes from AKT, PI3k, SLC6A4, DRD2, CHRM2, and ADORA2A (Jagannathan et al., 2010). Those genes were identified out of a preselected pool of candidate risk genes and brain-related genes for neurotransmitters and related functions, and brain and metabolic processes. It is promising that the component that showed both an effect of diagnosis and a genetic relationship overlaps with the heritable components identified in our study. While the genetic results must be considered preliminary, it does support the idea that multivariate structural measures may reflect genetic influences.
We did not have the power in this dataset to determine whether the heritability is different in the affected sibling pairs and the unaffected sibling pairs. The Chen et al. study (2009) used cognitive data from these subjects and from others, and explored the heritability of various neurocognitive measures in sibling pairs with and without a proband, as well as all pairs together. They found that the heritability of working memory performance was decreased in the presence of schizophrenia; however, their sample was large enough to allow a direct comparison between the proband and non-proband sibling pairs. Yang et al. (2010), in a family study of cortical thinning, examined the similarities between affected subjects and their siblings and parents, and between unaffected subjects, their siblings and parents. They found only the thinning of the parahippocampal gyrus and the inferior occipital gyrus passed the corrected significance threshold in the comparison between proband siblings and healthy control siblings. A multivariate analysis would have increased the study’s power, by identifying regions that show similar loss across the cortex and by reducing the number of independent test corrections. Using our methods, we would expect in a larger family sample to be able to distinguish which structural components were heritable overall and which were more weakly heritable in proband sibling pairs.
Previous voxel-wise studies of family members and structural imaging in schizophrenia to identify anatomical endophenotypes have focused on local, regional analyses, and a common complaint is the need to correct for multiple testing over the entire brain. By using source-based morphometry, we have reduced the need for multiple testing and can identify that certain structural patterns are affected by the disease and are heritable.
Acknowledgments
This work was supported by: the Biomedical Informatics Research Network (NIH 1 U24 RR025736-01), MCIC, Dept of Energy DE-FG02-99ER62764, 1R01 MH084803, P50 MH071616, R01 MH056584.
References
- Almasy L, Blangero J. Multipoint quantitative-trait linkage analysis in general pedigrees. American Journal of Human Genetics. 1998;62:1198–1211. doi: 10.1086/301844. [DOI] [PMC free article] [PubMed] [Google Scholar]
- Andreasen NC. Modified scale for the assessment of negative symptoms (SANS) Iowa City: University of Iowa; 1984a. [Google Scholar]
- Andreasen NC. Scale for the assessment of positive symptoms (SAPS) Iowa City: University of Iowa; 1984b. [Google Scholar]
- Andreasen NC. Psych-base. Iowa City: University of Iowa; 1989. [Google Scholar]
- Andreasen NC, Pressler M, Nopoulos P, Miller D, Ho BC. Antipsychotic dose equivalents and dose-years: A standardized method for comparing exposure to different drugs. Biological Psychiatry. 2010;67:255–262. doi: 10.1016/j.biopsych.2009.08.040. [DOI] [PMC free article] [PubMed] [Google Scholar]
- Antonova E, Sharma T, Morris R, Kumari V. The relationship between brain structure and neurocognition in schizophrenia: A selective review. Schizophrenia Research. 2004;70:117–145. doi: 10.1016/j.schres.2003.12.002. [DOI] [PubMed] [Google Scholar]
- Ashburner J, Friston KJ. Voxel-based morphometry—the methods. Neuroimage. 2000;11:805–821. doi: 10.1006/nimg.2000.0582. [DOI] [PubMed] [Google Scholar]
- Bartley AJ, Jones DW, Weinberger DR. Genetic variability of human brain size and cortical gyral patterns. Brain. 1997;120:257–269. doi: 10.1093/brain/120.2.257. [DOI] [PubMed] [Google Scholar]
- Bearden CE, van Erp TG, Thompson PM, Toga AW, Cannon TD. Cortical mapping of genotype-phenotype relationships in schizophrenia. Human Brain Mapping. 2007;28:519–532. doi: 10.1002/hbm.20404. [DOI] [PMC free article] [PubMed] [Google Scholar]
- Blair JR, Spreen O. Predicting premorbid IQ: A revision of the national adult reading test. Clinical Neuropsychologist. 1989;3:129–136. [Google Scholar]
- Boonstra G, van Haren NE, Schnack HG, Cahn W, Burger H, Boersma M, de Kroon B, Grobbee DE, Hulshoff Pol HE, Kahn RS. Brain volume changes after withdrawal of atypical antipsychotics in patients with first-episode schizophrenia. Journal of Clinical Psychopharmacology. 2011;31:146–153. doi: 10.1097/JCP.0b013e31820e3f58. [DOI] [PubMed] [Google Scholar]
- Boos HB, Aleman A, Cahn W, Hulshoff Pol H, Kahn RS. Brain volumes in relatives of patients with schizophrenia: A meta-analysis. Archives of General Psychiatry. 2007;64:297–304. doi: 10.1001/archpsyc.64.3.297. [DOI] [PubMed] [Google Scholar]
- Calabrese DR, Wang L, Harms MP, Ratnanather JT, Barch DM, Cloninger CR, Thompson PA, Miller MI, Csernansky JG. Cingulate gyrus neuroanatomy in schizophrenia subjects and their non-psychotic siblings. Schizophrenia Research. 2008;104:61–70. doi: 10.1016/j.schres.2008.06.014. [DOI] [PMC free article] [PubMed] [Google Scholar]
- Chen LS, Rice TK, Thompson PA, Barch DM, Csernansky JG. Familial aggregation of clinical and neurocognitive features in sibling pairs with and without schizophrenia. Schizophrenia Research. 2009;111:159–166. doi: 10.1016/j.schres.2009.03.030. [DOI] [PMC free article] [PubMed] [Google Scholar]
- Colcombe SJ, Erickson KI, Scalf PE, Kim JS, Prakash R, McAuley E, Elavsky S, Marquez DX, Hu L, Kramer AF. Aerobic exercise training increases brain volume in aging humans. The Journals of Gerontology Series A, Biological Sciences and Medical Sciences. 2006;61:1166–1170. doi: 10.1093/gerona/61.11.1166. [DOI] [PubMed] [Google Scholar]
- Csernansky JG, Schindler MK, Splinter NR, Wang L, Gado M, Selemon LD, Rastogi-Cruz D, Posener JA, Thompson PA, Miller MI. Abnormalities of thalamic volume and shape in schizophrenia. American Journal of Psychiatry. 2004;161:896–902. doi: 10.1176/appi.ajp.161.5.896. [DOI] [PubMed] [Google Scholar]
- Fennema-Notestine C, Gamst AC, Quinn BT, Pacheco J, Jernigan TL, Thal L, Buckner R, Killiany R, Blacker D, Dale AM, Fischl B, Dickerson B, Gollub RL. Feasibility of multi-site clinical structural neuroimaging studies of aging using legacy data. Neuroinformatics. 2007;5:235–245. doi: 10.1007/s12021-007-9003-9. [DOI] [PubMed] [Google Scholar]
- Flashman LA, Green MF. Review of cognition and brain structure in schizophrenia: Profiles, longitudinal course, and effects of treatment. The Psychiatric Clinics of North America. 2004;27:1–18. doi: 10.1016/S0193-953X(03)00105-9. [DOI] [PubMed] [Google Scholar]
- Fornito A, Yucel M, Patti J, Wood SJ, Pantelis C. Mapping grey matter reductions in schizophrenia: An anatomical likelihood estimation analysis of voxel-based morphometry studies. Schizophrenia Research. 2009;108:104–113. doi: 10.1016/j.schres.2008.12.011. [DOI] [PubMed] [Google Scholar]
- Giuliani NR, Calhoun VD, Pearlson GD, Francis A, Buchanan RW. Voxel-based morphometry versus region of interest: A comparison of two methods for analyzing gray matter differences in schizophrenia. Schizophrenia Research. 2005;74:135–147. doi: 10.1016/j.schres.2004.08.019. [DOI] [PubMed] [Google Scholar]
- Glahn DC, Thompson PM, Blangero J. Neuroimaging endophenotypes: Strategies for finding genes influencing brain structure and function. Human Brain Mapping. 2007;28:488–501. doi: 10.1002/hbm.20401. [DOI] [PMC free article] [PubMed] [Google Scholar]
- Goldman AL, Pezawas L, Mattay VS, Fischl B, Verchinski BA, Zoltick B, Weinberger DR, Meyer-Lindenberg A. Heritability of brain morphology related to schizophrenia: A large-scale automated magnetic resonance imaging segmentation study. Biological Psychiatry. 2008;63:475–483. doi: 10.1016/j.biopsych.2007.06.006. [DOI] [PubMed] [Google Scholar]
- Gottesman II, Gould TD. The endophenotype concept in psychiatry: Etymology and strategic intentions. American Journal of Psychiatry. 2003;160:636–645. doi: 10.1176/appi.ajp.160.4.636. [DOI] [PubMed] [Google Scholar]
- Harms MP, Wang L, Campanella C, Aldridge K, Moffitt AJ, Kuelper J, Ratnanather JT, Miller MI, Barch DM, Csernansky JG. Structural abnormalities in gyri of the prefrontal cortex in individuals with schizophrenia and their unaffected siblings. British Journal of Psychiatry. 2010;196:150–157. doi: 10.1192/bjp.bp.109.067314. [DOI] [PMC free article] [PubMed] [Google Scholar]
- Harms MP, Wang L, Mamah D, Barch DM, Thompson PA, Csernansky JG. Thalamic shape abnormalities in individuals with schizophrenia and their nonpsychotic siblings. Journal of Neuroscience. 2007;27:13835–13842. doi: 10.1523/JNEUROSCI.2571-07.2007. [DOI] [PMC free article] [PubMed] [Google Scholar]
- Hartberg CB, Lawyer G, Nyman H, Jonsson EG, Haukvik UK, Saetre P, Bjerkan PS, Andreassen OA, Hall H, Agartz I. Investigating relationships between cortical thickness and cognitive performance in patients with schizophrenia and healthy adults. Psychiatry Research. 2010;182:123–133. doi: 10.1016/j.pscychresns.2010.01.001. [DOI] [PubMed] [Google Scholar]
- Hartberg CB, Sundet K, Rimol LM, Haukvik UK, Lange EH, Nesvag R, Dale AM, Melle I, Andreassen OA, Agartz I. Brain cortical thickness and surface area correlates of neurocognitive performance in patients with schizophrenia, bipolar disorder, and healthy adults. Journal of the International Neuropsychological Society. 2011;17:1080–1093. doi: 10.1017/S1355617711001081. [DOI] [PubMed] [Google Scholar]
- Ho BC, Andreasen NC, Ziebell S, Pierson R, Magnotta V. Long-term antipsychotic treatment and brain volumes: A longitudinal study of first-episode schizophrenia. Archives of General Psychiatry. 2011;68:128–137. doi: 10.1001/archgenpsychiatry.2010.199. [DOI] [PMC free article] [PubMed] [Google Scholar]
- Honea RA, Crow TJ, Passingham D, Mackay CE. Regional deficits in brain volume in schizophrenia: A meta-analysis of voxel-based morphometry studies. American Journal of Psychiatry. 2005;162:2233–2245. doi: 10.1176/appi.ajp.162.12.2233. [DOI] [PubMed] [Google Scholar]
- Honea RA, Meyer-Lindenberg A, Hobbs KB, Pezawas L, Mattay VS, Egan MF, Verchinski B, Passingham RE, Weinberger DR, Callicott JH. Is gray matter volume an intermediate phenotype for schizophrenia? A voxel-based morphometry study of patients with schizophrenia and their healthy siblings. Biological Psychiatry. 2008;63:465–474. doi: 10.1016/j.biopsych.2007.05.027. [DOI] [PMC free article] [PubMed] [Google Scholar]
- Hulshoff Pol HE, Kahn RS. What happens after the first episode? A review of progressive brain changes in chronically ill patients with schizophrenia. Schizophrenia Bulletin. 2008;34:354–366. doi: 10.1093/schbul/sbm168. [DOI] [PMC free article] [PubMed] [Google Scholar]
- Jagannathan K, Calhoun VD, Gelernter J, Stevens MC, Liu J, Bolognani F, Windemuth A, Ruano G, Assaf M, Pearlson GD. Genetic associations of brain structural networks in schizophrenia: A preliminary study. Biological Psychiatry. 2010;68:657–666. doi: 10.1016/j.biopsych.2010.06.002. [DOI] [PMC free article] [PubMed] [Google Scholar]
- Koutsouleris N, Gaser C, Jager M, Bottlender R, Frodl T, Holzinger S, Schmitt GJ, Zetzsche T, Burgermeister B, Scheuerecker J, Born C, Reiser M, Moller HJ, Meisenzahl EM. Structural correlates of psychopathological symptom dimensions in schizophrenia: A voxel-based morphometric study. Neuroimage. 2008;39:1600–6012. doi: 10.1016/j.neuroimage.2007.10.029. [DOI] [PubMed] [Google Scholar]
- Mamah D, Harms MP, Wang L, Barch D, Thompson P, Kim J, Miller MI, Csernansky JG. Basal ganglia shape abnormalities in the unaffected siblings of schizophrenia patients. Biological Psychiatry. 2008;64:111–120. doi: 10.1016/j.biopsych.2008.01.004. [DOI] [PMC free article] [PubMed] [Google Scholar]
- Marsh L, Sullivan EV, Morrell M, Lim KO, Pfefferbaum A. Structural brain abnormalities in patients with schizophrenia, epilepsy, and epilepsy with chronic interictal psychosis. Psychiatry Research. 2001;108:1–15. doi: 10.1016/s0925-4927(01)00115-9. [DOI] [PubMed] [Google Scholar]
- Meda SA, Giuliani NR, Calhoun VD, Jagannathan K, Schretlen DJ, Pulver A, Cascella N, Keshavan M, Kates W, Buchanan R, Sharma T, Pearlson GD. A large scale (N = 400) investigation of gray matter differences in schizophrenia using optimized voxel-based morphometry. Schizophrenia Research. 2008;101:95–105. doi: 10.1016/j.schres.2008.02.007. [DOI] [PMC free article] [PubMed] [Google Scholar]
- Pagnoni G, Cekic M. Age effects on gray matter volume and attentional performance in zen meditation. Neurobiology and Aging. 2007;28:1623–1627. doi: 10.1016/j.neurobiolaging.2007.06.008. [DOI] [PubMed] [Google Scholar]
- Pardoe H, Pell GS, Abbott DF, Berg AT, Jackson GD. Multi-site voxel-based morphometry: Methods and a feasibility demonstration with childhood absence epilepsy. Neuroimage. 2008;42:611–616. doi: 10.1016/j.neuroimage.2008.05.007. [DOI] [PMC free article] [PubMed] [Google Scholar]
- Pell GS, Briellmann RS, Chan CH, Pardoe H, Abbott DF, Jackson GD. Selection of the control group for vbm analysis: Influence of covariates, matching and sample size. Neuroimage. 2008;41:1324–1335. doi: 10.1016/j.neuroimage.2008.02.050. [DOI] [PubMed] [Google Scholar]
- Puri BK. Brain tissue changes and antipsychotic medication. Expert Review of Neurotherapeutics. 2011;11:943–946. doi: 10.1586/ern.11.87. [DOI] [PubMed] [Google Scholar]
- Rice TK. Familial resemblance and heritability. Advances in Genetics. 2008;60:35–49. doi: 10.1016/S0065-2660(07)00402-6. [DOI] [PubMed] [Google Scholar]
- Rimol LM, Hartberg CB, Nesvag R, Fennema-Notestine C, Hagler DJ, Jr, Pung CJ, Jennings RG, Haukvik UK, Lange E, Nakstad PH, Melle I, Andreassen OA, Dale AM, Agartz I. Cortical thickness and subcortical volumes in schizophrenia and bipolar disorder. Biological Psychiatry. 2010;68:41–50. doi: 10.1016/j.biopsych.2010.03.036. [DOI] [PubMed] [Google Scholar]
- Segall JM, Turner JA, van Erp TG, White T, Bock-holt HJ, Gollub RL, Ho BC, Magnotta V, Jung RE, McCarley RW, Schulz SC, Lauriello J, Clark VP, Voyvodic JT, Diaz MT, Calhoun VD. Voxel-based morphometric multisite collaborative study on schizophrenia. Schizophrenia Bulletin. 2009;35:82–95. doi: 10.1093/schbul/sbn150. [DOI] [PMC free article] [PubMed] [Google Scholar]
- Steen RG, Mull C, McClure R, Hamer RM, Lieberman JA. Brain volume in first-episode schizophrenia: Systematic review and meta-analysis of magnetic resonance imaging studies. British Journal of Psychiatry. 2006;188:510–518. doi: 10.1192/bjp.188.6.510. [DOI] [PubMed] [Google Scholar]
- Stonnington CM, Tan G, Kloppel S, Chu C, Draganski B, Jack CR, Jr, Chen K, Ashburner J, Frackowiak RS. Interpreting scan data acquired from multiple scanners: A study with Alzheimer’s disease. Neuroimage. 2008;39:1180–1185. doi: 10.1016/j.neuroimage.2007.09.066. [DOI] [PMC free article] [PubMed] [Google Scholar]
- Sullivan EV, Pfefferbaum A, Swan GE, Carmelli D. Heritability of hippocampal size in elderly twin men: Equivalent influence from genes and environment. Hippocampus. 2001;11:754–762. doi: 10.1002/hipo.1091. [DOI] [PubMed] [Google Scholar]
- Thompson PM, Cannon TD, Narr KL, van Erp T, Poutanen VP, Huttunen M, Lonnqvist J, Standertskjold-Nordenstam CG, Kaprio J, Khaledy M, Dail R, Zoumalan CI, Toga AW. Genetic influences on brain structure. Nature Neuroscience. 2001;4:1253–1258. doi: 10.1038/nn758. [DOI] [PubMed] [Google Scholar]
- Thompson PM, Cannon TD, Toga AW. Mapping genetic influences on human brain structure. Annals of Medicine. 2002;34:523–536. doi: 10.1080/078538902321117733. [DOI] [PubMed] [Google Scholar]
- van Erp TG, Saleh PA, Huttunen M, Lonnqvist J, Kaprio J, Salonen O, Valanne L, Poutanen VP, Standertskjold-Nordenstam CG, Cannon TD. Hippocampal volumes in schizophrenic twins. Archives of General Psychiatry. 2004;61:346–353. doi: 10.1001/archpsyc.61.4.346. [DOI] [PubMed] [Google Scholar]
- van Haren NE, Bakker SC, Kahn RS. Genes and structural brain imaging in schizophrenia. Current Opinion in Psychiatry. 2008;21:161–167. doi: 10.1097/YCO.0b013e3282f4f25b. [DOI] [PubMed] [Google Scholar]
- Xu L, Groth KM, Pearlson G, Schretlen DJ, Calhoun VD. Source-based morphometry: The use of independent component analysis to identify gray matter differences with application to schizophrenia. Human Brain Mapping. 2009;30:711–724. doi: 10.1002/hbm.20540. [DOI] [PMC free article] [PubMed] [Google Scholar]
- Yang Y, Nuechterlein KH, Phillips O, Hamilton LS, Subotnik KL, Asarnow RF, Toga AW, Narr KL. The contributions of disease and genetic factors towards regional cortical thinning in schizophrenia: The UCLA family study. Schizophrenia Research. 2010;123:116–125. doi: 10.1016/j.schres.2010.08.005. [DOI] [PMC free article] [PubMed] [Google Scholar]