Abstract
Chondroitin sulphate (CS) is a linear sulfated polysaccharide found in cartilage and other tissues in the body. Small angle neutron scattering (SANS) and dynamic light scattering (DLS) measurements are made on semi-dilute CS solutions to determine ion induced changes in the local order of the CS chains and in their dynamic properties. In salt-free CS solutions SANS detects the correlation peak due to local ordering between adjacent chains in which the characteristic interchain distance is d ≈ 57 Å. In both monovalent and divalent salts (NaCl and CaCl2) aligned linear regions are distinguishable corresponding to distance scales ranging from the length of the monomer unit (8 Å) to about 1000 Å. With increasing calcium ion concentration, the scattering intensity increases. Even in the presence of 200 mM CaCl2, however, neither phase separation nor cross-linking occurs.
DLS in the CS solutions reveals two characteristic relaxation modes, the fast mode corresponding to the thermal concentration fluctuations. The collective diffusion coefficient D decreases with increasing calcium ion concentration and exhibits a power law function of the single variable c/J, where c is the CS concentration and J is the ionic strength of the salt in the solution. This result implies that the effect of the sodium and calcium ions on the dynamic properties of CS solutions is fully accounted for by the ionic strength.
Keywords: chondroitin sulfate, polyelectrolyte solution, small angle neutron scattering dynamic light scattering, collective diffusion coefficient
INTRODUCTION
Chondroitin sulfate (CS), an important macromolecule prevalent in living organisms, is a sulfated glycosaminoglycan (GAG) composed of alternating sugars (N-acetylgalactosamine and glucuronic acid). A typical chondroitin chain may contain over 100 individual sugar units, each of which can be sulfated in variable positions and quantities. Despite the relative simplicity of its chemical structure, the CS molecule carries biological information and participates in many biological functions. CS interacts with a variety of molecules, such as growth factors, cytokines, chemokines, adhesion molecules and lipoproteins and also plays an important role in cancer biology [1–5]. CS is involved in cell growth, neuronal development and spinal cord injury. It also possesses important biological properties for tissue integration, including anti-inflammatory activity, water and nutrient absorption.
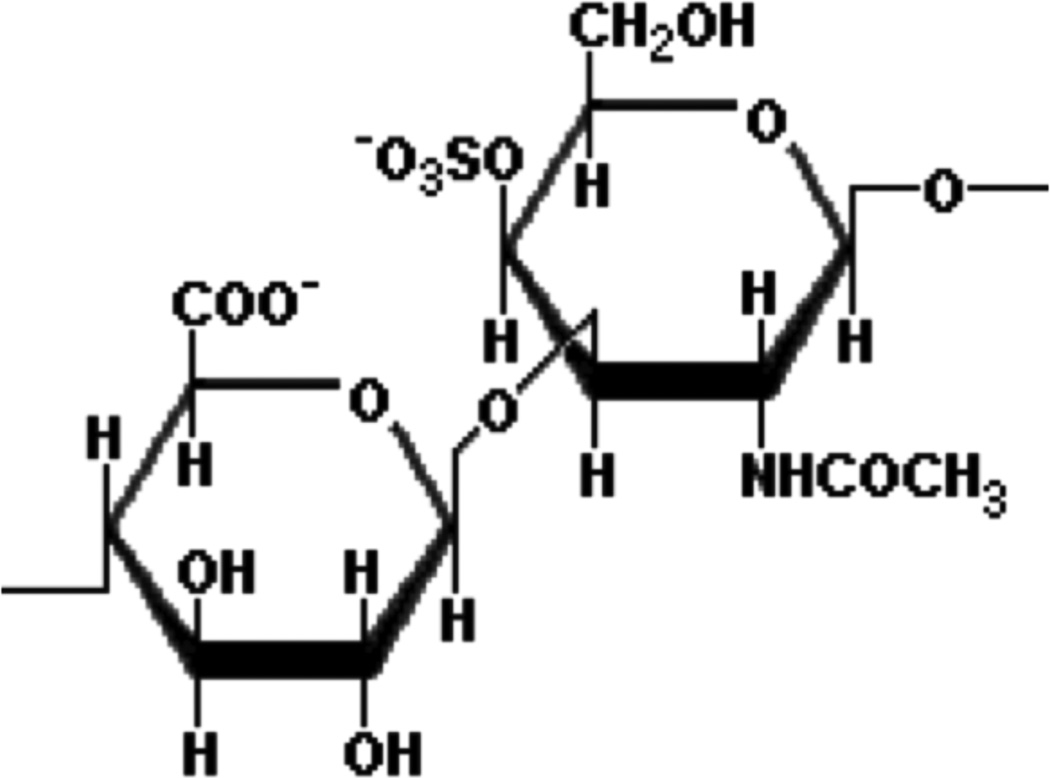
Figure 1 shows the chemical structure of the CS chain repeating unit, the molecular weight of which is 459 Da (excluding counter ions). The hydrophilic polysaccharide backbone, combined with the electrostatic repulsion among the negatively charged molecules, ensures that solutions in water are stable over a wide range of pH and salt concentration. The average molecular weight of naturally occurring CS chains lies in the range 30 – 40 kDa. The distance between charges depends on the position of the sulfate and carboxyl groups, and varies between about 3 and 5 Å [6]. CS is a naturally stiff polymer with a persistence length of roughly 80 Å [7]. In solution or in its biological milieu, changes in the local environment, due for example to hydration, salt concentration or ionic composition, influence the interactions with neighboring CS molecules and other surrounding species.
Figure 1.
Chemical structure of the disaccharide repeating unit of the CS chain.
CS is frequently attached to proteins as part of a proteoglycan. Chondroitin sulfate proteoglycans (CSPGs) are important components of the extracellular matrix (ECM). In the central nervous system (CNS) they play an essential role in controlling neuronal differentiation and development. They guide axonal growth [10], inhibit neural crest cell migration [11] and, in later stages of development as well as in adulthood, they regulate neuronal plasticity by forming perineuronal nets around synapses [12,13]. In damaged nervous systems, they exhibit growth-inhibitory activities in the glial scar such as hindering axon regeneration or compensatory sprouting [14–16].
The ability of sulfated polysaccharides to complex divalent cations, especially calcium ions, is an important biological function of this class of polymer. For example, proteoglycans (and their constituent glycosaminoglycan chains) perform an important role in the regulation of endochondral ossification, since local degradation or disaggregation of proteoglycan initiates calcification of epiphyseal cartilages [17–19]. GAG components of the tendon (CS and dermatan sulfate) associate with collagen and are involved in the fibril assembly process during tendon development.
CS is the major structural component of the bottlebrush-shaped molecule aggrecan, a large aggregating proteoglycan in the cartilage ECM, which forms complexes with hyaluronan and provides compressive resistance under external load. These large aggrecan/hyaluronan complexes are enmeshed in a network of collagen, where the structural stability is enhanced by the ionic interactions between the negatively charged CS bristles and the positive charges on the collagen fibrils. In this context the interaction between the CS chains and different cations is of particular importance. Woodward and Davidson reported that bone calcification occurs through the release of calcium ions bound to proteoglycans in cartilage [20,21]. Previous studies also indicated that (i) the degree of calcium ion binding to chondroitin sulfate was larger than that of sodium ions, and (ii) the association of calcium ions with the polymer cannot be ascribed solely to electrostatic forces. However, no significant differences were detectable in the degree of ion binding of different chondroitin sulfate isomers [22].
The purpose of the present study is to advance our understanding of the physical-chemical properties and biological function of CS by exploration of the effect of ion concentration and valence on the structure and dynamics of CS solutions. We report a systematic investigation using complementary experimental techniques, small angle neutron scattering (SANS) and dynamic light scattering (DLS). The ion concentration is varied in a wide concentration range around the physiological conditions and beyond.
The organization of this paper is as follows. First, the sample preparation is described and the SANS and DLS techniques and experimental setups briefly introduced. Then SANS results for CS solutions are presented as a function of the polymer concentration. SANS probes the structure over a broad range of length scales extending from approximately 1 nm to macroscopic sizes. DLS is used to determine the effect of the ionic environment on the dynamic response over a similar range of ionic concentrations. A comparison is made between the effects of sodium chloride and calcium chloride on the organization and dynamic properties of the CS solutions. In the final section, we discuss some biological implications of the results.
EXPERIMENTAL SECTION
Sample Preparation
For the SANS measurements, solutions of the sodium salt of chondroitin sulfate (Sigma-Aldrich) were prepared in D2O, and in H2O for those with DLS. The CS concentration ranged between 1% and 20% w/w. Concentrations of added sodium chloride and calcium chloride were varied between 0 and 500 mM and 0 and 200 mM respectively. DLS measurements were made on CS solutions containing 100 mM NaCl, with concentrations of CaCl2 between 0 and 200 mM.
In all samples the pH was 7, where CS is fully dissociated. The samples were allowed to homogenize for 2–3 days. Both SANS and DLS measurements were made at 25.0 °C ± 0.1 °C.
Small Angle Neutron Scattering Measurements
The SANS measurements were made on the NG3 instrument at NIST, Gaithersburg, MD. Solutions were placed in sample cells of 1 mm optical path equipped with quartz windows. The wavelength of the incident radiation was λ = 8 Å, with wavelength spread Δλ/λ = 0.10. The transfer wave vector range explored was 2.8×10⁻³ Å−1 < q < 0.3 Å−1, where , θ being the scattering angle and n the refractive index of the medium (in SANS experiments, n is close to unity). After azimuthal averaging, the spectra were corrected for detector response and cell window scattering. The incoherent background was subtracted following the procedure described previously [23]. Normalization was carried out using standard NIST samples. To convert to thermodynamic units, the value of the contrast factor (ρp−ρD2O)2 of the dissociated monomer in D2O was taken to be 1.56×1021 cm−4.
Dynamic Light Scattering
DLS measurements were made with an ALV DLS/SLS 5022F goniometer (ALV Langen, Germany), with a HeNe laser working at 6328 Å and an ALV 5000E multi-tau correlator. Measurements were performed in the angular range 30° to 150° with accumulation times of 200 s. Absolute intensities were obtained by normalizing with respect to toluene. Transmission measurements were made at 6328 Å with a Uvikon 810 spectrophotometer. The refractive index increment of the CS-water system was taken to be 0.17 cm3/g.
RESULTS AND DISCUSSION
Small Angle Neutron Scattering
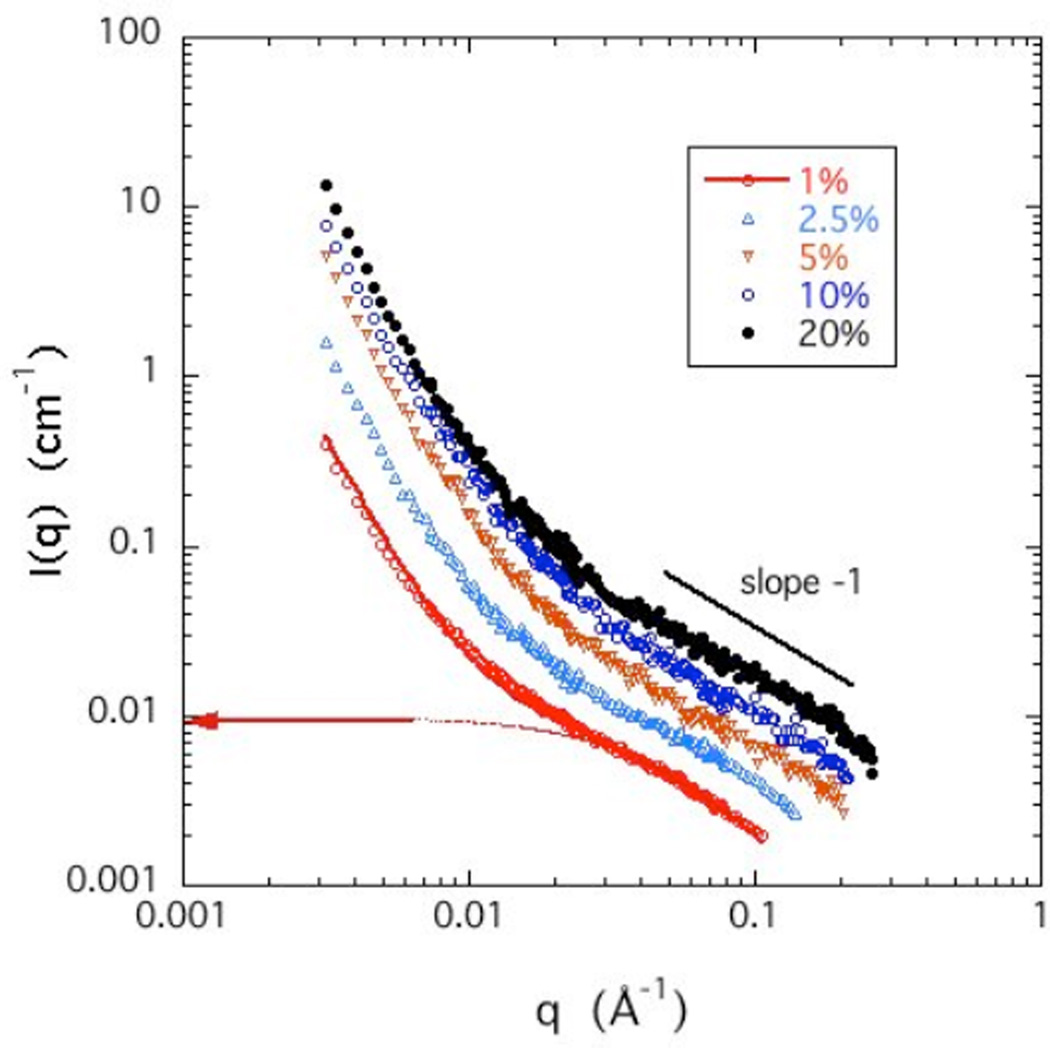
SANS yields information on the organization of the CS molecules over a length scale range 2π/q that extends from 20 Å to 4000 Å. The SANS response for the CS solutions in D2O with 100 mM NaCl is shown in Figure 2 at five different polymer concentrations c ranging from 1% – 20% w/w. Since the overlap concentration c* (=3M/4RG3, where M is the mass and RG the radius of gyration of the polymer), estimated from the geometry of the molecule, is approximately 1%, all the solutions belong to the semi-dilute concentration regime.
Figure 2.
SANS curves of CS solutions at different concentrations in 100 mM NaCl. Horizontal arrow at left axis and dotted curve indicate the thermodynamic contribution of the intensity calculated from DLS for the 1% w/w CS sample (see Appendix A).
Each SANS curve displays two clearly distinguished power law regions. At high q (0.015 Å−1 ≤ q ≤ 0.25 Å−1, corresponding to distances ranging from the size of the repeating unit to beyond the persistence length) the intensity varies as 1/q, indicating that the scattering elements are linear, in conformity with the semi-rigid nature of the individual CS chains. In solutions of neutral polymers, this q-range would correspond to the single chain regime, where the intensity is proportional to the polymer concentration. In semi-dilute solutions, however, the molecules overlap to form a random mesh. The deviation from 1/q behavior at about 0.02 Å−1 is governed by the interchain distance (mesh size), which decreases with increasing concentration. At low q the curves in Figure 2 exhibit a different power law behavior of slope steeper than or equal to −3. Such behavior is a general feature in polyelectrolyte solutions, and is attributed to surface scattering from large clusters [24–27]. The crossover point qx between these two regimes, yields a distance L = 1/qx over which linear behavior holds (see Appendix A). L thus possesses the attributes of a persistence length. The values of L, which is a decreasing function of polymer concentration, are listed in Table 1.
Table 1.
Length of apparent linear behavior from SANS in CS solutions containing 100 mM NaCl
| c (w/w) | L (Å) |
|---|---|
| 0.01 | 127 |
| 0.025 | 93 |
| 0.05 | 74 |
| 0.1 | 71 |
| 0.2 | 71 |
To describe these two regimes, the following expression is used,
| (1) |
where the first term is due to the thermal concentration fluctuations and the second describes the contribution from the large clusters. In eq 1 A and n are constants. The continuous curve through the 1% CS solution data in Figure 2 is the fit to eq. 1, where the first term is expressed as (see Appendix A, eq A6)
| (2) |
In eq 2, (ρp − ρD2O)2 = 1.56×1021 cm−4 is the value previously noted for the neutron scattering length contrast between CS and D2O [28], k is the Boltzmann constant, T the absolute temperature, κ = 79.6 kPa is the osmotic modulus of the 1% solution obtained by DLS (see appendix B), rc is the cross-sectional radius of the CS chain, and ξ is the correlation length of the thermal fluctuations of the linear chain section. The arrow on the left axis of Figure 2 shows the calculated intensity from eq 2 at q = 0. The fit to the SANS data yields ξ = 34 Å, with rc = 6.2 Å. The value of rc is in good agreement with that reported for CS by Tanaka [22]. In Appendix A the value of ξ is compared with that determined from DLS for the same CS solution. According to Table 1, the length scale L determined from the cross-over point qx is much greater than the thermal correlation length ξ. This result implies that the concentration fluctuation modes in the solution are not isotropic, but principally involve motions perpendicular to the chain axes.
The intensity of the SANS responses in Figure 2 is an increasing function of concentration. For neutral polymers in the high q region, where single chain behavior is expected, the scattering intensity is generally proportional to the polymer concentration, i.e., I(q) ∝ c. In the high q region of the present CS solutions, however, the concentration dependence of the intensity is weaker than linear: over the whole concentration range I(q) ∝ cm, with m = 0.7. This finding implies that in solutions of this charged polymer, coupling between the chains is not negligible even at high resolution (qξ > 1).
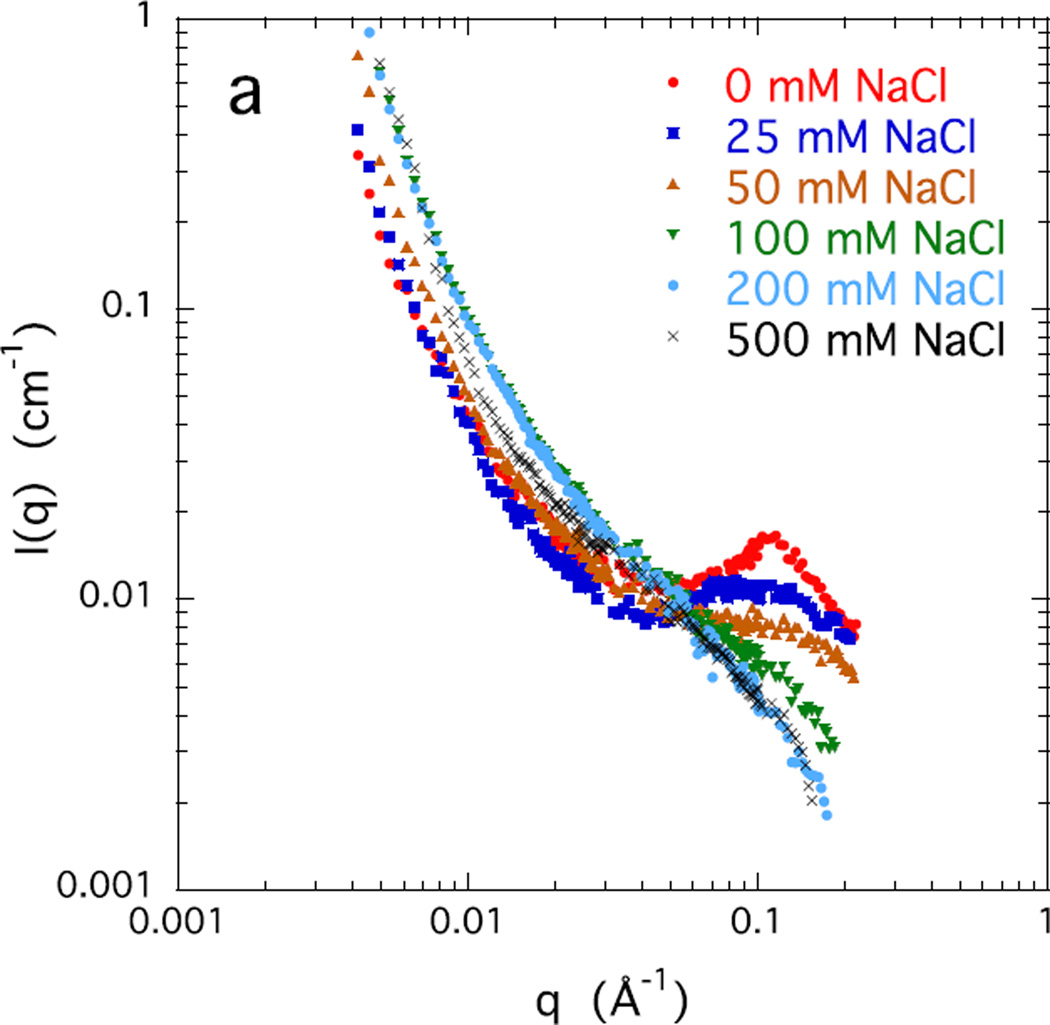
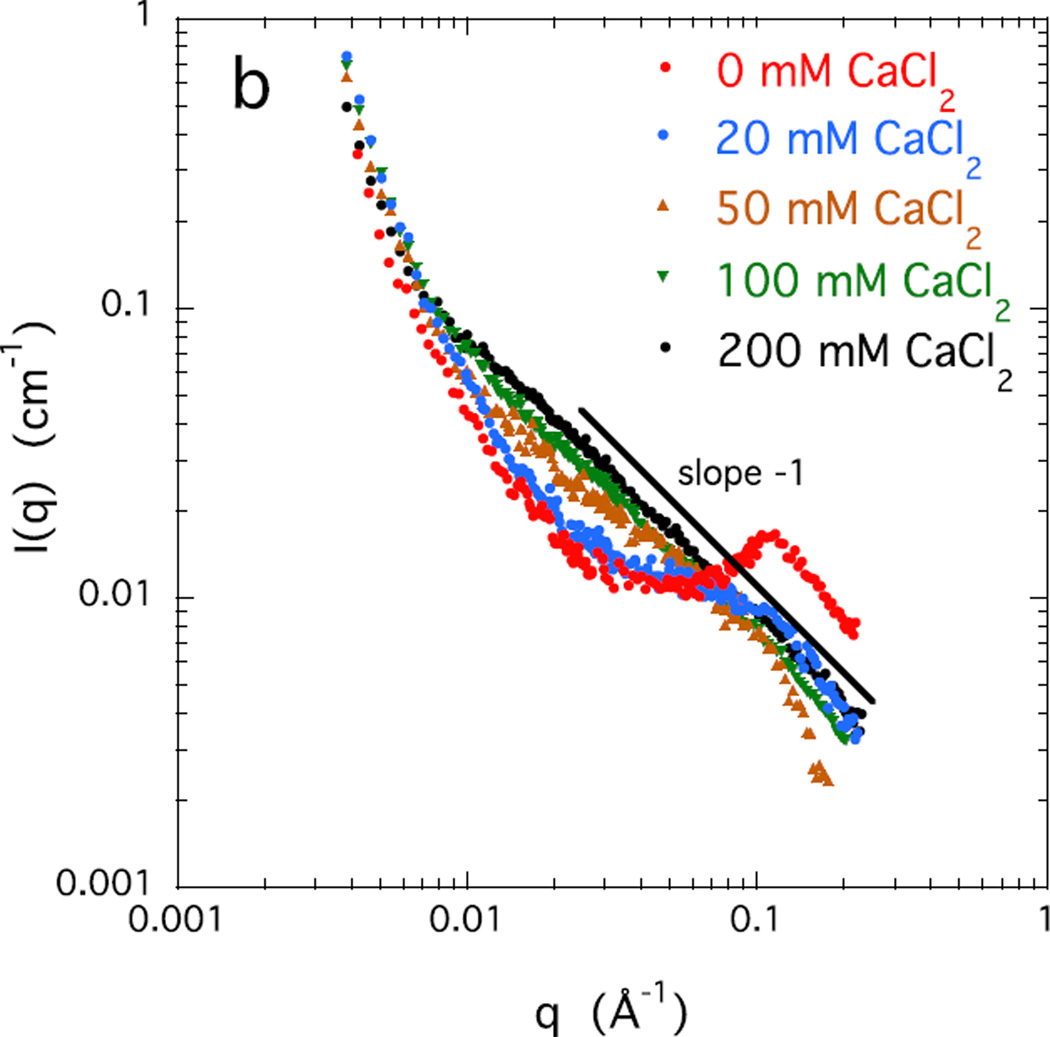
Figures 3 a and b show the SANS response of a 4% w/w salt-free CS solution, together with that of solutions containing increasing concentrations of NaCl and CaCl2 respectively. The salt free solution displays a correlation peak at q* = 0.11 Å−1. In this condition where the Coulomb repulsion between adjacent chains is maximum, local ordering occurs, with a characteristic interchain separation distance d = 2π/q* ≈ 57 Å.& With increasing salt concentration the correlation peak becomes broader and weaker, gradually disappearing at about 100 mM NaCl, or above 20 mM CaCl2. Above these values of salt concentration the q−1 behavior is recovered. For both sodium and calcium ions the SANS responses exhibit an isoscattering point at q ≈ 0.06 Å−1 where the scattering intensity is independent of the salt concentration.
Figure 3.
SANS response of 4% w/w CS solutions at different concentrations of a) NaCl, and b) CaCl2.
A remarkable feature of Figure 3b is that all the curves in the region q < 0.01 Å−1 are practically identical. This is the length scale range in which the effects of cross-linking on the structure become visible in scattering measurements [29,30]. The observed invariance of the signal to CaCl2 concentration implies that calcium ions do not form permanent cross-links.
At high ionic concentration an appreciable difference becomes apparent between the responses to NaCl and to CaCl2. Although the scattering response with both salts becomes practically independent of the salt concentration, the intensity of the calcium containing solution is significantly greater. In this system, the rod-like 1/q variation of the intensity extends to significantly lower values of q : with 200 mM CaCl2 the value of L is approximately 170 Å. (We note that birefringence measurements reveal no evidence of liquid crystalline regions in these CS solutions.) In general, an increase in intensity is the signature of associations among polymer chains. The results imply that divalent calcium ion, unlike the monovalent sodium ion, significantly enhances interchain association between neighboring CS chains.
In summary, in the salt free solution the electrostatic repulsion among the stiff negatively charged CS molecules results in local stacking with short range order, as demonstrated by the correlation peak in the SANS measurements. With increasing salt concentration, for both sodium and calcium ions, local order decreases, and the behavior of the CS solution approaches that of neutral polymer solutions, i.e., the scattering response becomes independent of the salt concentration. The main effect of high salt concentrations is to reduce the Debye screening length, i.e., to reduce the repulsion among the negative charges on the polymer chains. SANS also reveals dynamic chain association, but not permanent cross-links, mediated by the divalent calcium ions. Phase separation does not occur, even in the presence of 200 mM CaCl2.
Dynamic Light Scattering
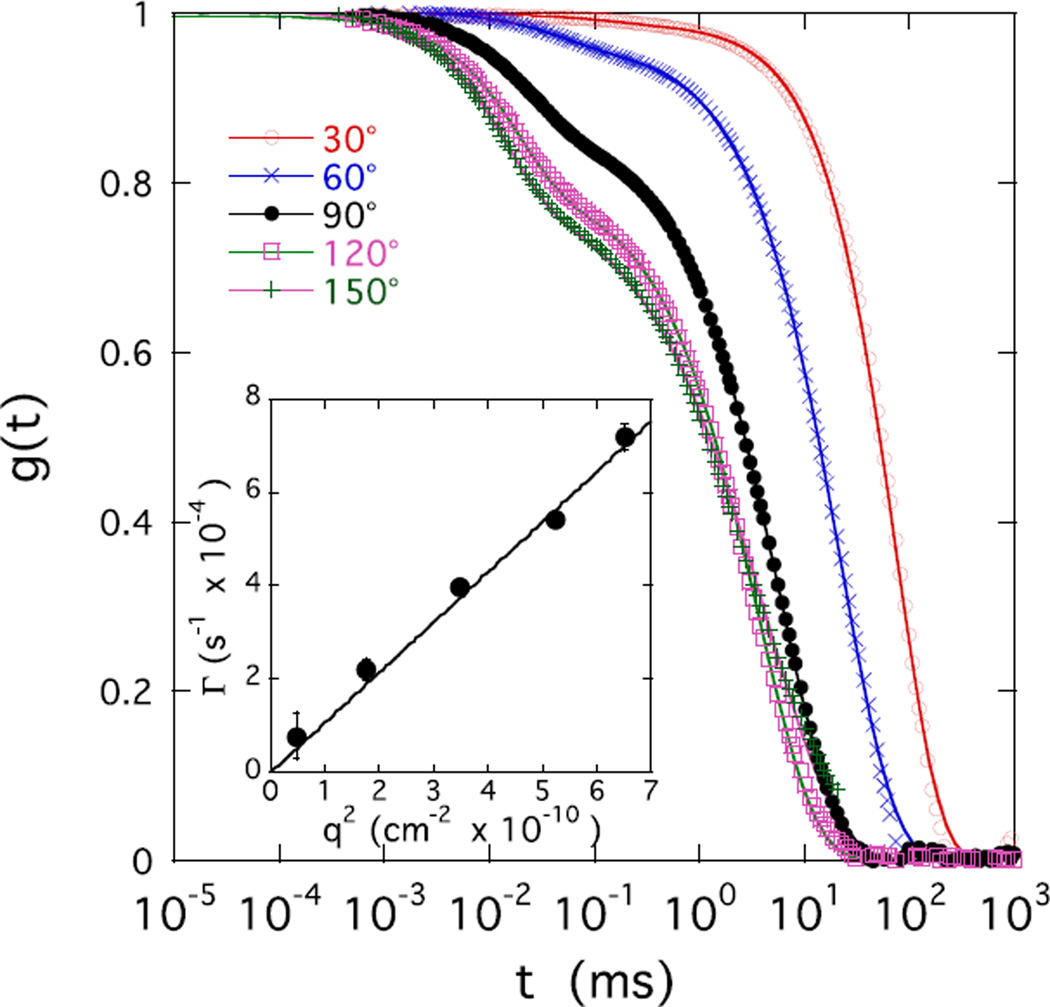
The structural changes due to the presence of ions also affect the dynamic properties of CS solutions. DLS probes concentration fluctuations on the length scale of visible light. Figure 4 shows typical field correlation functions measured in a 2% w/w CS solution containing 100 mM NaCl at five different scattering angles θ. Each curve displays a double relaxation process, the two relaxation rates being separated by two or more orders of magnitude, which, as detailed in Appendix B, can be described by
| (3) |
The amplitudes a and (1−a) are the relative intensities of the fast and slow relaxation modes respectively, with Γ and Γs the corresponding relaxation rates. The fast relaxation rate Γ is diffusive and is proportional to q2. This relationship is illustrated in the inset of Figure 4, where the values of Γ obtained by fitting eq 3 to the correlation function are plotted against q2. Γ represents the relaxation of the thermal concentration fluctuations, which are governed by the collective diffusion coefficient D [31]
| (4) |
It follows that the correlation length ξ describing the spatial range of the thermal concentration fluctuations is defined by the Stokes-Einstein relationship [31]
| (5) |
in which η is the viscosity of the solvent.
Figure 4.
Angular dependence of the field correlation function g(t) of light scattered by CS solution at c = 2% w/w in 100 mM NaCl at different scattering angles θ. Inset: variation of fast relaxation rate Γ with q2.
The slow relaxation component in eq 3 (second term) is due to the internal modes of large clusters. For such modes, where no unique correlation length is distinguishable, the relaxation process can be represented by a stretched exponential decay with an exponent μ ≈ 2/3. The trend in Figure 4 shows that the intensity of the slow component (1−a) increases with decreasing scattering angle θ, indicating that the clusters are very large. This finding is consistent with the large increase in intensity at small values of q in the SANS responses. The clusters have non-uniform internal organization, i.e., there is no well-defined mesh-size. (The increase in intensity of the slow component may be appreciated by noting that the field correlation function g(t) in Figure 4 is normalized to unity: the absolute value of the intensity scattered by the osmotic fluctuations is independent of θ.) While the Nernst-Hartley model provides some insight into the effect of ion mobility on the fast mode it does not describe the phenomenology of the slow mode [25,32]. There has been much speculation in the literature about the origin of the slow component, however, a complete interpretation of this mode still remains elusive. It is important to note that aggregate formation has also been observed in dilute CS solutions by light scattering measurements [33–35].
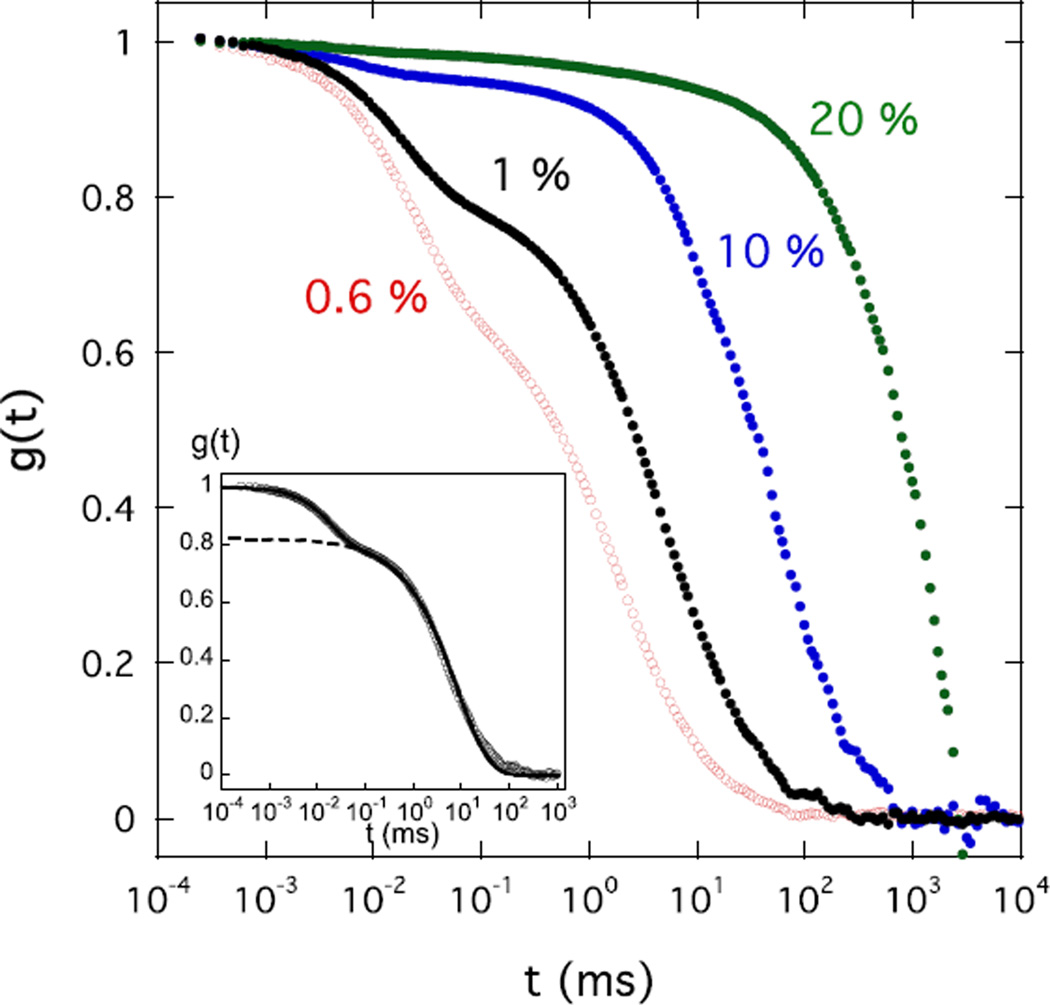
Figure 5 shows the DLS field correlation functions at fixed scattering angle θ = 150° in solutions of different CS concentration with 100 mM NaCl. The curves exhibit the same double relaxation behavior as before and are accordingly decomposed using eq 3. The inset in the figure illustrates the decomposition for the 1 % w/w sample. With increasing concentration, Γs becomes slower. The relative intensity (1−a) of this component also increases. Decrease of Γs with increasing polymer concentration was also reported for semi-dilute solutions of flexible polyelectrolytes [25].
Figure 5.
Field correlation functions g(t) of light scattered at θ = 150° by CS solutions of different concentration c in 100 mM NaCl. Inset shows fit of eq 3 to the data from c=1% w/w (continuous line); dashed line is the second term in the fit to this equation.
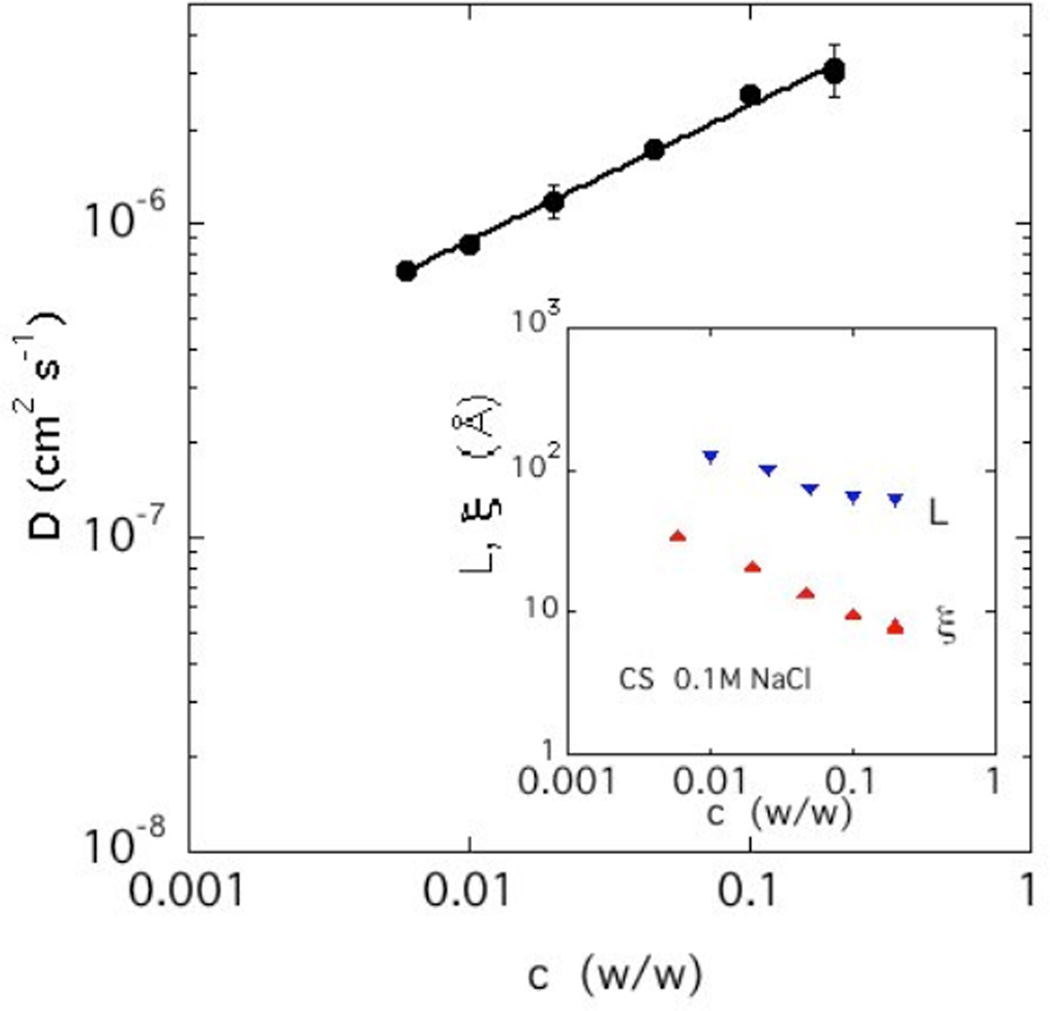
The values of the diffusion coefficient obtained from the fast relaxation rate are plotted as a function of c in Figure 6. Over the entire concentration range (0.6% w/w ≤ c ≤ 20% w/w), D obeys a power law dependence of the form
| (6) |
with m = 0.43. The experimental exponent is lower than that predicted by de Gennes [31] for uncharged polymers of infinite molecular weight in good solvent conditions (m = ¾.). A similar low value for the exponent m has been observed in solutions of hyaluronic acid [36]. The deviation from the neutral polymer value may be related to long range hydrodynamic interactions in polyelectrolyte systems.
Figure 6.
Dependence of D on CS concentration in solution with 100 mM NaCl. The slope of the power law fit is 0.43. Inset: characteristic linear range L from SANS and correlation length ξ from DLS.
The correlation length ξ calculated using eq 5 is displayed in the inset of the figure (lower curve). For solutions of uncharged flexible polymers ξ corresponds to the mesh size of the network. The dynamics of polyelectrolyte solutions is based on the same scaling assumption as that used in solutions of neutral polymers. It relies on the existence of the single length scale where both hydrodynamic and electrostatic interactions are screened. The screening of these interactions happens at distances comparable with the solution correlation length, as confirmed both by the effective medium calculations of Muthukumar [37–39] and by experiment [40].
In the inset in Figure 6 the thermodynamic length scale ξ is compared with the length L of the linear chain sections observed in SANS. The latter is more than 5 times greater than ξ, i.e., the length of the linearly ordered structures substantially exceeds the range of the thermodynamic interactions. The concentration dependence of these two lengths is, however, closely similar.
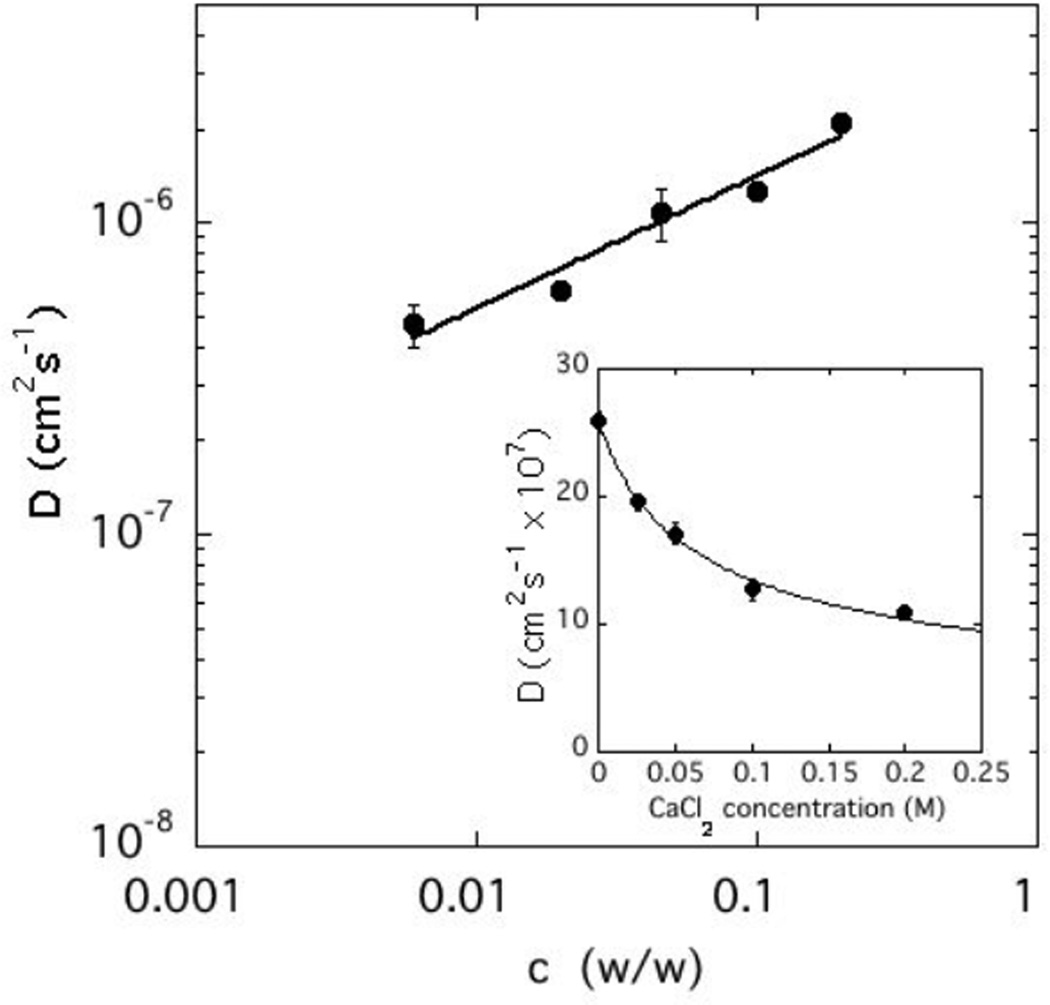
The effect of calcium ions on the dynamics of CS solutions is illustrated in Figure 7, where the values of D measured in solutions containing 100 mM NaCl and 100 mM CaCl2 are plotted as a function of CS concentration. Addition of CaCl2 decreases the value of D by a factor of almost 2. The power law fit through the data points is similar to that of eq 6 in which m = 0.42, i.e., within experimental error the same dependence as with NaCl alone. The inset in this figure shows the variation of D with CaCl2 concentration for c = 10%. The continuous line is the fit to a power law with respect to the CaCl2 concentration, cCaCl2, in which the exponent is −0.45. Thus,
| (7) |
Figure 7.
Variation of the collective diffusion coefficient D with concentration of CS solution in 100 mM NaCl + 100 mM CaCl2. Inset: variation of D with CaCl2 concentration for c = 10% w/w.
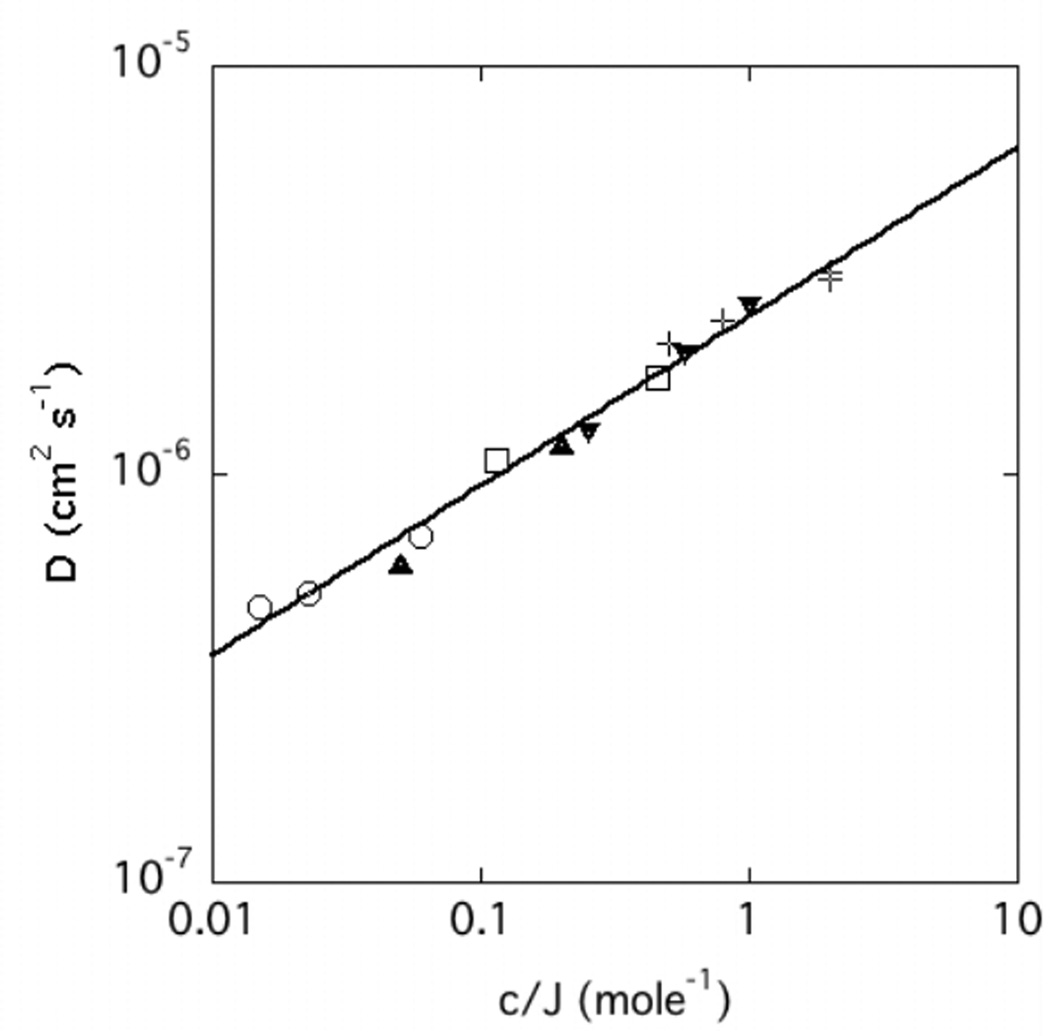
The exponents found for the power law dependence of D on the CS concentration and for the CaCl2 concentration are, within experimental error, numerically identical and opposite in sign. This inverse relationship between c and cCaCl2 suggests that D is a function of a single variable, c, normalized by the ion concentration. To accommodate for the different valences, the ion concentration of the solution must be expressed in terms of the ionic strength J (=½ΣZi2ci, where Zi is the valence of the ionic species i and ci its molar concentration) of the added salt. In Figure 8 D is plotted as a function of the normalized variable c/J, where J includes all the added ions. In this figure, each polymer concentration c is denoted by a different symbol. Within experimental error, all the data points fall on a master curve, defined by
| (8) |
where, for convenience, c is expressed in w/w and J in moles. It is notable that these measurements are in good agreement with those of Trivant et al. made on CS solutions in the low concentration regime [33].
Figure 8.
Dependence of D on the variable c/J, where c is expressed in mass fraction w/w, J is the ionic strength in moles. Symbols: ○ : c = 0.006; up triangles: c = 0.02; open square: c = 0.046; down triangle c = 0.1; + c = 0.2.
In summary, the DLS correlation functions of the CS solutions display two distinct relaxation modes. The fast component is diffusive and is governed by the thermal concentration fluctuations. The slow mode reflects the presence of large clusters that give rise to the strong excess scattering at low q in SANS. The collective diffusion coefficient D derived from the fast mode increases with CS concentration and decreases with increasing calcium ion content. Over the range of ion concentrations studied, D displays a power law dependence of the single variable c/J. This relationship, which is independent of the valence of the added ions, is evidence against specific binding effects between calcium ions and the anionic groups of the CS chain.
BIOLOGICAL IMPLICATIONS
In this section we show how the physical properties of CS solutions discussed in this paper are related to certain physiological roles of this molecule. Instead of providing a comprehensive list of potential biological implications of the results, we illustrate with a few specific examples the usefulness of the quantitative physical-chemical approach to address problems that cannot be resolved by other means.
The structural stability of CS solutions under high salt concentrations observed by SANS is a precondition for this molecule to form stable connections with different biological molecules. Owing to the high charge density of CS, most interactions between the target molecules and CS are ionic in character. CS binds extracellular matrix components together, mediating the binding of bone-like cells, such as osteoblasts and osteoclasts, to the matrix, and capturing soluble molecules such as growth factors into the matrix and at cell surfaces [41,42].
Both the binding ability and the mobility of the CS molecule play an important part in wound repair. Together with other proteoglycans, e.g., dermatan sulfate, CS forms a homogeneous meshwork around the wound, sealing the injury site and preventing damage to surrounding healthy tissue. In this process the high mobility of the CS molecule, by virtue of its small size, is a significant advantage. In addition, its stability and extended configuration in the presence of calcium ions provides structural integrity and suitable mechanical strength.
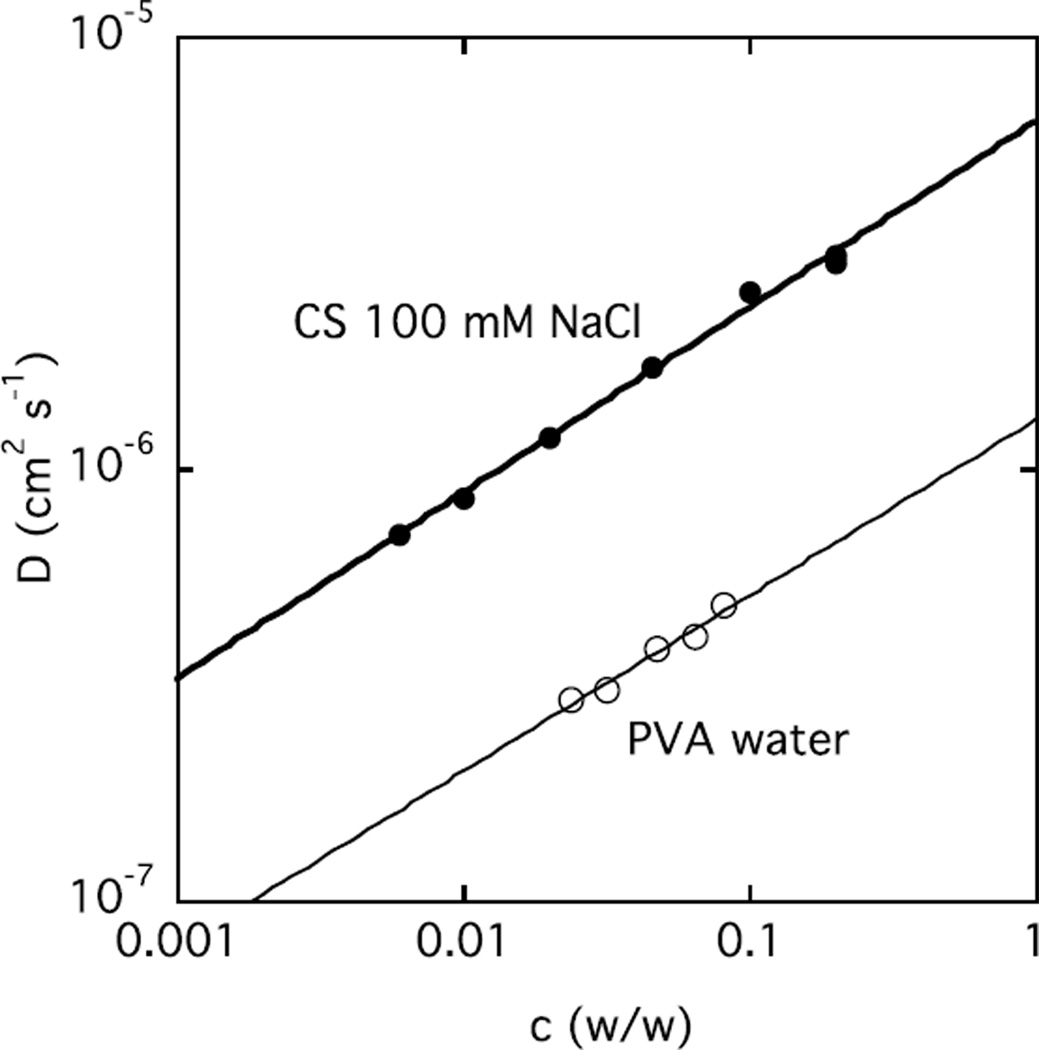
In cartilage, two further physical properties are also of critical significance, namely rapid response to external stress and a high osmotic modulus to withstand compressive loading. Fast recovery after deformation requires a high collective diffusion coefficient D, which can be quantified by DLS. Figure 9 shows that for CS solutions in 100 mM NaCl, D is almost 5 times greater than in a typical neutral polymer poly(vinyl alcohol) (PVA) solution in water [43].
Figure 9.
Comparison of D(c) of CS in 100 mM NaCl with that of poly(vinyl alcohol) in water at 25 °C.
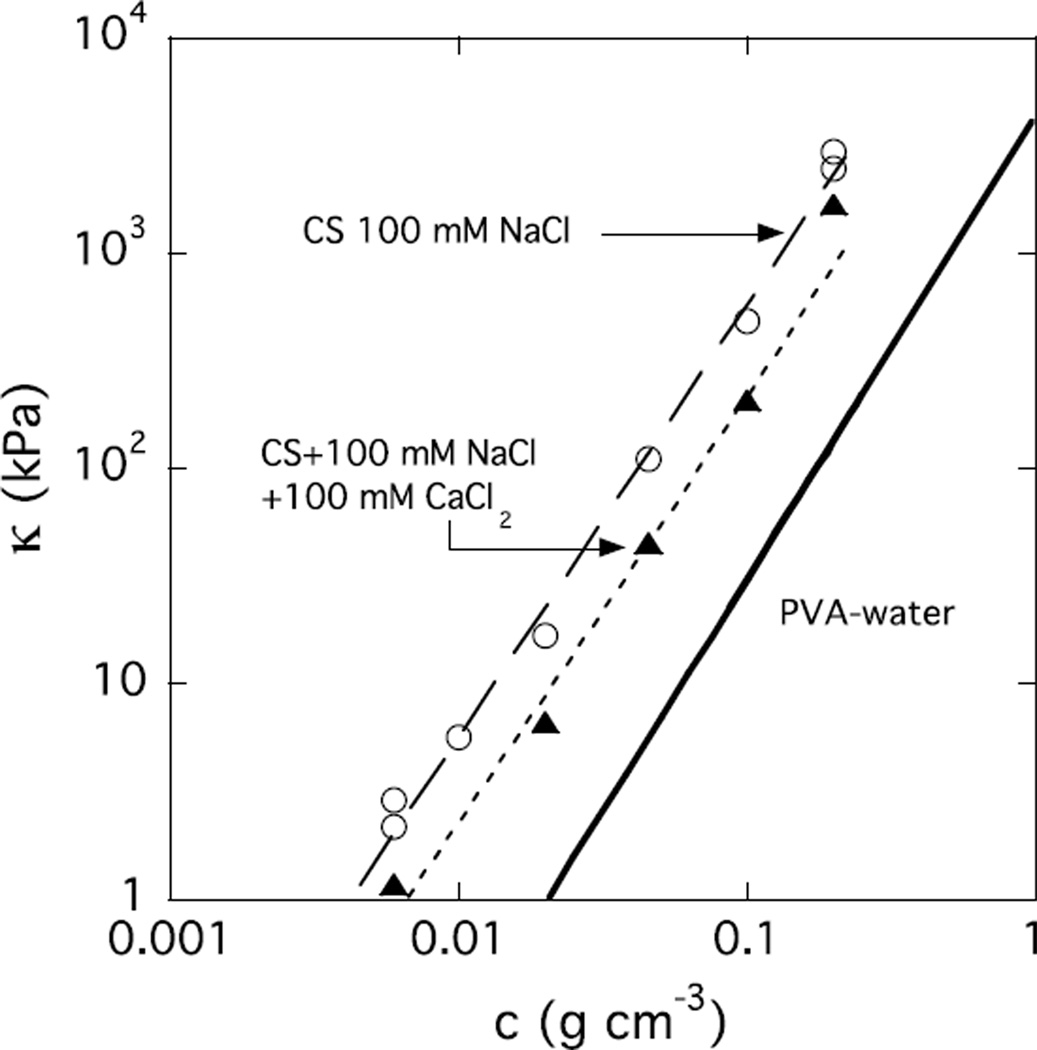
In the aggrecan bottlebrush, the load bearing capacity of cartilage depends strongly on the CS component, which varies with age of the tissue, the state of health or disease (e.g., osteoporosis, rheumatoidal arthritis), and the depth within the cartilage layer [44–46]. The measure of resistance to compressive loads is the osmotic modulus κ = c∂Π/∂c, where Π is the osmotic pressure in the solution. This quantity can be determined from DLS measurements. In this case, κ is inversely related to the intensity of light scattered by the thermal concentration fluctuations (see Appendix B).
Figure 10 shows the concentration dependence of the osmotic modulus of CS solutions in 100 mM NaCl. The value of κ in a 20% w/w CS solution with 100 mM NaCl is about 3 MPa. Addition of 100 mM calcium chloride decreases κ by a factor of less than 3. The solid line in this figure shows the dependence of κ for a PVA-water solution at the same concentration [43]. The much higher value of κ in CS solutions, by more than an order of magnitude, makes this molecule exceptionally well suited as a structural material for compression resistance.
Figure 10.
Concentration dependence of the osmotic modulus κ of CS solutions in 100 mM NaCl without (open symbols) and with (filled symbols) 100 mM CaCl2. The continuous line is the corresponding data from the PVA-water system [43].
CONCLUSIONS
Chondroitin sulfate, a major component in biological tissues, participates in a variety of physiological functions. To comprehend its biological role and to develop effective strategies for tissue design and replacement, it is of particular importance to understand the effects of ions on its structure and dynamics.
Observations by SANS and DLS, made on CS solutions under different ionic conditions, close to and beyond the physiological range, reveal significant changes in the local order in the low ion concentration range. In the physiological range the structure of the CS solutions depends only weakly on the salt concentration. In both NaCl and CaCl2 aligned linear regions are distinguishable corresponding to length scales ranging from the monomer length to about 150 Å. With increasing CaCl2 concentration, the region of the SANS response in which linear behavior holds, extends towards increasingly lower values of q. The scattering intensity also increases, indicating that calcium ions enhance the interchain attraction. The SANS responses, however, reveal no sign either of precipitation or of cross-linking due to calcium ions.
The DLS measurements of the CS solutions exhibit two distinct relaxation modes, the fast diffusive component of which corresponds to the thermal concentration fluctuations of collective diffusion. The collective diffusion coefficient D decreases with increasing calcium ion content. Over the range of concentrations studied, D displays a power law dependence on the single variable c/J, where c is the CS concentration and J is the ionic strength of the salt in the solution. The diffusion coefficient of CS in 100 mM NaCl is almost 5 times greater than in the solutions of typical neutral water-soluble polymers at the same concentration.
The measure of resistance of a biopolymer system to dehydration is the osmotic modulus κ. Within the aggrecan bottlebrush, which is the essential load bearing component in cartilage, the concentration of CS is approximately 20%. The present DLS results indicate that the osmotic modulus of a 20% CS solution with 100 mM NaCl attains the value 3 MPa.
ACKNOWLEDGMENTS
This research was supported by the Intramural Research Program of the NICHD, NIH. We acknowledge the support of the National Institute of Standards and Technology, U.S. Department of Commerce, in providing the neutron research facilities used in this work. This work utilized facilities supported in part by the National Science Foundation under Agreement No. DMR-0944772. We gratefully acknowledge the help and consultation of Dr. Boualem Hammouda (NIST) with the SANS experiment.
Appendix A
Determination of cross-over point qx
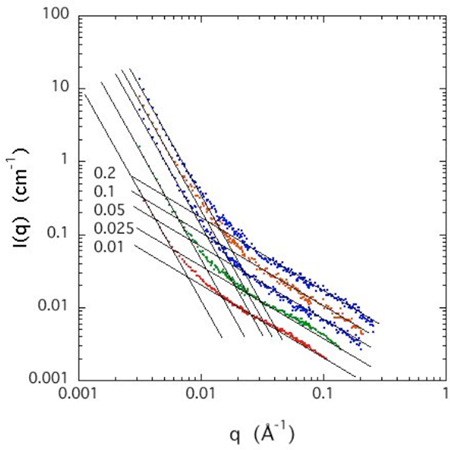
Figure A1 shows the SANS data as Figure 2, with the straight line fits to the two power law regions in q of slope −3 and −1 respectively. The points of intersection qx are listed in Table 1 of the main paper.
Figure A1.
Power law fits to SANS spectra at different CS concentrations 100 mM NaCl.
SANS structure factor of CS solutions
In neutral polymer systems containing large scale inhomogeneities (gels and semi-dilute solutions) the SANS response can be treated as the sum of two separable components
| (A1) |
In the q range qR >> 1 where R is the characteristic size of the inhomogeneity, the second term can be replaced by a power law function, such that
| (A2) |
where A is a constant and n is generally greater than or equal to 3.
The intensity scattered by the thermal fluctuations, Idyn(q) is inversely proportional to the osmotic modulus κ = c∂Π/∂c, where Π is the osmotic pressure in the solution. In a SANS experiment, the intensity scattered by these concentration fluctuations in the thermodynamic limit q→0 is therefore
| (A3) |
where (ρp−ρD2O)2 is the neutron scattering length contrast between CS and D2O, k is Boltzmann’s constant, and T the absolute temperature. In solutions and gels of neutral flexible polymers, the intensity of the dynamic contribution can be described by
| (A4) |
where the structure factor S(q) has the Ornstein Zernike form
| (A5) |
in which ξ is the correlation length of the concentration fluctuations. The validity of this decomposition has been verified for various neutral and charged gel systems [26,43,47–49].
In the case of CS, owing to the semi-rigid character of the chain, it is necessary to replace eq A4 by an expression that takes into account its geometry, i.e., both the linear character of the chain segments and their cross sectional radius rc. To incorporate these features into the structure factor for the q range qrc ≤ 1, we employ the following expression
| (A6) |
in which square root in the first factor reproduces the linear nature of the fluctuating chain segments and the second factor accounts for the cylindrical shape of the polymer molecule. This yields for the intensity scattered by the thermodynamic fluctuations the expression
| (A7) |
The fit shown in Figure 2 yields for the 1% w/w CS solution in 100 mM NaCl, ξ = 34 Å, with rc = 6.2 Å. The measured value of D from DLS for this sample is 8.55×10⁻⁷ cm2 s−1, which, according to eq 5, corresponds to ξ = 29 Å. In view of the completely independent nature of these measurements and the experimental error associated with each, this agreement is satisfactory.
Appendix B
Light Scattering Background
In polymer solutions, the spontaneous concentration fluctuations scatter radiation with an intensity that is inversely proportional to the osmotic modulus κ (= c∂Π/∂c, where Π is the osmotic pressure) [50]. DLS measures the time dependent fluctuations of the scattered light intensity I(t), by constructing the intensity correlation function [51]
| (B1) |
where β is the optical coherence factor of the apparatus, g(t) is the field correlation function and the brackets <> mean averages over the experimental accumulation time. For simple diffusion processes the field correlation function is
| (B2) |
where Γ is the relaxation rate of the concentration fluctuations. In semi-dilute polymer solutions and gels these fluctuations obey the relation
| (B3) |
where D is the collective diffusion coefficient of the polymer chains [31]. According to simple scaling theory of neutral polymer solutions, D is related to a correlation length ξ through the Stokes-Einstein expression
| (B4) |
where η is the viscosity of the solvent.
If the polymer solution contains associations, e.g., large clusters of size R much greater than 1/q, a slow contribution also appears in the correlation function. In the experimental range qR >> 1, such objects possess no intrinsic characteristic size and display a broad range of decay rates, often represented by a stretched exponential decay. The normalized correlation function of the total field is thus
| (B5) |
where a and Γ are the relative amplitude and relaxation rate of the fast process, while (1−a) and Γs are the corresponding quantities for the clusters. The exponent μ is usually smaller than 1. Figure 5 in the text shows that the intensity of the slow component (1−a) increases with decreasing scattering angle θ. According to the inverse relationship between scattered intensity and osmotic modulus κ = c∂Π/∂c, where Π is the osmotic pressure, this implies that the contribution of the large quasistatic objects to the thermodynamic fluctuations is practically negligible and that the essential part of the osmotic pressure can be identified with the fast mode.
The intensity of light scattered by the osmotic fluctuations is given by the Rayleigh ratio Rθ,
| (B6) |
where <I(t)> is the total scattered intensity averaged over the experimental time. K [= (2πn dn/dc)2/λ4, with λ the wavelength of the incident light and dn/dc the refractive index increment of the polymer solvent pair] is the optical contrast factor due to the difference in refractive index between solvent and polymer.
The fast mode defines the osmotic modulus κ of the system. Analysis of the intensity correlation function allows both the relative amplitude a and the relaxation rate Γ of this collective diffusion component to be determined for different scattering angles θ, and κ can be calculated from the Rayleigh ratio of the dynamically scattered light by eq. B6.
Footnotes
The distinction of the factor 2π between the interchain distance d=2π/q* and the length L=1/qx describing the range of linear behavior relates to their different nature. The first is the repeat distance over which the phase of a scattered wave is reinforced in a regular array, and corresponds to Bragg condition qd = 2π. The second defines the distance over which the wave is attenuated, as expressed by the function exp(−qL).
REFERENCES
- 1.Prabhakar V, Sasisekharan R. Adv. Pharmacol. 2006;53:69–115. doi: 10.1016/S1054-3589(05)53005-9. [DOI] [PubMed] [Google Scholar]
- 2.Asimakopoulou AP, Theocharis AD, Tzanakakis GN, Karamanos NK. In Vivo. 2008;22:385–390. [PubMed] [Google Scholar]
- 3.Karamanos NK, Syrokou A, Vanky P, Nurminen M, Hjerpe A. Anal. Biochem. 1994;221:189–199. doi: 10.1006/abio.1994.1396. [DOI] [PubMed] [Google Scholar]
- 4.Lamari FN, Karamanos NK. Adv Pharmacol. 2006;53:33–34. doi: 10.1016/S1054-3589(05)53003-5. [DOI] [PubMed] [Google Scholar]
- 5.Theocharis AD, Tsolakis I, Tzanakakis GN, Karamanos NK. Adv Pharmacol. 2006;53:281–295. doi: 10.1016/S1054-3589(05)53013-8. [DOI] [PubMed] [Google Scholar]
- 6.Ruggiero J J, Vieira RP, Mourão PAS. Carbohydr. Res. 1994;256:275–287. doi: 10.1016/0008-6215(94)84213-2. [DOI] [PubMed] [Google Scholar]
- 7.Bathe M, Rutledge GC, Grodzinsky A, Tidor B. Biophys J. 2005;88:3870–3887. doi: 10.1529/biophysj.104.058800. [DOI] [PMC free article] [PubMed] [Google Scholar]
- 8.Gu W-L, Fu S-L, Wang Y-X, Li Y, Lü H-Z, Xu X-M, Lu P-H. BMC Neurosci. 2009;128:1–15. doi: 10.1186/1471-2202-10-128. [DOI] [PMC free article] [PubMed] [Google Scholar]
- 9.Treloar HB, Nurcombe V, Key B. J Neurobiol. 1996;31:41–55. doi: 10.1002/(SICI)1097-4695(199609)31:1<41::AID-NEU4>3.0.CO;2-F. [DOI] [PubMed] [Google Scholar]
- 10.Landolt RM, Vaughan L, Winterhalter KH, Zimmermann DR. Development. 1995;121:2303–2312. doi: 10.1242/dev.121.8.2303. [DOI] [PubMed] [Google Scholar]
- 11.Pizzorusso T, Medini P, Berardi N, Chierzi S, Fawcett JW, Maffei L. Science. 2002;298:1248–1251. doi: 10.1126/science.1072699. [DOI] [PubMed] [Google Scholar]
- 12.Brakebusch C, Seidenbecher CI, Asztely F, Rauch U, Matthies H, Meyer H. Mol. Cell Biol. 2002;22:7417–7427. doi: 10.1128/MCB.22.21.7417-7427.2002. [DOI] [PMC free article] [PubMed] [Google Scholar]
- 13.Bradbury EJ, Moon LD, Popat RJ, King VR, Bennett GS, Patel PN. Nature. 2002;416:636–640. doi: 10.1038/416636a. [DOI] [PubMed] [Google Scholar]
- 14.Moon LD, Asher RA, Rhodes KE, Fawcett JW. Nat. Neurosci. 2001;4:465–466. doi: 10.1038/87415. [DOI] [PubMed] [Google Scholar]
- 15.Barritt AW, Davies M, Marchand F, Hartley R, Grist J, Yip P. J. Neurosci. 2006;26:10856–10867. doi: 10.1523/JNEUROSCI.2980-06.2006. [DOI] [PMC free article] [PubMed] [Google Scholar]
- 16.Carulli D, Pizzorusso T, Kwok JCF, Putignano E, Poli A, Forostyak S, Andrews MR, Deepa SS, Glant TT, Fawcett JW. Brain. 2010;133:2331–2347. doi: 10.1093/brain/awq145. [DOI] [PubMed] [Google Scholar]
- 17.Buckwalter JA. Clinical Orthopaedics and Related Research. 1983;172:207–232. [PubMed] [Google Scholar]
- 18.Hunter GK, Wong KS, Kim JJ. Archives of Biochemistry and Biophysics. 1988;260:161–167. doi: 10.1016/0003-9861(88)90437-7. [DOI] [PubMed] [Google Scholar]
- 19.Anderson HC, Garimella R, Tague SE. Frontiers in Bioscience. 2005;10:822–837. doi: 10.2741/1576. [DOI] [PubMed] [Google Scholar]
- 20.Hascall VC, Hascall GK. In: Cell Biology of Extracellular Matrix. Hay ED, editor. New York: Plenum; 1981. pp. 39–63. [Google Scholar]
- 21.Woodward C, Davidson EA. Proc. Natl. Acad. Sci. USA. 1998;60:201–205. doi: 10.1073/pnas.60.1.201. [DOI] [PMC free article] [PubMed] [Google Scholar]
- 22.Tanaka K. J Biochem. 1978;83:647–653. doi: 10.1093/oxfordjournals.jbchem.a131955. [DOI] [PubMed] [Google Scholar]
- 23.Horkay F, Hecht A-M, Mallam S, Geissler E, Rennie AR. Macromolecules. 1991;24:2896–2901. [Google Scholar]
- 24.Borsali R, Nguyen H, Pecora R. Macromolecules. 1998;31:1548–1555. [Google Scholar]
- 25.Zhang Y, Douglas JF, Ermi BD, Amis E. J. Chem. Phys. 2001;114:3299–3313. [Google Scholar]
- 26.Horkay F, Basser P, Hecht AM, Geissler E. Macromolecules. 2000;33:8329–8333. [Google Scholar]
- 27.Horkay F, Hecht AM, Geissler E. J. Polym. Sci. B: Polym. Phys. 2006;44:3679–3686. [Google Scholar]
- 28.Sears VF. Neutron News. 1992;3:26–37. [Google Scholar]
- 29.Horkay F, Hecht AM, Mallam S, Geissler E, Rennie AR. Macromolecules. 1991;24:2896–2902. [Google Scholar]
- 30.Horkay F, Hecht AM, Geissler E. Macromolecules. 1994;27:1795–1798. [Google Scholar]
- 31.de Gennes PG. Scaling Concepts in Polymer Physics. Ithaca NY: Cornell; 1979. [Google Scholar]
- 32.Forster S, Schmidt M. Advances in Polymer Science. 1995;120:51–133. [Google Scholar]
- 33.Tivant P, Turq P, Drifford M, Magdelenat H, Menez R. Biopolymers. 1983;22:643–662. [Google Scholar]
- 34.Ghosh S, Peitzsch RM, Reed WF. Biopolymers. 1992;32:1105–1122. doi: 10.1002/bip.360320304. [DOI] [PubMed] [Google Scholar]
- 35.Peitzsch RM, Burt MJ, Reed WF. Macromolecules. 1992;25:806–815. [Google Scholar]
- 36.Horkay F, Basser PJ, Londono DJ, Hecht A-M, Geissler E. J. Chem. Phys. 2009;131:184902. doi: 10.1063/1.3262308. [DOI] [PMC free article] [PubMed] [Google Scholar]
- 37.Muthukumar M. Polymer. 2001;42:5921–5923. [Google Scholar]
- 38.Muthukumar M. J. Chem. Phys. 1997;107:2619–2635. [Google Scholar]
- 39.Dobrynin AV, Rubinstein M. Prog. Polym. Sci. 2005;30:1049–1118. [Google Scholar]
- 40.Boris DC, Colby RH. Macromolecules. 1998;31:5746–5755. [Google Scholar]
- 41.Schneiders W, Reinstorf A, Biewener A, Serra A, Grass R, Kinscher M, Heineck J, Rehberg S, Zwipp H, Rammelt S. Journal of Orthopaedic Research. 2009;27:15–21. doi: 10.1002/jor.20719. [DOI] [PubMed] [Google Scholar]
- 42.Dunham J. In: Bone, Volume 5: Fracture Repair and Regeneration. Brian K, editor. Boca Raton, FL: Hall, CRC Press Inc.; 1992. [Google Scholar]
- 43.Horkay F, Burchard W, Geissler E, Hecht AM. Macromolecules. 1993;26:1296–1303. [Google Scholar]
- 44.Roughley PJ, White RJ. The Journal of Biological Chemistry. 1980;255:217–224. [PubMed] [Google Scholar]
- 45.Lauder RM, Huckerby TN, Brown GM, Bayliss MT, Nieduszynski IA. Biochem. J. 2001;358:523–528. doi: 10.1042/0264-6021:3580523. [DOI] [PMC free article] [PubMed] [Google Scholar]
- 46.Schinagl RM, Gurskis D, Chen AC, Sah RL. Journal of Orthopaedic Research. 1997;15:499–506. doi: 10.1002/jor.1100150404. [DOI] [PubMed] [Google Scholar]
- 47.Horkay F, Burchard W, Hecht AM, Geissler E. Macromolecules. 1993;26:3375–3380. [Google Scholar]
- 48.Geissler E, Horkay F, Hecht AM. J. Chem. Phys. 1994;100:8418–8424. [Google Scholar]
- 49.Horkay F, Hecht AM, Geissler E. Macromolecules. 1998;31:8851–8856. [Google Scholar]
- 50.Landau LD, Lifschitz EM. Statistical Physics. 2nd Edition. Oxford: Pergamon Press; 1969. [Google Scholar]
- 51.Berne R, Pecora R. Dynamic Light Scattering. London: Academic Press; 1976. [Google Scholar]


