

Abstract
High-dimensional ‘-omics’ profiling provides a detailed molecular view of individual cancers; however, understanding the mechanisms by which tumors evade cellular defenses requires deep knowledge of the underlying cellular pathways within each cancer sample. We extended the PARADIGM algorithm (Vaske et al., 2010, Bioinformatics, 26, i237–i245), a pathway analysis method for combining multiple ‘-omics’ data types, to learn the strength and direction of 9139 gene and protein interactions curated from the literature. Using genomic and mRNA expression data from 1936 samples in The Cancer Genome Atlas (TCGA) cohort, we learned interactions that provided support for and relative strength of 7138 (78%) of the curated links. Gene set enrichment found that genes involved in the strongest interactions were significantly enriched for transcriptional regulation, apoptosis, cell cycle regulation and response to tumor cells. Within the TCGA breast cancer cohort, we assessed different interaction strengths between breast cancer subtypes, and found interactions associated with the MYC pathway and the ER alpha network to be among the most differential between basal and luminal A subtypes. PARADIGM with the Naive Bayesian assumption produced gene activity predictions that, when clustered, found groups of patients with better separation in survival than both the original version of PARADIGM and a version without the assumption. We found that this Naive Bayes assumption was valid for the vast majority of co-regulators, indicating that most co-regulators act independently on their shared target.
Availability: http://paradigm.five3genomics.com
Contact: charlie@five3genomics.com
Supplementary information: Supplementary data are available at Bioinformatics online.
1 INTRODUCTION
High-throughput genomic technologies have created increasingly larger sets of data capturing the molecular status of cells, and these advances have had great impact in the identification and understanding of the cellular mechanisms altered in cancer. Identification of key targets commonly altered within specific tumors has enabled the creation of >40 targeted therapies over the past 20 years; however, the response rate of many of these drugs is still <50%, which highlights our incomplete understanding of the pathways around these drugs (Park et al., 2008). An example of such a resistance mechanism is activation of the RAS pathway in EGFR altered colon cancer tumors, where mutated KRAS constitutively activates the RAS cascade offering growth signals independently of the EGFR pathway, rendering EGFR blocking therapies such as cetuximab ineffective (Karapetis et al., 2008). By obtaining a more complete understanding of the key routes through which oncogenic signals travel within the cellular signaling networks, it should be possible to predict new druggable targets and identify escape routes through which tumors can evade existing treatments.
Approaches for integrating -omics data at the level of pathways have been increasingly popular in the last few years, with algorithms such as GSEA (Subramanian et al., 2005), SPIA (Tarca et al., 2009) and PathOlogist (Efroni et al., 2007) all capable of successfully identifying altered pathways of interest given pathways curated from literature (Varadan et al., 2012). Another approach has constructed causal graphs from curated interactions in literature and used these graphs to explain expression profiles (Chindelevitch et al., 2012). Algorithms such as ARACNE (Margolin et al., 2006), MINDy (Bansal and Califano, 2012) and CONEXIC (Akavia et al., 2010) take in gene transcriptional information (and copy-number, in the case of CONEXIC) to identify likely transcriptional drivers across a set of cancer samples; however, these approaches do not attempt to group drivers into functional networks identifying singular targets of interest (Eifert and Powers, 2012). Some newer pathway algorithms such as NetBox (Cerami et al., 2010) and Mutual Exclusivity Modules in Cancer (MEMo) (Ciriello et al., 2012) attempt to solve the problem of data integration in cancer to identify networks across multiple data types that are key to the oncogenic potential of samples. GIENA (Liu et al., 2012) looks for dysregulated gene interactions within a single biological pathway but does not take in to account the topology of the pathway or prior knowledge about the direction or nature of the interactions (Faith et al., 2007). Probabilistic graphical models have been used extensively in network analysis with landmark uses in the form of Bayesian Networks (Segal et al., 2003) and Markov Random Fields (Letovsky and Kasif, 2003). Several methods have successfully learned interactions from data through many different means, including relevance networks (Faith et al., 2007). Our algorithm, PARADIGM (Pathway Recognition Algorithm using Data Integration on Genomic Models) (Vaske et al., 2010), uses a probabilistic graphical model to integrate multiple genomic data types on curated pathway databases and is unique for its per-sample approach that allows individual samples to be assessed alone or within the context of a cohort of interest.
Learning sensible parameters for gene interactions is essential for PARADIGM to infer activities within each sample. In the original implementation of PARADIGM, expectation–maximization (EM) parameter learning was only performed by default on observational data parameters, as the limited size of available datasets prevented robust estimation of interaction parameters. When using a standard conditional probability table with discrete variables, the size of the table, and therefore the number of parameters, grows exponentially with the number of regulators, presenting additional challenges to efficient estimation of interaction parameters. However, by assuming a conditional independence of the regulators, we can replace the conditional probability table with a product of independent regulatory factors, and the number of parameters grows linearly with the number of regulators.
Examination of statistics related to regulatory links, rather than individual gene activities, is a view related (but not directly correlated) to that which is normally examined in high-throughput studies. By identifying regulatory links that have significantly different usage distributions within a phenotype of interest in the cohort, we can begin to examine how different regulators within a network might produce similar cellular phenotypes despite using entirely different pathways to accomplish them. Additionally, these learned parameters can then be used as the basis for statistical tests to establish how well individual samples or subsets of the cohort follow the distribution of learned parameter patterns for each regulatory node. This article describes in detail this new approach and shows the overall improvement and additional analysis capabilities when applied across the TCGA data.
2 METHODS
PARADIGM represents the states of biological molecules—e.g. proteins, mRNAs, complexes and small biomolecules—from a tumor sample as variables in a probabilistic graphical model. For every gene, we use variables for the genome copy number, mRNA and protein, and additionally a non-physical variable that corresponds to biological activity of a gene, as annotated in a pathway, and which may be regulated by posttranslational modification of the protein. Additionally, there are variables that represent more abstract states, such as apoptosis, that are commonly annotated in pathways.
Causal interactions that change the state of molecules—e.g. gene transcriptional regulation, protein phosphorylation and complex formation—are represented as directed edges from the regulating variable to the regulated variable. For each variable Y in the probabilistic graph, we introduce a factor into the joint probability model relating the state of the variable to the state of all its regulators: 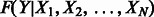 , where X1 through XN are the variables that regulate Y. This factor is a conditional probability table: for each setting of
  ,
,  . Observations of individual variables, such as the genome copy number or gene expression, are modeled as separate variables, connected to the latent variable by a factor
  , also a conditional probability table. The full joint probability state is then:
| (1) |
where Z is a normalization constant required due to regulatory cycles in the pathway.
Given observations for a sample, we solve for marginal distribution of each unobserved variable, using the loopy belief propagation implementation in libDAI (Mooij, 2010) with inference performed in the probability space (as opposed to log space), a convergence tolerance of  and with the SEQFIX update schedule. The parameters for all F functions are learned via expectation maximization in libDAI, stopping when the ratio of successive log-likelihoods is <
 .
.
In this work, we have introduced new variables into each gene’s central dogma that correspond to the transcriptional, translational and protein regulation states of each gene, as shown in Figure 1A. This central dogma means that each protein-coding gene will have identical central dogma structure, and therefore we are able to share parameters between all genes. The unique regulatory program is then modeled only in the transcription, translation and protein regulation variables for each gene.
Fig. 1.
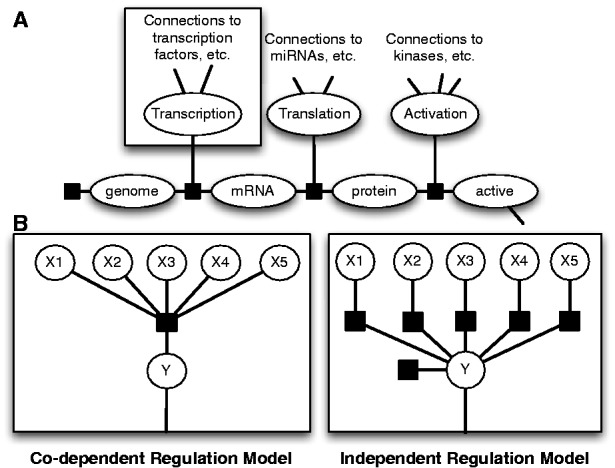
Factor graph structures in PARADIGM. (A) Central dogma structure shared by all protein coding genes. (B) Alternative regulation models for the transcription, translation and activation nodes. In the Co-dependent Regulation Model, we learn a full conditional probability table of the child given the parents, while in the Independent Regulation Model, we learn conditional probabilities of individual links and use a Naive Bayes assumption to calculate the probability of the child node given the parents
Regulation models
We extended PARADIGM by altering how regulation nodes are handled by the algorithm. To construct a factor graph and allow for comparison between many types of data, PARADIGM discretizes the input data to down, up or normal relative to some control. Regulation nodes collect activity signals of all of the genes involved in regulation of a given gene at some point along the path from DNA to active protein. These signals are collected in a single variable which connects to a gene’s central dogma structure through a factor. Under the original model, regulation nodes would simply take a vote of incoming signals to decide if an activation or inhibition signal was passed along. In this new version, we learn the likelihood of each setting of the child variable  being passed given the setting of the parent nodes
  . In this article, we contrast both the co-dependent and independent regulation models shown in Figure 1B. With the co-dependent regulation model, this probability is stored directly as a parameter in a conditional probability table for all possible settings of the parents and child. In contrast, with the independent regulation model, we use P(Y) and
  as parameters and simply calculate the product of the parameters to find this probability:
| (2) |
where Z is a normalizing constant that corresponds to  . To initialize the parameters for the independent regulation model, we give P(Y) an equal probability of down, up or normal, and we set the initial probability for
  based on the annotation of the link in the pathway. For links labeled as activators
 and for inhibitors
 with all the probabilities of all other settings set to 0.1. We also performed tests using a uniform distribution across all settings to test the importance of using this prior knowledge from the pathway.
We use the same simple voting procedure that was originally used in PARADIGM as the initial parameters for EM learning in the co-dependent regulation model. We use  so 99.9% of the probability is placed in the child state that wins the vote and 0.05% is placed in the other states as the initial likelihoods.
An additional minor change to the original PARADIGM algorithm is that we now allow ‘activation’ regulation of complexes and gene families between the protein and active states. Specifically, each family and complex is now modeled by a trio of variables: family/complex, regulation and active, connected with a single factor 
 . Regulators of the family or complex are connected to the active variable, with either the co-dependent or independent regulation model. Components of the family or complex are connected to the family/complex variable, using either a noisy-min or noisy-max factor, with
  . Only the noisy-min or noisy-max factor was used in earlier iterations of PARADIGM.
Regulation statistics
We use G-tests to determine the significance of the dependence between parents and children of regulatory links (3) as well as the significance of the conditional dependence between parents given a child distribution (4):
 |
(3) |
| (4) |
The G-test follows the  distribution, so we can find P-values using
  distributions with 4 and 12 degrees of freedom for the parent–child test and the parent–parent test, respectively. P-values are adjusted for false discovery rate (FDR) and links with adjusted P < 0.05 are considered significant.
Although the G-test (which is proportional to the mutual information) tells us how strong an interaction is, it doesn’t give us details about the sign of the interaction (i.e. activation is a positive interaction and inhibition is a negative interaction). To get these details, we calculated both the Pearson correlation between the parent and child, and the weighted pointwise mutual information, or WPMI (5) (Raina et al., 2006) at all possible settings of parent and child. Correlation was calculated using the joint distribution  , and significance was calculated using the Fisher transformation. Correlation between two parents given the child was also calculated to determine if the three nodes formed a coherent or incoherent feed forward loop.
To compare G-test results between groups, we took the differences of the ranks of the G statistic in each group. The significance of this statistic was calculated by performing a permutation test with 5000 random permutations of the group membership and then adjusting for FDR. For differences greater than any of those observed in the permutations, the lowest possible P-value was used as an upper bound.
| (5) |
The WPMI is simply each individual element of the G-score sum. We arrange the vector of 9 WPMI values as an easy to interpret heat map.
Ovarian clustering
We used the HOPACH clustering algorithm from Bioconductor (van der Laan and Pollard, 2003; Pollard et al., 2012), which attempts to find the number of clusters that best fits the data. This results in different numbers of clusters for each set of IPLs clustered, so to find clusterings with a consistent number of clusters between all datasets, we collapsed the smallest clusters by reassigning small cluster members to the closest large cluster. We collapsed small clusters in this manner to get a consistent number of clusters across all of our clusterings. This method also served to keep cluster sizes consistent across our comparisons.
2.1 Genomic and pathway data
Genomic and pathway data (Matthews et al., 2009; Schaefer et al., 2009) detailed in Supplement 1.
Set enrichment
We used DAVID (Huang et al., 2008; Sherman et al., 2009) to perform gene set enrichment on the genes involved in interactions learned by PARADIGM. To maximize number of genes recognized by DAVID, we split gene complexes and families into their component genes. Enrichment for genes involved in links was compared to a background of all of the genes in our curated pathway.
Intermediate nodes
A full conditional probability table with N parents will store probabilities for all  possible settings of parents and children. Some central genes in our curated pathway have >30 regulators, so to prevent the size of these tables from becoming prohibitive, we limited the number of parent nodes that could be attached to a child node to 5. For genes regulated by more than five proteins, we added intermediate nodes to the graph to maintain this limit. E.g. a gene with 10 regulators would have two intermediate nodes with five regulators attached to each intermediate node.
Coxnet feature selection
The TCGA cohort was first subset down to the 364 breast cancer samples labeled as ER+ in the associated clinical data. Survival censoring was determined by the Vital Status label and if a patient was not alive the Days to Death data was used, otherwise Days to last known alive (if present) or Days to last follow-up were used. Both IPLs and sample-specific link g-scores were filtered to the top 5% of features by variance, and features were then z-score transformed to normalize variance between the two types of values. The selection was performed by using the cox method in the glmnet package (Friedman et al., 2010; Simon et al., 2011) version 1.9-1 in R version 2.15.2 with a maximum iteration of 100 000 which completed without warnings.
3 RESULTS
We learned regulatory interactions on a dataset of 1936 TCGA tumor samples with gene expression and copy number data, from 11 tissue types. We then assessed interaction significance by a G-test and interaction sign with a correlation value. Of the 9139 interactions in the pathway model that regulate a protein, 7631 (83.5%) were found to be significant at an FDR of 0.05. A principal component analysis (PCA) of the WPMI vectors for each interaction learned across the entire TCGA cohort (Fig. 2) reveals a gradient from strong inhibition to strong activation. K-means clustering of the WPMI vectors found clusters along this gradient representing canonical interaction types ranging from strong activation to strong inhibition. Of 7631 significant links, 78 (1%) were placed in a cluster where the centroid was going the opposite direction of how the link was annotated in the pathway. The variety of WPMI vectors shows that EM was able to learn new interaction regimes that resemble activators and inhibitors as well more complex regulatory patterns.
Fig. 2.

(A) Principal component analysis of regulatory links in the TCGA cohort. Each point is the projection of the 9 WPMI scores for a link onto the top two principal components. The convex hulls show the membership of k-means clustering performed on the (unprojected) WPMI scores, and the cluster numbers are placed at the centroid of each cluster. (B) Cluster membership of significant links labeled as activation and inhibition in the pathway. (C) Heatmaps of the WPMI values of the centroids of the clusters show a range from strong inhibition (1) to strong activation (5)
Using correlation measure (see Section 2), we assessed each interaction as activation or inhibition and compared with the interaction type annotated in the pathway model. There were 7357 links with both significant correlation and g-scores and of those the correlation of 219 links (3%) did not agree with the direction of regulation in the pathway. This leaves 7138 (78%) links that are significant by both tests and agree with the curated links. We also found that that some links had high correlation values but low significance from our g-tests; this usually happened in cases where either the parent or child distribution greatly favored a single state.
We compared these results to what could be found by a straightforward Pearson correlation of gene expression profiles. Because we can not look at expression profiles for families and complexes, we tried two different approaches for this comparison. First, we compared our results to the expression correlation of links not involving complexes or families. Of the links learned by Paradigm, 1197 had significant correlation and g-scores and did not include complexes or families. For 51 of these links (4.3%), the sign of correlation coefficient disagrees with the literature. On the other hand, looking only at gene expression profiles, we found 1058 non-complex non-family links with significant correlation, but 470 (44%) disagreed with the sign of the pathway entry. For our second comparison, we eliminated complexes and families in our pathway by connecting all genes that were components of families and complexes directly to any gene regulated by those families and complexes. This flattening procedure resulted in 200 921 links. We found that 165 258 of these links had significantly correlated gene expression profiles, and that 81 558 of the links (49.4%) had correlation that disagreed with the direction of the link in the pathway. These results indicate that the links learned by paradigm are much more in agreement with the direction of the links in literature than the correlation of gene expression profiles is.
Running the PCA and clustering analysis on only WPMI scores learned from TCGA Ovarian (OV) patients (N = 416) and without complex and family activation regulation produced very similar results to the PCA and cluster centers shown in Figures 2A and C, but found fewer significant links and a higher proportion of links that were annotated as activators, and learned as inhibitors or vice versa (Fig. 3A). When we used a flat initialization of 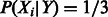 (Fig. 3B), we found that the cluster centers again mapped to a gradient from activation to inhibition, and there were fewer significant links and a higher proportion of link direction disagreements than with initial settings that include direction information.
Fig. 3.
(A) Cluster membership bar plots for WPMI values of significant links learned from the ovarian cohort using an informative prior. (B) Clustering membership when starting with a flat prior. Cluster centers range from strong activation (blue) to strong inhibition (red) as in Figure 2C
We expected the reduction in significant links between the entire TCGA cohort and just OV samples because datasets with a larger number of samples have more evidence to support even subtle interaction trends. The increase in proportion of links in clusters that do not agree with their annotation could be explained by the difference in sample number because any outliers would have less effect on probabilities calculated across the entire dataset. In this setting, however, these changes of link significance or direction are of interest because the TCGA cohort contains many different diseases and tissue types. The pathway does not include details about the tissue or disease in which a given interaction was observed in the literature, so it is possible that in a different tissue or disease state and interaction direction could change either through mutation or some other mechanism. These direction changes are worth studying because they may give us some insight into the mechanism of the disease. Our tests with flat initialization show that even without starting the link parameters in linear activation/inhibition states, a gradient across these linear relationships can be learned. Many of the links that lose significance come from the middle cluster, which has little positive or negative correlation, but we also lose most of the links from the clusters with the strongest activation and inhibition signals. This suggests that by not using prior knowledge about link type, we lost some of our strongest interactions that could have been biologically relevant and could also reduce the quality of our final protein activity predictions.
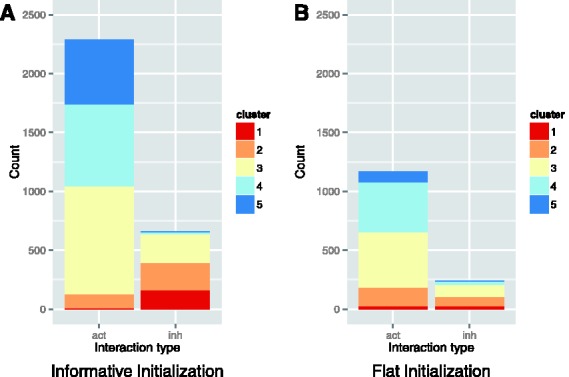
To test the Naive Bayes independence assumption presented in Figure 1, we ran PARADIGM with both the independent and co-dependent regulation models on the TCGA ovarian cancer samples. We tested the conditional independence assumption on the expectations calculated at each EM step of the PARADIGM run (Fig. 4A). At every step of training, fewer co-regulators were found to be dependent upon each other. Because of small feedback loops in the pathway, such as a transcription factor that regulates its own transcription, we expect that the independence assumption will fail in some cases. Additionally, it is quite common for two very similar complexes, differing by only one molecule, to co-regulate the same child node, in which case we also expect the conditional independence test to fail, despite there being little conflict. Consequently, we divide the cases where two co-regulators fail the independence test into ‘coherent’ and ‘incoherent’ classes, as shown in Figure 4B. Additionally, two co-regulators may fail the independence test even if one of the co-regulators is an insignificant regulator, owing to the strength of the other regulator. We therefore also consider the subset of cases where both co-regulators are significant on their own. Our tests show that the initial parameters produced by the weighted vote method cause almost 50% of child nodes to fail the conditional independence test, but as the EM algorithm learns more likely parameter settings, fewer and fewer nodes fail the test. Combining all of our tests shows that only ∼5% of child nodes are likely to have codependent regulators in a meaningful way.
Fig. 4.
(A) Percentage of unique child nodes that fail the following tests at each EM step of a PARADIGM run learning a full conditional probability table: i. a test of the significance of conditional independence of any two parents given the child. ii. test i and at least one of the parents that fails is significantly linked to the child. iii. test i and the failing triplet is incoherent. iv. tests i, ii and iii. (B) Examples of coherent versus incoherent triplets. The arrows correspond to correlation with a pointed head for positive correlation (activation) and a flat head for negative correlation (inhibition). The interactions between parents are not found in the literature, so we use double sided arrows because we can not know the direction of that interaction
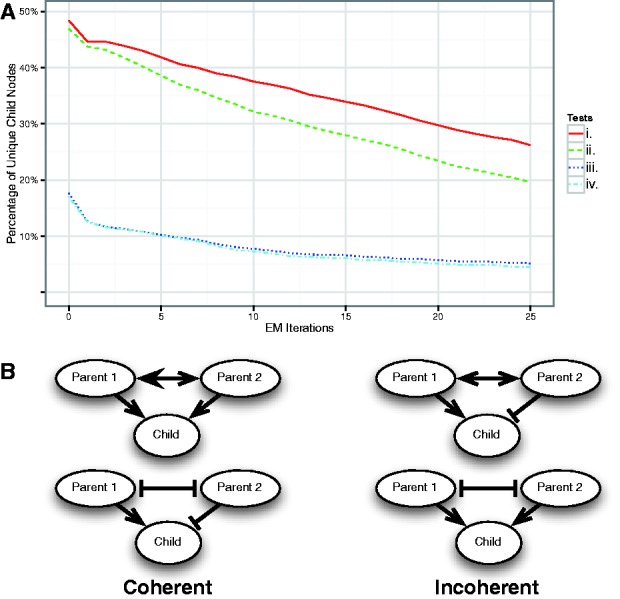
Using the ovarian cancer samples, we clustered the protein activity predictions produced by the original PARADIGM and those from both the co-dependent and independent regulation models. We then performed Kaplan–Meier analysis on these clusters to see whether they had significantly differential survival profiles (Fig. 5). We found that the clusters produced using independent regulation model activity predictions were the most separable by their survival (log-rank P = 2.0 × 10−04). We also performed this test using the independent regulation model with a flat initial setting for the  parameters and found that it performed worse than the original PARADIGM model. Again, this indicates that our learning method requires prior knowledge about the type of interaction that is lost when using a flat initial interaction setting.
Fig. 5.
Kaplan–Meier survival curves of 416 patients in the TCGA ovarian cohort clustered by Integrated Pathway Activity using (A) the original PARADIGM implementation, (B) PARADIGM learning full conditional probability tables of regulatory nodes and (C) PARADIGM learning conditional probability of single links and using a naive Bayes assumption
Figure 6 shows tissue-differential link usage in the most significant by coloring each interaction by its correlation score in a tissue and setting its saturation proportional to its significance. The strongest differential g-scores were seen for links regulated by key cancer genes and complexes, including TP53, MYC/MAX, HIF1A/ARNT, TAp73a, E2F1 and PPARA-RXRA. Of particular interest are the links regulated by PPARA-RXRA primarily different within GBM [brain and KIRC (kidney)] and the TAp73a regulatory links in OV (ovarian) and to a lesser degree in UCEC (uterine endometrioid). Figure 7 shows a plot of the WPMI signals grouped by tissue for the activating links from PPARA-RXRA and TAp73a, where significantly increased weights are found on the activating diagonal, indicating increased use of these links as activators in those tissues. The signature of TAp73 activity potentially indicates a female reproductive or hormonal pattern of pathogenesis associated with p73 expression. TAp73 promotes the expression of cell cycle inhibitors and inducers of apoptosis, one of which is the tumor suppressor BAX, which acts as an inhibitor of the activity of the oncogene BCL2. BCL2 is known to be highly expressed in serous ovarian cancer, and our results here show that although TAp73 is highly expressed and is a strong promoter of BAX expression (and thus BCL2 inhibition), it is nonetheless ineffective in retarding tumorigenesis, suggesting that small molecule inhibition of BCL2 may be equally ineffective. Not surprisingly, single-agent treatments of ovarian cancer with small molecule inhibitors of BCL2, despite high BCL2 expression in serous ovarian cancer, have not succeeded to date (Simonin et al., 2013), suggesting a downstream blockade or attenuation of TAp73-mediated activity in this type of cancer. It is important to note that almost all of the serous ovarian samples here bore mutations in p53, perhaps suggestive of an upstream shunting of tumorigenesis as well that perhaps overcomes TAp73 over-expression or increased activity. Other groups have additionally shown the importance of PPARA-RXRA activity in both GBM and KIRC and their sensitivity to fenofibrate, a PPARA agonist (Giordano and Macaluso, 2012; Ganti et al., 2012). The tissue-specific signals identified through this analysis appear to reiterate recent biological discoveries that appear to be unique when examined in the context of the current TCGA dataset.
Fig. 6.
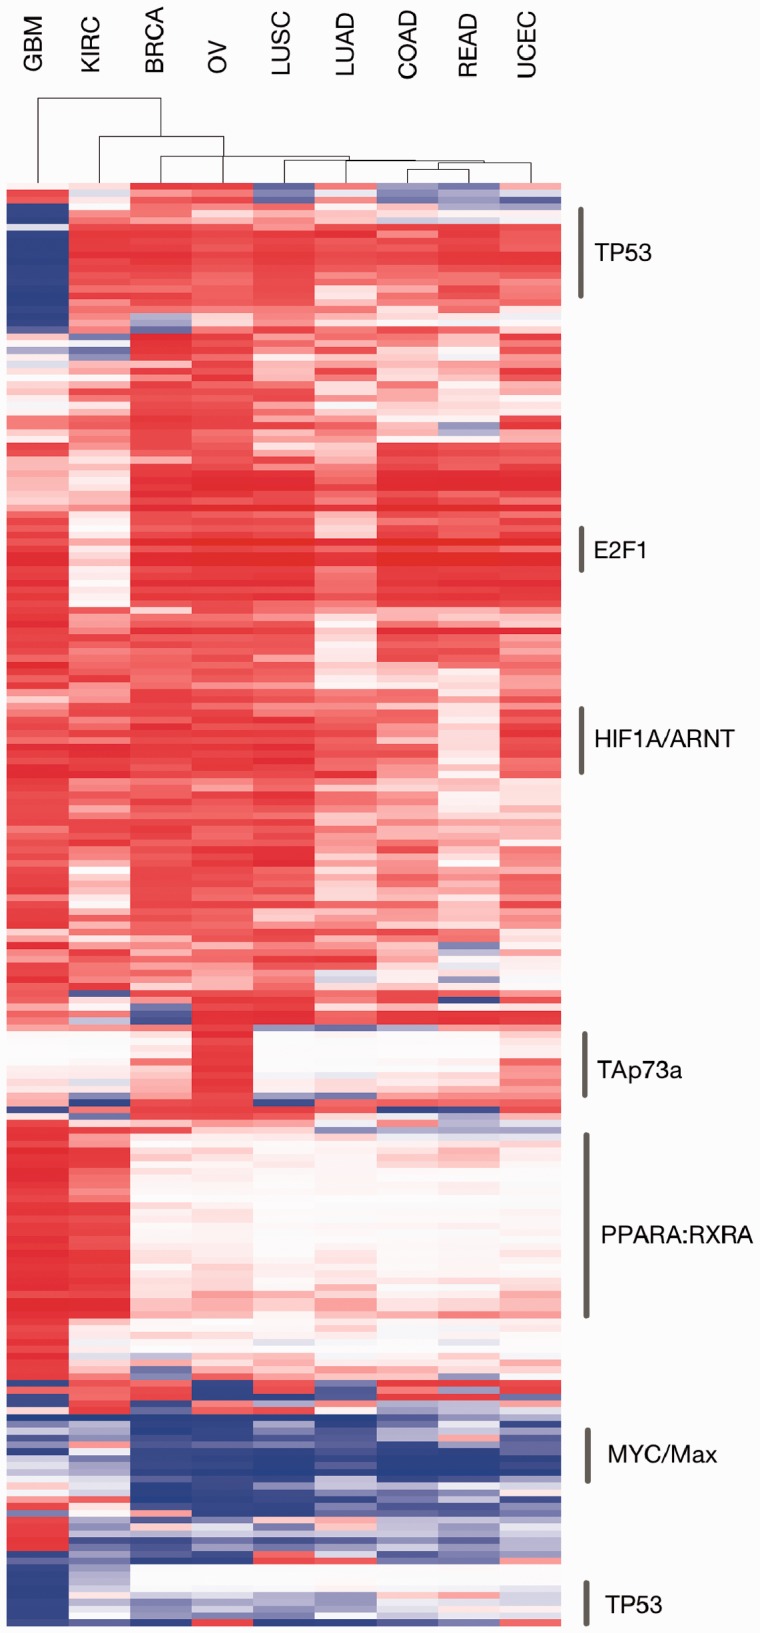
Heatmap of the g-score ranks colored by link correlation, with red tending towards activating and blue tending towards inhibiting. For visualization purposes, interactions were filtered if they had a standard deviation <0.2 across all samples or did not have at least one tissue with a score of ≥0.7, resulting in 211 interactions out of the original 10 307
Fig. 7.

Boxplots of WPMI values across cancer types (A) WPMI values for links with PPARA:RXRA as a parent node. There is a stronger activation signal in GBM and KIRC. (B) WPMI values for links with TAp73a as a parent node, showing activation in OV
The most significant links learned across the entire TCGA cohort (Table 1) are a number of known cancer genes including the forkhead box transcription factor A1, p53 and estrogen receptor alpha. To perform a gene set enrichment with DAVID (Huang et al., 2008; Sherman et al., 2009) on the genes involved in the 50 interactions with the highest G-scores, we replaced families and complexes with their component genes. This produced 112 unique genes that were recognized by DAVID from the top 50 links. These genes were significantly enriched (P < 1e-7) for a number of relevant KEGG terms including ‘pathways in cancer’, ‘apoptosis’, ‘Jak-STAT signaling pathway’ and ‘MAPK signaling pathway’ as well as a number of different cancer type-specific terms. We compared this result with what could be found by only looking at gene expression correlation of the genes that are linked in our pathway. We needed to take the top 200 gene expression pairs by Pearson correlation from the flattened pathway to get a set of unique genes of comparable size (N = 119) to the set produced by Paradigm. Although both gene sets produced similar enrichments for Gene Ontology terms for biological processes (GOTERM_BP_FAT), we found far fewer KEGG terms by using gene expression correlation than by using our learned links (20 versus 46 at FDR < 0.05) and the FDR. The KEGG terms that overlapped between the two sets had a lower FDR in the PARADIGM set. To ensure that the flattening of families and complexes in the pathway was not biasing these results, we repeated this analysis for non-family, non-complex links in the pathway only and found similar results (20 KEGG terms found for Paradigm links versus 3 for expression correlation at FDR < 0.05).
Table 1.
Regulatory links with the highest g test score across the entire TCGA cohort
| Parent | Child | g score | Direction |
|---|---|---|---|
| FOXA1 | SFTPA (family):txreg | 3247.197 |  |
| HNF1A | HNF4A (family):txreg | 3208.440 |  |
| GATA1 | alpha-globin (family):txreg | 3065.885 |  |
| ONECUT1 | HNF1B (family):txreg | 3008.945 |  |
| p53 tetramer (complex) | MDM2:txrega | 2931.148 |  |
| KLF4 | Preproghrelin (family) :txreg | 2914.620 |  |
| PDX1 | NR5A2 (family):txreg | 2872.275 |  |
| p53 tetramer (complex) | SFN:txrega | 2811.958 |  |
| ER alpha homodimer (complex) | alpha tubulin (family):txreg | 2781.369 |  |
| FOXM1 | CENPA:txreg | 2739.028 |  |
P-values for all link are less than 1e-323. aIntermediate node.
We compared the strength of links between subtypes of breast cancer to get some insight into the regulatory differences between the subtypes (Table 2). This comparison as well as other comparisons between tissues never found links that completely switched direction from activation to inhibition. Instead, we often observed that links turned off or on (e.g. changed from a strong activator to neutral). Because direction rarely changes, we found it informative to simply look at the differences between the G-score significance of links. We used the rank difference of the G-scores to allow us to compare between groups so as to adjust for the G-score’s dependence on sample size. Many of the links with the highest rank differences had the same parents, so Table 2 shows the links with the highest rank difference on a per parent basis and include the full table as Supplement 2. In 9 of the top 10 links that were stronger in Basal tumors, HIF1A was the parent, and the top four links stronger in Luminal A tumors had CEBPB as a parent.
Table 2.
Regulatory links with adjusted P < 0.05 in either Basal (N = 92) or Luminal A (N = 218) breast cancer tumors, and the highest rank differences in G-scores per parent
| Parent | Child | P-value Basal | P-value Luminal | Rank difference | Direction |
|---|---|---|---|---|---|
| HIF1A/ARNT (complex) | HK1 | 1.61e-3 | 0.834 | 7826 |  |
| E2F3/DP/TFE3 (complex) | RRM1 | 9.20e-3 | 0.854 | 7632 |  |
| MYB | PPP3CA | 3.09e-2 | 0.493 | 5203 |  |
| E2F1/DP (complex) | WASF1 | 3.48e-2 | 0.459 | 4924 |  |
| E2F1/DP/PCAF (complex) | TP73 | 6.59e-3 | 0.343 | 4225 |  |
| CEBPB | HSP90B1 | 0.879 | 9.65e-3 | 6275 |  |
| JUN | AChR (family) | 0.833 | 0.0256 | 4742 |  |
| SP1 | CDKN2C | 0.771 | 5.94e-4 | 4700 | Not significant |
| DNA damage (abstract) | SERPINB5 | 0.808 | 0.0300 | 4264 |  |
| LEF1/beta catenin/PITX2 (complex) | LEF1 | 0.775 | 9.18e-3 | 4250 |  |
Note: Adjusted P of all rank differences in this table was < 4.8e-4. All edges were annotated as transcriptional activators. Full table is Supplementary Material.
To identify clinically relevant activities and link strengths, we examined the estrogen receptor-postiive (ER+) breast cancer patients. We performed a regularized Cox regression of TCGA survival data on both link g-scores and IPLs to identify the optimal number of features to best split the cohort. At the minimum lambda, the coxnet model contained nine features that best split the ER + breast cancer patients (Table 3). Four of the nine features were link g-scores, which illustrates the independent utility of these scores as potential prognostic markers. Additional work is needed to validate this model in an independent dataset before it can be considered a true prognostic signature in ER + patients.
Table 3.
Pathway features (edges and nodes) associated with survival in ER + breast cancer patients
| Feature | Cox hazard coefficient |
|---|---|
GLI2A  GLI1 GLI1 |
0.08484 |
HIF1A/ARNT (complex)  CP CP |
0.07835 |
MYB  CEBPB CEBPB |
0.00462 |
E2F1/DP (complex)  SIRT1 SIRT1 |
−0.00072 |
| p300/CBP (complex) | −0.00204 |
| SDC3 | −0.04840 |
| p300/CBP/RELA/p50 (complex) | −0.11126 |
| TAp73a (tetramer) (complex) | −0.11301 |
| TCF1E/beta catenin (complex) | −0.16129 |
Note: Edges are identified by  , and all edges found are annotated as transcriptional activators in the pathway.
CEBPB and HIF1A/ARNT appeared in both Tables 2 and 3. CEBPB is a transcription factor that has been associated with tumor progression, poor prognosis and ER negative status (Milde-Langosch et al., 2003). Furthermore, over expression of HSP90B1, a heat shock protein regulated by CEBPB and found in Table 2, has been associated with distant metastases and decreased overall survival in breast cancer patients with otherwise good prognoses (Cawthorn et al., 2012). HSP90B1 has undergone clinical trials as an immunotherapy for melanoma under the name vitespen (Testori et al., 2008). HIF1A/ARNT overexpression is clinically relevant in ER and PR
 breast cancer, where splice variants have been associated with reduced metastasis-free survival (Dales et al., 2010). Because Basal tumors are generally ER
 , and Luminal A tumors are generally ER
 , the differential link strength could be due to increased occurrence of the splice variant in the Basal tumors. The top two links by G-score rank difference between Basal and Luminal are HIF1A/ARNT activating HK1 and HK2 (hexokinases), HK2 is involved in glucose metabolism and apoptosis, and has been associated with brain metastases from breast cancers as well as poor survival post craniotomy (Palmieri et al., 2009). These findings indicate that we are able to find links that are relevant both by contrasting between tumor subtypes and by searching for links within a subtype that are predictive of a clinical variable.
4 DISCUSSION
We have shown that by extending PARADIGM, we can combine multiple -omics data to learn the strength and sign of regulatory interactions curated from the literature. The assumption of conditional independence enables a reduction in model complexity allows efficient estimation of regulatory parameters using existing datasets, and further, and we show that the independence assumption is valid for the vast majority of regulatory programs. In addition, where the independence assumption does not hold, future extensions would be able to replace the independent factors with more complex factors that properly model a co-dependent regulatory program. When these learned parameters are applied, biological insight can be gained from simply looking at the strongest links across a cohort of samples or by looking at how interactions change between phenotypes of interest. This regulatory learning improved PARADIGM’s overall protein activity predictions, resulting in better separation of survival across clusters of ovarian cancer patients.
We find that though cancer subtypes use different interactions, an interaction generally has a consistent sign whenever it is used in a particular tumor. This indicates that our current level of knowledge of cofactors as able to account for the cases where a gene switches the direction of activity. Further, the concordance of our learned interaction sign and the interaction sign in databases, despite the various ways that interaction sign is annotated in the BioPAX language across pathway databases, indicates that pathway databases have successfully and faithfully cataloged of thousands of wetlab experiments in the literature.
The independence of co-regulators provides computational benefits for model inference and parameter learning, and also aids in model interpretation. The factorability of regulation models corresponds to log-linearity. However, a great number of regulators in the model are complexes, and the complex formation factor is a non-linear noisy-MAX function. Thus, regulation nonlinearity can still be encoded in the factor graph by representing physical complexes. This lends plausibility to a physical interpretation of most regulation links in the pathway: competitive binding of independent regulators should combine linearly, as long as the truly independent physical entities have been captured as complexes. If this physical interpretation is true, then there should be a correspondence between relative strengths of measured physical binding constants and PARADIGM interaction scores. In cases where the independence assumption does not hold, it is likely that there is a latent co-factor, which could be modeled by replacing  with a factor such as
  .
.
Supplementary Material
ACKNOWLEDGMENTS
We wish to thank David Haussler and Josh Stuart for their encouragement and direction on this project.
Funding: A.J.S. was supported by NIH T32 training grant T32 EB009403 as part of the HHMI-NBIB Interfaces Initiatives.
Conflict of Interest: A.J.S., S.C.B. and C.J.V. were employees of Five3 Genomics LLC during the course of this work. S.R. and P.S.-S. were employees of NantOmics, LLC during this work. S.C.B, C.J.V. and P.S.-S. are equity holders in Five3 Genomics, and P.S.-S. is an equity holder in NantOmics.
REFERENCES
- Akavia UD, et al. An integrated approach to uncover drivers of cancer. Cell. 2010;143:1005–1017. doi: 10.1016/j.cell.2010.11.013. [DOI] [PMC free article] [PubMed] [Google Scholar]
- Bansal M, Califano A. Genome-wide dissection of posttranscriptional and posttranslational interactions. Methods Mol. Biol. 2012;786:131–149. doi: 10.1007/978-1-61779-292-2_8. [DOI] [PubMed] [Google Scholar]
- Cawthorn TR, et al. Proteomic analyses reveal high expression of decorin and endoplasmin (hsp90b1) are associated with breast cancer metastasis and decreased survival. PLoS One. 2012;7:e30992. doi: 10.1371/journal.pone.0030992. [DOI] [PMC free article] [PubMed] [Google Scholar]
- Cerami E, et al. Automated network analysis identifies core pathways in glioblastoma. PLoS One. 2010;5:e8918. doi: 10.1371/journal.pone.0008918. [DOI] [PMC free article] [PubMed] [Google Scholar]
- Chindelevitch L, et al. Causal reasoning on biological networks: interpreting transcriptional changes. Bioinformatics. 2012;28:1114–1121. doi: 10.1093/bioinformatics/bts090. [DOI] [PubMed] [Google Scholar]
- Ciriello G, et al. Mutual exclusivity analysis identifies oncogenic network modules. Genome Res. 2012;22:398–406. doi: 10.1101/gr.125567.111. [DOI] [PMC free article] [PubMed] [Google Scholar]
- Dales J-P, et al. Hypoxia inducible factor 1α gene (hif-1α) splice variants: potential prognostic biomarkers in breast cancer. BMC Med. 2010;8:44. doi: 10.1186/1741-7015-8-44. [DOI] [PMC free article] [PubMed] [Google Scholar]
- Efroni S. Identification of key processes underlying cancer phenotypes using biologic pathway analysis. PLoS One. 2007;2:e425. doi: 10.1371/journal.pone.0000425. [DOI] [PMC free article] [PubMed] [Google Scholar]
- Eifert C, Powers RS. From cancer genomes to oncogenic drivers, tumour dependencies and therapeutic targets. Nat. Rev. Cancer. 2012;12:572–578. doi: 10.1038/nrc3299. [DOI] [PubMed] [Google Scholar]
- Faith JJ, et al. Large-scale mapping and validation of Escherichia coli transcriptional regulation from a compendium of expression profiles. PLoS Biol. 2007;5:e8. doi: 10.1371/journal.pbio.0050008. [DOI] [PMC free article] [PubMed] [Google Scholar]
- Friedman J, et al. Regularization paths for generalized linear models via coordinate descent. J. Stat. Softw. 2010;33:1–22. [PMC free article] [PubMed] [Google Scholar]
- Ganti S, et al. Kidney tumor biomarkers revealed by simultaneous multiple matrix metabolomics analysis. Cancer Res. 2012;72:3471–3479. doi: 10.1158/0008-5472.CAN-11-3105. [DOI] [PMC free article] [PubMed] [Google Scholar]
- Giordano A, Macaluso M. Fenofibrate triggers apoptosis of glioblastoma cells in vitro: new insights for therapy. Cell Cycle. 2012;11:3154. doi: 10.4161/cc.21719. [DOI] [PMC free article] [PubMed] [Google Scholar]
- Huang DW, et al. Systematic and integrative analysis of large gene lists using David bioinformatics resources. Nat. Protoc. 2008;4:44–57. doi: 10.1038/nprot.2008.211. [DOI] [PubMed] [Google Scholar]
- Karapetis CS, et al. K-ras mutations and benefit from cetuximab in advanced colorectal cancer. New Engl. J. Med. 2008;359:1757–1765. doi: 10.1056/NEJMoa0804385. [DOI] [PubMed] [Google Scholar]
- Letovsky S, Kasif S. Predicting protein function from protein/protein interaction data: a probabilistic approach. Bioinformatics. 2003;19(Suppl. 1):i197–i204. doi: 10.1093/bioinformatics/btg1026. [DOI] [PubMed] [Google Scholar]
- Liu Y, et al. Gene interaction enrichment and network analysis to identify dysregulated pathways and their interactions in complex diseases. BMC Syst. Biol. 2012;6:65. doi: 10.1186/1752-0509-6-65. [DOI] [PMC free article] [PubMed] [Google Scholar]
- Margolin AA, et al. ARACNE: an algorithm for the reconstruction of gene regulatory networks in a mammalian cellular context. BMC Bioinformatics. 2006;7(Suppl. 1):S7. doi: 10.1186/1471-2105-7-S1-S7. [DOI] [PMC free article] [PubMed] [Google Scholar]
- Matthews L, et al. Reactome knowledgebase of human biological pathways and processes. Nucleic Acids Res. 2009;37:D619–D22. doi: 10.1093/nar/gkn863. [DOI] [PMC free article] [PubMed] [Google Scholar]
- Milde-Langosch K, et al. Expression of the CCAAT/enhancer-binding proteins C/EBPalpha, C/EBPbeta and C/EBPdelta in breast cancer: correlations with clinicopathologic parameters and cell-cycle regulatory proteins. Breast Cancer Res. Treat. 2003;79:175–185. doi: 10.1023/a:1023929504884. [DOI] [PubMed] [Google Scholar]
- Mooij JM. libDAI: a free and open source C++ library for discrete approximate inference in graphical models. J. Mach. Learn. Res. 2010;11:2169–2173. [Google Scholar]
- Palmieri D, et al. Analyses of resected human brain metastases of breast cancer reveal the association between up-regulation of hexokinase 2 and poor prognosis. Mol. Cancer Res. 2009;7:1438–1445. doi: 10.1158/1541-7786.MCR-09-0234. [DOI] [PMC free article] [PubMed] [Google Scholar]
- Park JW, et al. Unraveling the biologic and clinical complexities of HER2. Clin. Breast Cancer. 2008;8:392–401. doi: 10.3816/CBC.2008.n.047. [DOI] [PubMed] [Google Scholar]
- Pollard KS, et al. hopach: Hierarchical Ordered Partitioning and Collapsing Hybrid (HOPACH) 2012. [R package insert] version 2.10.0, Bioconductor http://www.bioconductor.org (25 May 2013, date last accessed) [Google Scholar]
- Raina R, et al. 2006. Constructing informative priors using transfer learning. In: Proceedings of the 23rd International Conference on Machine Learning. ACM, New York, NY, USA, pp. 713–720. [Google Scholar]
- Schaefer CF, et al. PID: the Pathway Interaction Database. Nucleic Acids Res. 2009;37(Database issue):D674–D679. doi: 10.1093/nar/gkn653. [DOI] [PMC free article] [PubMed] [Google Scholar]
- Segal E, et al. Module networks: identifying regulatory modules and their condition-specific regulators from gene expression data. Nat. Genet. 2003;34:166–176. doi: 10.1038/ng1165. [DOI] [PubMed] [Google Scholar]
- Sherman B, et al. Bioinformatics enrichment tools: paths toward the comprehensive functional analysis of large gene lists. Nucleic Acids Res. 2009;37:1–13. doi: 10.1093/nar/gkn923. [DOI] [PMC free article] [PubMed] [Google Scholar]
- Simon N, et al. Regularization paths for Cox’s proportional hazards model via coordinate descent. J. Stat. Soft. 2011;39:1–13. doi: 10.18637/jss.v039.i05. [DOI] [PMC free article] [PubMed] [Google Scholar]
- Simonin K, et al. Platinum compounds sensitize ovarian carcinoma cells to ABT-737 by modulation of the Mcl-1/Noxa axis. Apoptosis. 2013;18:492–508. doi: 10.1007/s10495-012-0799-x. [DOI] [PubMed] [Google Scholar]
- Subramanian A, et al. Gene set enrichment analysis: a knowledge-based approach for interpreting genome-wide expression profiles. Proc. Natl Acad. Sci. USA. 2005;102:15545–15550. doi: 10.1073/pnas.0506580102. [DOI] [PMC free article] [PubMed] [Google Scholar]
- Tarca AL, et al. A novel signaling pathway impact analysis. Bioinformatics. 2009;25:75–82. doi: 10.1093/bioinformatics/btn577. [DOI] [PMC free article] [PubMed] [Google Scholar]
- Testori A, et al. Phase III comparison of vitespen, an autologous tumor-derived heat shock protein gp96 peptide complex vaccine, with physician’s choice of treatment for stage IV melanoma: The C-100-21 Study Group. J. Clin. Oncol. 2008;26:955–962. doi: 10.1200/JCO.2007.11.9941. [DOI] [PubMed] [Google Scholar]
- van der Laan MJ, Pollard KS. A new algorithm for hybrid hierarchical clustering with visualization and the bootstrap. J. Stat. Plan. Inference. 2003;117:275–303. [Google Scholar]
- Varadan V, et al. The integration of biological pathway knowledge in cancer genomics: a review of existing computational approaches. IEEE Signal Process. Mag. 2012;29:35–50. [Google Scholar]
- Vaske C, et al. Inference of patient-specific pathway activities from multi-dimensional cancer genomics data using paradigm. Bioinformatics. 2010;26:i237–i245. doi: 10.1093/bioinformatics/btq182. [DOI] [PMC free article] [PubMed] [Google Scholar]
Associated Data
This section collects any data citations, data availability statements, or supplementary materials included in this article.