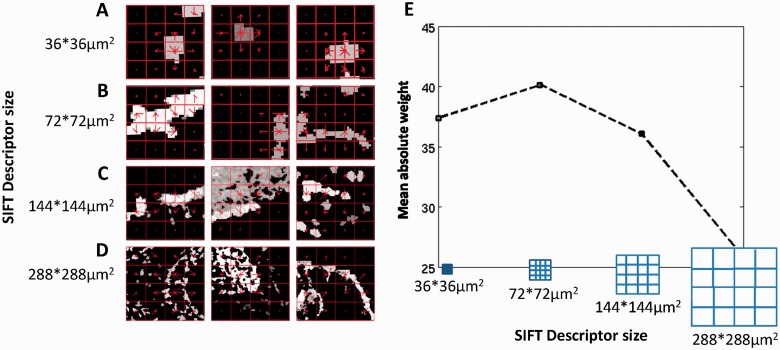
Fig. 5.
Representing ISH images with visual words. (A, B, C, D) The three visual words with highest absolute weight (averaged over all categories) at each scale. The SIFT descriptors (red grid) are plotted on top of each panel. The histogram of oriented gradients used in the SIFT descriptor is plotted in the center of each element of the grid,as a set of red lines, where the length of the line correspond to the magnitude of the gradient in its direction. (E) Mean absolute weight for the four scales of visual words calculated over classifiers for all categories

