Abstract
Summary: Pairs of individuals from a study cohort will often share long-range haplotypes identical-by-descent. Such haplotypes are transmitted from common ancestors that lived tens to hundreds of generations in the past, and they can now be efficiently detected in high-resolution genomic datasets, providing a novel source of information in several domains of genetic analysis. Recently, haplotype sharing distributions were studied in the context of demographic inference, and they were used to reconstruct recent demographic events in several populations. We here extend the framework to handle demographic models that contain multiple demes interacting through migration. We extensively test our formulation in several demographic scenarios, compare our approach with methods based on ancestry deconvolution and use this method to analyze Masai samples from the HapMap 3 dataset.
Availability: DoRIS, a Java implementation of the proposed method, and its source code are freely available at http://www.cs.columbia.edu/∼pier/doris.
Contact: itsik@cs.columbia.edu
1 INTRODUCTION
Recent advances in high-throughput genomic technologies enable population-wide surveys of genetic variation. Although exacerbating challenges associated with data handling, this increase in volume and resolution had the effect of exposing new genomic features, creating the need for new models and computational tools. Among these new genomic features, identical-by-descent (IBD) haplotypes have recently emerged as a new source of information in several genetic applications, ranging from genotype–phenotype association studies (Browning and Thompson, 2012; Gusev et al., 2011) to the reconstruction of recent familial relationships (Huff et al., 2011; Kirkpatrick et al., 2011), the inference of recent demographic events (Gusev et al., 2012; Palamara et al., 2012) or the study of natural selection (Albrechtsen et al., 2010; Han and Abney, 2012).
IBD segments are co-inherited from recent common ancestors by pairs of individuals and are delimited by historical recombination events. Such recombination events can now be detected in cohorts that have been densely genotyped (although not requiring the availability of full sequences), and several methods have now been developed for efficient IBD detection in large datasets (Browning and Browning, 2011; Gusev et al., 2009). Although shared haplotypes are found to be common even across populations that diverged hundreds of generations ago (Gusev et al., 2012), the average detectable IBD segment is transmitted from shared ancestors that lived tens to a few hundreds of generations before present. Haplotype sharing analysis is, therefore, suitable to reveal the signature of the relatively recent demographic events that followed the agricultural revolution, where most classical methods provide limited insight. Leveraging this property of IBD, several recent surveys relied on shared haplotypes to analyze population demographics (Atzmon et al., 2010; Henn et al., 2012; Lawson and Falush, 2012).
In a recent work (Palamara et al., 2012), we studied several theoretical quantities of IBD haplotypes, as a function of the demographic history of a population. We used the derived framework to infer the demographic history of two populations with different characteristics: (i) a population that underwent substantial recent isolation (Ashkenazi Jews) and (ii) a cohort that deviates from a single population model, with migration across small demes likely playing an important role in shaping recent genomic diversity (Kenian Masai). The analytical models we previously described are limited by the assumption that all the analyzed samples belong to a single population. Although such models can be used to provide insights in cases of extreme historical isolation, fine-scale interactions across populations were frequent in recent history, and the reconstruction of these events is of great interest for genetic-driven investigation of historical events (Henn et al., 2010) and genetic analysis at large.
In this article, we propose an extension of the analytical framework described in Palamara et al. (2012), allowing to explicitly model the presence of multiple populations that interact through migration rates. We test our approach on several synthetic populations with known population size changes and migration rates, finding that our model accurately matches the empirical distributions and provides a novel tool for the inference of recent demographic events that involve multiple interacting demes. We compare our method with existing approaches based on the distribution of migrant tracts obtained through ancestry deconvolution, and we revisit the analysis of the Masai population using the presented formulation.
2 METHODS
2.1 Haplotype sharing and demographic history
Here, we provide a brief summary of the formulation developed in Palamara et al. (2012), and we invite the reader to refer to that article for additional details.
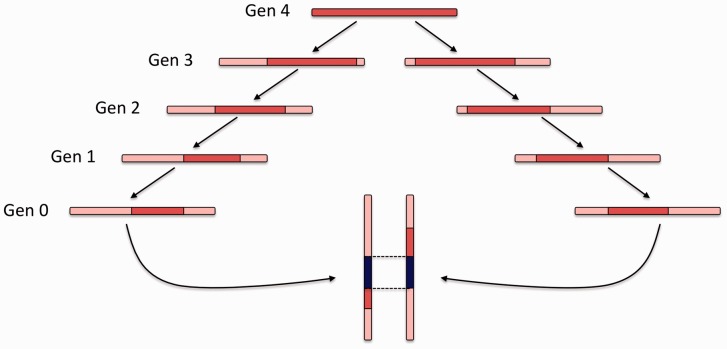
At a chosen genomic site, a pair of modern day individuals from a population will have a common ancestor that lived a number of generations in the past. Such common ancestor transmits several adjacent sites along with the one being considered, in a region that is delimited by any recombination event happening along the lineage between the two individuals on either side of the locus (Fig. 1), and by chromosome boundaries. We define such non-recombinant region as IBD. Recombination shortens IBD segments during meiotic transmission, and the genetic length of shared haplotypes is probabilistically linked to the number of generations separating two individuals from their most recent common ancestor. In addition, standard assumptions of coalescent theory (Kingman, 1982) postulate that when tracing the ancestry of a pair of individuals back in time, the chance of randomly finding their common ancestor is inversely proportional to the effective size of the analyzed population, with a smaller effective population size resulting on average on earlier common ancestors. Combining these principles, the length of IBD segments detected in a cohort of studied individuals can be used to gain insight into the distribution of coalescent times, which in turn can be used to gain insight into the effective population size within and across populations at different time scales.
Fig. 1.
An IBD segment (blue) is co-inherited by two present day individuals from a common ancestor that lived four generations in the past. Recombination shortens the IBD segment, as meiotic events occur along the lineage between the two individuals
In the remainder of this article, a population’s effective population size in a coalescent model will simply be referred to as population size. We represent the demographic history of the studied population via the vector  , which may hold just one parameter in the simplest case of a constant (Wright–Fisher) population, or several parameters in more complex cases (e.g. current population size, ancestral population size and duration of an exponential expansion). The probability of the considered genomic site to be spanned by a shared IBD haplotype of genetic length comprised in the range
  can be expressed as
 |
(1) |
where  , in the reminder simply written
  , represents the probability of finding the common ancestor for the considered site at (continuous) time t in the past, measured in generations;
  , later indicated as
  , represents the probability of a segment spanning the site to have length l after being transmitted for t generations. In this model, population size is allowed to arbitrarily change in time. In the simple case of a Wright–Fisher population of constant size Ne, the coalescence probability is simply
  . Recombination events may happen on either side of the considered locus at an exponential rate that depends on the number of meiotic events in the lineage to a common ancestor.
  , therefore, assumes the form of a sum of two exponential random variables or Erlang-2 distribution:
  (note that length here is expressed in Morgans). Combining these into Equation (1) and integrating, we obtain
| (2) |
or  for the particular case of
  .
.
As shown in Palamara et al. (2012), Equation (2) can be used to obtain a closed form estimator of recent effective population size. Taking the limit of such estimator for  , it assumes the form
 |
(3) |
where  is the average observed fraction of genome shared through segments longer than a length threshold u (here in morgans).
The computation of  allows us to derive several additional theoretical quantities of IBD sharing. Because of the linearity of the expectation operator, the average fraction of genome shared through IBD segments in the length range R is simply
  . The distribution of the length of a randomly sampled segment shared by the pair of individuals is obtained as
  , and it can be used to compute the expected length of a randomly sampled shared segment in the chosen length range, sR. For a region of length γ, a pair of individuals is expected to share
  segments, and the distribution for the number of shared segments can be modeled as a Poisson random variable with the aforementioned expectation. Using this information, an expression for the variance of the fraction of genome shared in an interval R can be computed. Finally, the full probability distribution for the fraction of genome shared by a pair of individuals through segments in the length range R can also be computed using the previously described quantities.
The quantity  is, therefore, central in this formulation, as it allows expressing a number of different measures of IBD sharing as a function of demographic history. Furthermore,
  only depends on
  through
  , the probability of a coalescence event in the demographic scenario
  . If the goal is to infer the demographic parameters in a model comprising multiple populations, we, therefore, need to express the coalescence probability
  , where
  now includes historical size variation for multiple populations and migration rates across them.
2.2 IBD distributions in the presence of migration
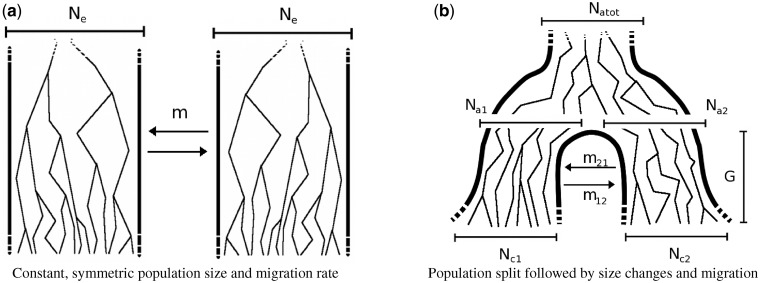
We begin discussing the case of multiple populations referring to a simple scenario, where two populations of constant size Ne exchange individuals at a fixed rate m per individual, per generation (see model in Fig. 2a). We encode this migration rate using the matrix
Fig. 2.
Two demographic models that involve two populations and migration between them. In model (a), the populations have the same constant size Ne, and exchange individuals at the same rate m. In model (b), a population of constant ancestral size Natot splits G generations in the past, resulting in two populations whose sizes independently fluctuate from  and
and  individuals to
  and
and  individuals during G generations. During this period, the populations interact with asymmetric migration rates m12 and m21
We consider two individuals, i and j, each sampled from either population. We trace the ancestors of these individuals at one genomic site and encode their state (in terms of population their ancestors belong to), using a vector of dimensionality 2. If individual i is sampled from population 1 and individual j from population 2, for example, the state at generation 0 is known and we write it as  . If both are sampled from population
  . After t generations (measured in continuous time), the probability that the ancestor of individual i at this genomic location belongs to either population is given by
| (4) |
if individual i was sampled from population 1, or, symmetrically
| (5) |
if it was sampled from population 2. We are interested in expressing the probability of individuals i and j to coalesce at time t. This requires both individuals to be in the same population, in which case coalescence happens at rate  . Formally
  , which in this setting becomes
| (6) |
if  , and
, and
| (7) |
otherwise. To compute  , we plug the coalescence probability in Equation (1). Also, for simplicity, we take
  , obtaining
| (8) |
if  , and
, and
| (9) |
otherwise. Recall that  , which is the expected fraction of genome shared through segments of length between u and v by an individual pair. To infer
  and
and  , we, therefore, consider the observed average fraction of genome shared through IBD segments longer than a threshold u, for all pairs of individuals sampled from the same population or from different populations (which we call
  and
and  , respectively, now omitting the dependence on the length range). We then solve the system obtained by equating
  and
and  to the quantities in (9) and (10), to obtain the estimators
 |
(10) |
A simple generalization of the aforementioned scenario consists in allowing the two considered populations to differ in their effective population sizes,  and
and  . In this scenario, it is still possible to obtain a closed form expression for
  , and a closed form estimator for
  , which are reported in the Appendix.
2.3 The general case
Although the previously discussed case of constant population sizes and migration rates has a simple formulation and can be used to gain initial insight into the recent demography of a study cohort, such population dynamics are oversimplified and generally unrealistic. Luckily, given a few reasonable assumptions, population sizes and migration rates can be allowed to arbitrarily fluctuate in time, still permitting a closed form computation of  .
.
Consider two populations whose sizes at generation g are expressed as  and
and  . The rate at which these two populations exchange individuals can be encoded in a discrete migration matrix
| (11) |
where  represents the probability of an individual migrating from population 1 to population 2 at generation g (backwards in time). After g generations, the probability that the ancestor of individual i at a genomic location belongs to either population is given by the vector
  . Define the matrix
  to be diagonal with
  and
and  as its diagonal elements. The probability of coalescence from generation g − 1 to generation g is then
 |
(12) |
and the probability of the two individuals to coalesce g generations before present is
 |
(13) |
Equation (13) can be used in Equation (1), in its discrete version, to compute
 |
(14) |
Note that Equation (14) is general, and we can allow additional demographic changes to take place. For instance, by setting  and
and  for all
  , we encode a population split that occurred G generations ago. In practice, a pair of populations will have split a number of generations back in time, and it is, therefore, convenient to consider models of the kind depicted in Figure 2b. In this model, a population of constant size Natot splits G generations in the past, forming two populations of size
  and
and  . The size of these two groups then fluctuates in time, to reach a present size of
  and
and  . During their separation, the populations exchange individuals at a rate of m12 and m21 per generation, per individual. Of course, other models can be defined, allowing variable migration rates, and different population size dynamics.
For mathematical convenience, it is safe to assume the ancestral population size becomes constant a number of generations in the past. Models where the ancestral population size (Natot in Fig. 2b) is constant from generation G to infinity allow for a closed form computation of Equation (14), no matter which demographic dynamics take place from generation 0 to G [see Palamara et al. (2012) for this expression]. Furthermore, extremely remote demographic events have negligible impact on shared haplotypes of currently detectable lengths (e.g.  cM).
cM).
2.4 Simulations, ancestry deconvolution and real data
We tested our framework using extensive simulation of realistic chromosomes under several demographic models, using the GENOME coalescent simulator (Liang et al., 2007). For computational convenience, we set the size of the simulator’s non-recombinant segments between 0.01 and 0.025 cM, as specified in Section 3, always using a recombination rate of 1cM/Mb. A modified version of the simulator was used to extract ground truth IBD haplotypes from the simulated genealogies, defined as non-recombinant segments co-inherited by pairs of individuals from their most recent common ancestor. For some of the simulations, we inferred shared haplotypes using the GERMLINE software package (Gusev et al., 2009) on phased genotype data, which were obtained setting GENOME’s mutation rate to  per base pair (Roach et al., 2010). Genotypes were post-processed to mimic the information content of array data. To this extent, we computed the allele frequency spectrum of European individuals from the HapMap 3 dataset (Frazer et al., 2007), using frequency bins of 2%. We then randomly selected the same proportion of alleles from the simulated genotypes. We obtained an average density of
  single nucleotide polymorphisms/Mb.
To compare the proposed IBD-based approach for migration inference to the approach of Gravel (2012), which is based on ancestry deconvolution, we simulated synthetic datasets under several demographic models and extracted genotype data as previously described. We then ran the PCAdmix software (Brisbin et al., 2012) with windows of size 0.3cM and the genetic map used in the simulations. The output of PCAdmix was used to infer migration rates via the Tracts software package (Gravel, 2012). IBD information was computed in the same datasets running the GERMLINE software, and the output was used to infer migration rates using the DoRIS software package, which implements the proposed framework. Perfectly phased haplotypes were used in input for both PCAdmix and GERMLINE. Only migration rates were inferred, whereas all other demographic parameters were set to the true simulated values for both Tracts and DoRIS.
To demonstrate the use of the DoRIS framework on real data, we analyzed 56 trio-phased samples from the HapMap 3 dataset. Phased genotypes were downloaded from the HapMap 3 webpage at http://hapmap.ncbi.nlm.nih.gov. IBD haplotypes were extracted using GERMLINE, as previously described in Palamara et al. (2012).
3 RESULTS
3.1 Constant size and symmetric migration rates
To test the accuracy of demographic inference based on the proposed model, we initially simulated a number of populations of constant size Ne, which exchange individuals at a constant, symmetric migration rate m, as depicted in the model of Figure 2a. We simulated 15 possible sizes of synthetic populations, ranging from 2000 to 30 000 haploid individuals, with increments of 2000. For each population size, we simulated 11 possible migration values, uniformly chosen between  and
and  . For a total of 165 datasets, we simulated a chromosome of 300 cM for 500 haploid individuals from each subpopulation and computed IBD sharing within and across populations. The simulations used non-recombining blocks of 0.02 cM. This resolution may introduce small biases in the analysis, which we found to be negligible in our previous work. We then used Equation (10) to estimate
  and
and  , with results shown in Figure 3. To test the model’s accuracy, for this analysis, we only considered ground-truth IBD segments extracted from the synthetic genealogies (see Section 2).
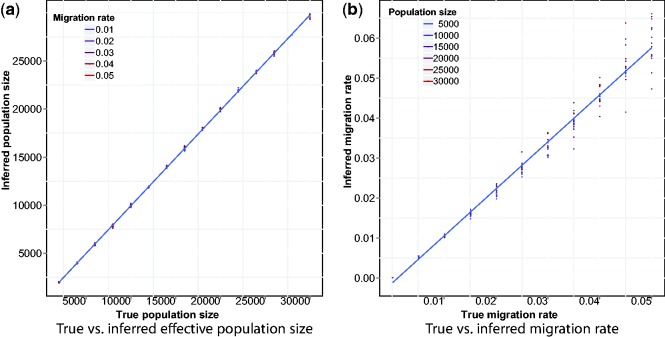
Fig. 3.
True versus inferred parameters for the model in Figure 2a. Estimates were obtained using Equation (10)
We obtained a good correspondence between the true population size and the size inferred via the estimator of Equation (10), with almost perfect correlation shown in Figure 3a. Inferred migration rates were also close to the simulated rates, although a moderate upward bias and higher estimation variance for large migration rates was observed in this case (Fig. 3b). In addition to using the effective population size estimator of Equation (10), we used the estimator previously computed in Palamara et al. (2012) for the case of constant population with no migration, reported in Equation (3). As expected, the inferred recent effective population size was in this case inflated by the presence of migration, as shown in Figure 4. When migration rates are increased, the inferred population size quickly approaches the total population size (in this case  ).
).
Fig. 4.
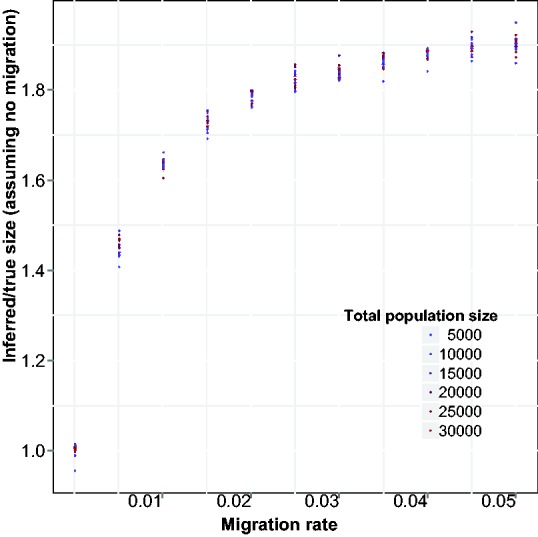
Inference of recent effective population size using Equation (3), which neglects migration. The ratio between inferred and true population size (y-axis) increases as the migration rate (x-axis) is increased, approaching the sum of population sizes for both populations (twice the true size)
3.2 Dynamic size and asymmetric migration rates
We then tested our model’s performance in the more complex demographic scenario depicted in Figure 2b, where a population splits into two subpopulations that grow at different exponential rates, interacting with asymmetric migration rates. We simulated a chromosome of  cM for 500 haploid individuals per subpopulation. Simulated non-recombinant blocks had size 0.025 cM. In all simulated scenarios, we kept Natot fixed to 10 000 haploid individuals, whereas
  and
and  were kept fixed at 5000 individuals. For
  and
and  , we simulated all possible combinations of sizes between 5000 and 205 000 haploid individuals, with increments of 15 000 (excluding cases where
  ). Note that on average, the simulated values of
  were smaller, resulting in higher inference accuracy compared with
  . For each pair of population sizes, we simulated values of m12 and m21 using all combinations of the migration rates 0.0001, 0.0167, 0.0334 and 0.5.
A total of 540 synthetic populations were tested. For each synthetic population, we extracted the average fraction of genome shared through haplotypes of different length intervals by pairs of individuals within each population or across populations. As in our previous work, we used a combination of intervals of uniform length and length intervals corresponding to quantiles of the Erlang-2 distribution, which is used in  . Inference performance was tested via minimization of the root-mean-squared deviation between observed and predicted average fraction of shared genome. Note that a likelihood-based approach (e.g. considering the number of shared segments) could be used based on the quantities derived in Section 2.1. We scanned several possible values for one parameter at a time, performing a line search while fixing the remaining model parameters to the true simulated value. The results of this analysis are reported in Figure 5.
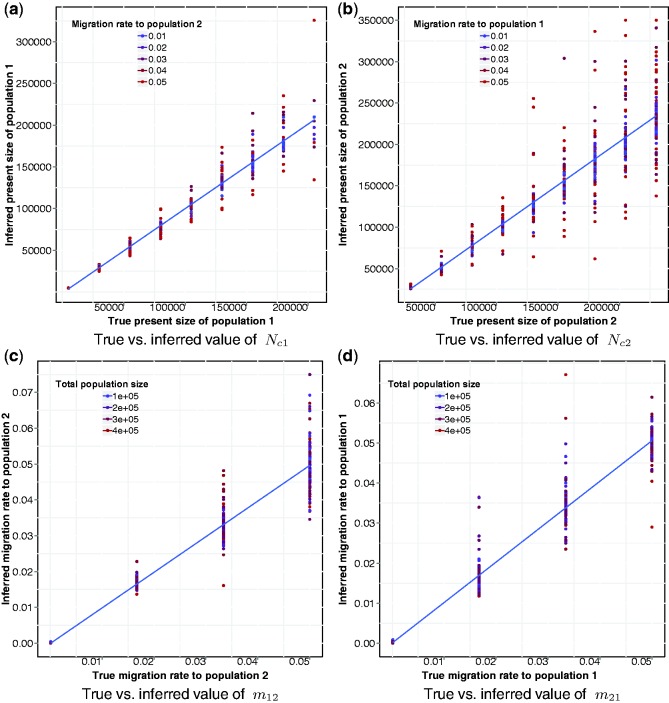
Fig. 5.
Results of the evaluation of our method on synthetic populations with demographic history depicted in the model of Figure 2b. Higher variance in the method’s accuracy is observed because of limited sample sizes and increased population sizes. Higher migration rates further decrease the rate of coalescent events in the recent generations (Fig. 5b), resulting in additional uncertainty. However, no significant bias is observed in the inference
As expected, because of the large recent effective population sizes we simulated, the variance of the inference accuracy was higher in this scenario, suggesting that more than a single chromosome for 500 diploid individuals may be required for the analysis of these demographics. A single chromosome of  cM sampled in 500 diploid individuals is in fact equivalent for the purpose of this inference to the analysis of all the autosomal chromosomes for
  diploid samples (see Palamara et al., 2012). Larger population sizes result in lower signal-to-noise ratio for the estimation of the expected fraction of genome shared via IBD segments, and increasing sample size or analyzing additional chromosomes is expected to reduce the variance in the inference performance. Lower accuracy was observed in the inference of
  since, as previously mentioned, this simulated subpopulation was on average larger. Inferred population sizes were more accurate in the presence of low-migration rates (represented by colors in Fig. 5a and b), as high migration further reduces the chance of early coalescent events, exacerbating the effects of large population sizes. Overall, no significant bias was observed in the recovered parameter values, suggesting our model provides a good match for the empirical distributions.
3.3 Applicability of the model to genotype data
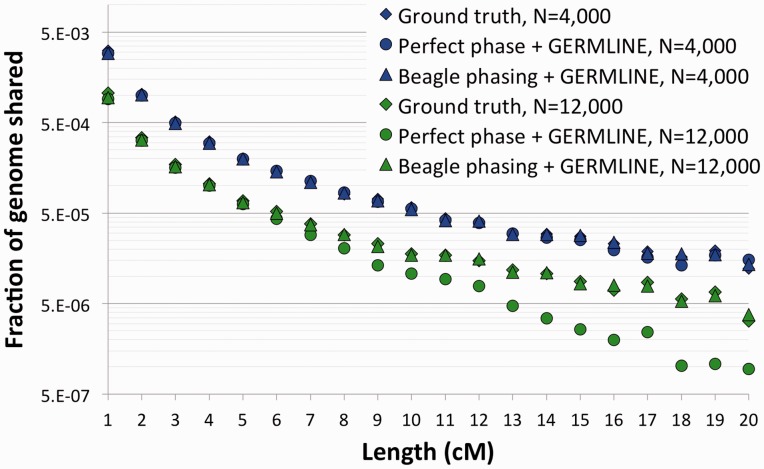
Although the previous analysis was mainly concerned with testing the model’s accuracy, and it relied on ground-truth IBD sharing extracted from the simulated genealogies, it is interesting to ask whether this approach can be used on genotype data. To this extent, we simulated genotypes for the demographic model of Figure 2a. We set the population sizes to 4000 or 12 000 diploid individuals per population, and extracted 300 diploid sampled from each group. The migration rate was symmetric and set to 0.04 per individual, per generation. Chromosomes of 150 cM were simulated using non-recombinant blocks of size 0.01 cM, and the synthetic genotypes were post-processed to reproduce the density and allele frequency spectrum of realistic SNP array data (see Section 2). In addition to extracting the ground truth IBD information as previously described, we inferred IBD haplotypes from the simulated genotypes using the GERMLINE software. The results suggest that when accurate phase information is available (e.g. for the X Chromosome, or for trio-phased samples), GERMLINE is able to recover the IBD sharing distribution across any pair of samples with high fidelity (Fig. 6). However, when the samples were computationally phased using the Beagle software (Browning and Browning, 2007), GERMLINE had an inconsistent performance, accurately recovering the IBD sharing in the case of N = 4000, whereas poorly inferring long haplotypes in the case of N = 12 000. This suggests that additional care must be taken when analyzing computationally phased data, particularly when analyzing cross-population IBD spectra, were the quality of the inferred IBD haplotypes will likely vary from population to population, as a result of different underlying demographic histories.
Fig. 6.
We simulated a chromosome of 150 cM for 600 individuals using the model in Figure 2a, setting population sizes to 4000 and 12 000 diploid individuals, with a migration rate of 0.04. IBD sharing was extracted directly from the simulated genealogy (diamonds), or inferred trough GERMLINE using perfectly phased (circles) or computationally phased (triangles) chromosomes
3.4 Real data analysis
To demonstrate the applicability of our method to real data, we analyzed the HapMap 3 Masai dataset, which was already studied in our previous work using a simulation-based approach. We here revisit this analysis, using the described analytical framework.
Cryptic relatedness across individuals in this dataset is extremely common, and it does not appear to be because of the presence of occasional outliers among the samples. Demographic reports are not supportive of recent population bottlenecks in this group, which is, though, to be slowly but steadily expanding (Coast, 2001). The Masai are a semi-nomadic people, and individuals often reside in small communities (Manyatta) of tens to few hundreds of members. To study their demography, we, therefore, use a model where V villages of constant size N exchange individuals at a constant and symmetric rate m. This model is similar to the one depicted in Figure 2a, with symmetric migration rates across several populations. We assumed that all samples were extracted from the same village and used the model described in Section 2.3 for the analysis. We performed a grid search testing migration rates from 0.01 to 0.4, with intervals of 0.01, village sizes from 50 to 4000 with steps of 10 and number of villages from 3 to 150 with increments of 1. We also obtained 95% confidence intervals for the inferred values using a bootstrap approach, by creating 400 re-samples randomly selecting individuals with replacement, then re-computing the optimal parameters using a gradient-driven procedure, which was initialized using the parameters inferred using the original samples (note, however, that small correlations exist for IBD sharing across individual pairs, and this method may provide optimistic intervals). Using this approach, we obtained the following estimates: V = 58 (95% CI: 46–75), N = 400 (95% CI 360–470) and  (95% CI 0.09–0.12).
3.5 Comparison with existing methods
The structure of long-range haplotypes is known to carry relevant information about recent population dynamics, but this genomic feature has only recently become observable thanks to the development of modern high-throughput genomic technologies. As a consequence, methods that rely on a population’s haplotypic structure to reconstruct demographic events have only recently arose. A model proposed in Pool and Nielsen (2009), and recently expanded in Gravel (2012), provides a way to analyze the distribution of migrant tracts and infer the timing and intensity of recent migration events. To analyze the distribution of migrant haplotypes, however, ancestry deconvolution needs to be accurately performed. This typically requires the availability of two suitable reference populations, which are required to be sufficiently diverged from each other. The amount of required divergence depends on the specific method used for the deconvolution, but in general, this poses significant constraints in terms of the demographic scenarios that can be analyzed using these methods.
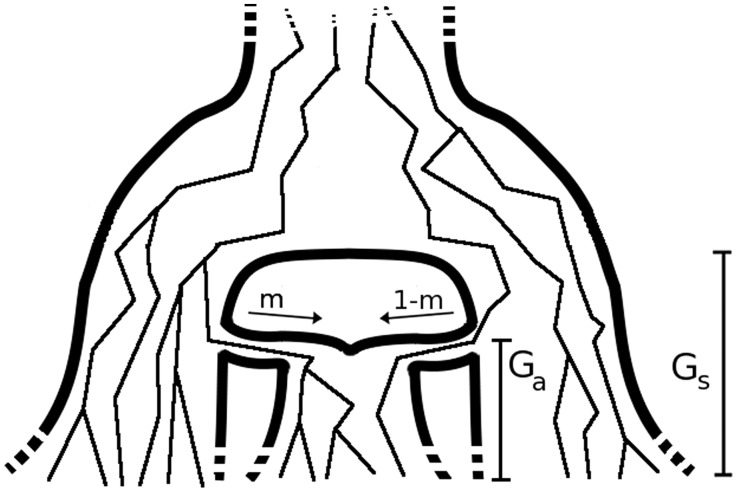
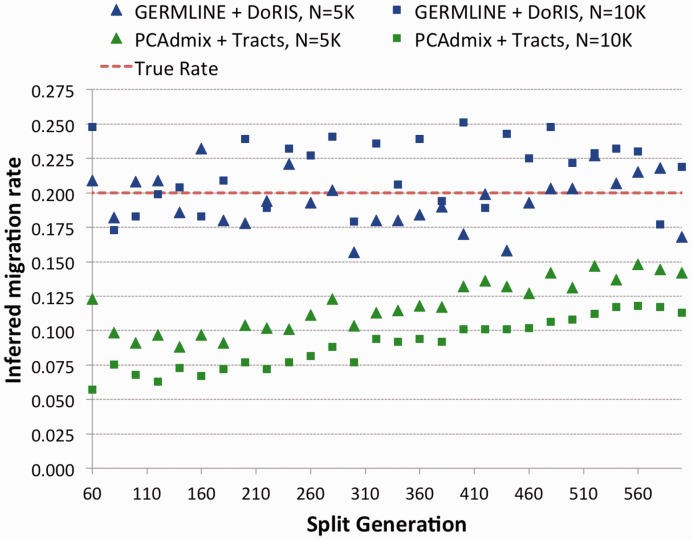
To compare our IBD-based approach with methods based on ancestry deconvolution, we simulated the demographic scenario of Figure 7, where two populations split Gs generations in the past, and Ga generations in the past contribute a fraction of genomes to the creation of a group of admixed individuals, with probability m and  , through a unique pulse of migration. All three population sizes were fixed to either N = 5000 or N = 10 000, m was set to 0.2 and Ga was 25 in all simulations. We varied Gs from 40 to 600, with increments of 20, and extracted genotype data on a single 400 cM chromosome for 250 diploid samples in each of the three extant populations (see Section 2). We used the output of the PCAdmix software as input for the Tracts program (Gravel, 2012), and the IBD segments retrieved by GERMLINE as input for the DoRIS software. Note that for the IBD analysis, we only used the 250 admixed samples and the 250 samples from the population contributing
  haplotypes at generation Ga, whereas the samples from the third population were ignored. In both cases, we inferred the value of m, setting all other parameters to the true simulated values, with results shown in Figure 8.
Fig. 7.
The model used to simulate admixed populations
Fig. 8.
We created several simulation genotype datasets using the model in Figure 7, varying Gs while keeping  , and using constant populations of size 5000 or 10 000 diploid individuals. We inferred the value of m using PCAdmix + Tracts, or GERMLINE + DoRIS, here reported as a function of Gs
DoRIS performed better on average (mean inferred  , std 0.025), although providing slightly noisy results, suggesting the need for a larger sample size and/or the analysis of additional chromosomes. The migration rate inferred by Tracts (mean
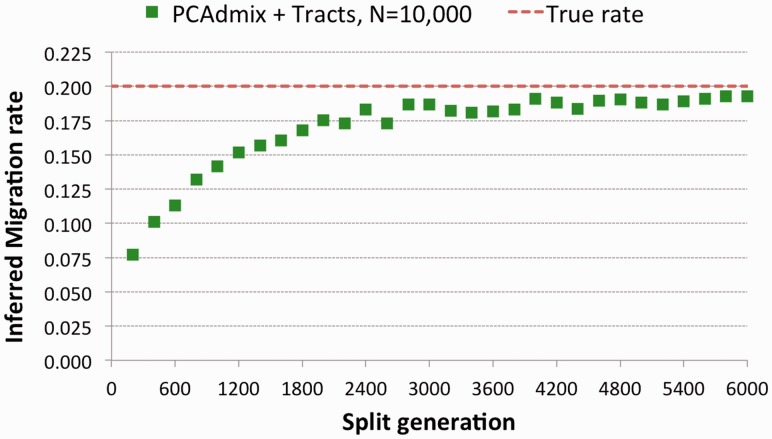
  , std 0.0233) was strongly biased. We note that in this setting, Tracts is essentially used to only report the proportion of ancestry inferred by the deconvolution method, which is the actual source of inaccuracy. Even for populations that diverged 600 generations in the past (∼15 000 years before present assuming a generation of 25 years), the recovered rate was substantially lower than the simulated rate. The case of N = 5000 yielded better estimates because of the higher drift found in smaller populations, which improved the power of PCAdmix to call migrant tracts. We additionally run the PCAdmix + Tracts analysis on longer time scales, simulating values of Gs from 200 to 6000, with intervals of 200 generations, using N = 10 000. Even for several thousand generations since the split of the reference populations, a small bias was observed (Fig. 9).
Fig. 9.
We created several datasets using the model in Figure 7, varying Gs from 200 to 6000, and using  with population sizes of 10 000 diploid individuals. We inferred the value of m using PCAdmix + Tracts from phased genotype data
This analysis suggests that although the methods that rely on ancestry deconvolution are a useful tool for the specific case of recently admixed groups arising from strongly diverged populations, they may not be suitable for the analysis of fine-scale migration events, such as those that occurred across populations that split few tens to hundreds of generations in the past. It is, however, possible that adjusting some of the parameters used for the GENOME simulations and for the PCAdmix software, or using other deconvolution methods, the obtained accuracy may be increased. Furthermore, the development of methods for ancestry deconvolution in sequence data, where rare variants are observable, is expected to substantially increase the power of this analysis, although the effects of limited population divergence are likely to still affect the accuracy of methods that do not explicitly take this aspect into account. An additional difference to be noted between the two considered approaches is that Tracts does not model population size changes in the populations, focusing on relative migration rates, whereas DoRIS allows recovering both population size fluctuations and migration rates, thus providing insights into the magnitude of migration events. This increased flexibility, however, may complicate the inference, also in light of our observation that large sample sizes are required for the IBD analysis.
4 DISCUSSION
In this article, we have extended our previous work on the relationship between long-range haplotypes that are shared IBD across individuals from a study cohort and the demographic history of the individuals’ populations of origin. Specifically, the described framework removes the limiting requirement that all sampled individuals belong to a single population and allows for explicitly modeling and inferring demographic interactions across multiple demes. The evaluation we performed on  synthetic populations confirms the accuracy of the derived IBD model and suggests that haplotype sharing can be used to gain insight into fine-scale demographic dynamics for the past tens to few hundreds of generations, provided enough samples are collected. Our analysis of the HapMap 3 Masai samples, as well as our previously reported analysis of an Askenazi cohort, suggests that this method can be applied to currently available datasets, provided that the quality of haplotype phasing and IBD detection is carefully considered.
Among available methods for demographic inference, another approach that explicitly models the effects of recombination (the Pairwise Sequentially Markovian Coalescent model, PSMC) was recently proposed in Li and Durbin (2011). This model relies on a Markovian approximation of the coalescent with recombination (McVean and Cardin, 2005) and is able to simultaneously consider the effects of mutation and recombination. The PSMC, however, differs from the proposed IBD-based model for its applicability, as it requires full sequence information and is currently focused on the analysis of remote demographic events using single individuals, or pairs of phased chromosomes. Because of the scarcity of coalescent events in the recent history, the simultaneous analysis of multiple samples is needed to infer recent demographics. An extension of the PSMC to handle the analysis of multiple samples, however, is computationally challenging, and efficient approximations are being developed (Sheehan et al., 2013).
In addition to these whole-sequence–based methods, independent current work (Ralph and Coop, 2013) infers historical demographic changes from length distributions of IBD segments, taking a complementary, less parametric approach, thereby allowing increased flexibility during inference of plausible coalescent time distributions, but without providing explicit modeling of migration and population size changes.
Among other methods aimed at inferring migration, our approach is conceptually related to those that rely on the frequency and length of migrant tracts. These methods, however, do not model population size fluctuations and are dependent on the possibility of reliably performing ancestry deconvolution to assign chromosomal tracts to a set of reference populations. These populations may not be available and, more importantly, need to be substantially divergent to attain high-quality deconvolution, as shown in our analysis. Although whole-sequence datasets and methodological developments may improve the performance of deconvolution methods, this limitation may prevent methods based on migrant tracts from being effectively used in the reconstruction of fine-scale migration patterns of the recent millennia.
Methods based on ancestry deconvolution, however, may in some scenarios be used in concert with methods based on IBD sharing. Knowing whether an IBD tract was co-inherited from a specific population, in fact, may provide information on the directionality of migration, and also offer further insight into deeper time scales, as shown in Campbell et al. (2012) and Velez et al. (2012). This direction may be further explored in light of the recently developed analytical model for migrant tracts and the presented model for IBD.
The proposed IBD framework will further be enhanced by accurate whole-genome sequence information, as the presence of mutations on IBD segments will improve the timing of common ancestors and IBD detection of shorter segments. Finally, our model still relies on the assumption of selective neutrality. Natural selection has been shown to have an impact on long-range haplotype sharing (Albrechtsen et al., 2010; Gusev et al., 2012). Although selective forces are mostly visible at local scales, demography affects the entire genome. This framework could, therefore, be used to test local deviations from neutrality, and the presented extension, which handles the case of multiple population models, may further assist the analysis of cross-population IBD sharing in this context.
ACKNOWLEGEMENT
The authors thank Simon Gravel for his help with the Tracts software and for useful technical discussions.
Funding: P.P. and I.P. were supported by NSF grants (08929882, 0845677) and NIH grant (U54 CA121852-06).
Conflict of Interest: none declared.
A1 APPENDIX
A1.1 Estimators for different  and
and 
When the population sizes of  and
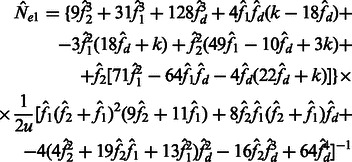
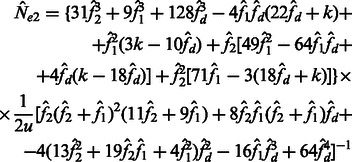
and  are allowed to vary, the derivation of Section 2.2 leads to the following closed form estimators
 |
(15) |
 |
(16) |
 |
(17) |
where  are observed within and across populations, and
| (18) |
REFERENCES
- Albrechtsen A, et al. Natural selection and the distribution of identity-by-descent in the human genome. Genetics. 2010;186:295–308. doi: 10.1534/genetics.110.113977. [DOI] [PMC free article] [PubMed] [Google Scholar]
- Atzmon G, et al. Abraham’s children in the genome era: major jewish diaspora populations comprise distinct genetic clusters with shared middle eastern ancestry. Am. J. Hum. Genet. 2010;86:850–859. doi: 10.1016/j.ajhg.2010.04.015. [DOI] [PMC free article] [PubMed] [Google Scholar]
- Brisbin A, et al. Pcadmix: Principal components-based assignment of ancestry along each chromosome in individuals with admixed ancestry from two or more populations. Hum. Biol. 2012;84:343–364. doi: 10.3378/027.084.0401. [DOI] [PMC free article] [PubMed] [Google Scholar]
- Browning B, Browning S. A fast, powerful method for detecting identity by descent. Am. J. Hum. Genet. 2011;88:173–182. doi: 10.1016/j.ajhg.2011.01.010. [DOI] [PMC free article] [PubMed] [Google Scholar]
- Browning S, Thompson E. Detecting rare variant associations by identity-by-descent mapping in case-control studies. Genetics. 2012;190:1521–1531. doi: 10.1534/genetics.111.136937. [DOI] [PMC free article] [PubMed] [Google Scholar]
- Browning SR, Browning BL. Rapid and accurate haplotype phasing and missing-data inference for whole-genome association studies by use of localized haplotype clustering. Am. J. Hum. Genet. 2007;81:1084. doi: 10.1086/521987. [DOI] [PMC free article] [PubMed] [Google Scholar]
- Campbell CL, et al. North African Jewish and non-Jewish populations form distinctive, orthogonal clusters. Proc. Natl Acad. Sci. 2012;109:13865–13870. doi: 10.1073/pnas.1204840109. [DOI] [PMC free article] [PubMed] [Google Scholar]
- Coast E. Maasai demography. 2001. PhD thesis, University College London, London, UK. [Google Scholar]
- Frazer KA, et al. A second generation human haplotype map of over 3.1 million snps. Nature. 2007;449:851–861. doi: 10.1038/nature06258. [DOI] [PMC free article] [PubMed] [Google Scholar]
- Gravel S. Population genetics models of local ancestry. Genetics. 2012;191:607–619. doi: 10.1534/genetics.112.139808. [DOI] [PMC free article] [PubMed] [Google Scholar]
- Gusev A, et al. Whole population, genome-wide mapping of hidden relatedness. Genome Res. 2009;19:318–326. doi: 10.1101/gr.081398.108. [DOI] [PMC free article] [PubMed] [Google Scholar]
- Gusev A, et al. Dash: a method for identical-by-descent haplotype mapping uncovers association with recent variation. Am. J. Hum. Genet. 2011;88:706–717. doi: 10.1016/j.ajhg.2011.04.023. [DOI] [PMC free article] [PubMed] [Google Scholar]
- Gusev A, et al. The architecture of long-range haplotypes shared within and across populations. Mol. Biol. Evol. 2012;29:473–486. doi: 10.1093/molbev/msr133. [DOI] [PMC free article] [PubMed] [Google Scholar]
- Han L, Abney M. Using identity by descent estimation with dense genotype data to detect positive selection. Eur. J. Hum. Genet. 2012;21:205–211. doi: 10.1038/ejhg.2012.148. [DOI] [PMC free article] [PubMed] [Google Scholar]
- Henn B, et al. Fine-scale population structure and the era of next-generation sequencing. Hum. Mol. Genet. 2010;19:R221–R226. doi: 10.1093/hmg/ddq403. [DOI] [PMC free article] [PubMed] [Google Scholar]
- Henn B, et al. Genomic ancestry of North Africans supports back-to-Africa migrations. PLoS Genet. 2012;8:e1002397. doi: 10.1371/journal.pgen.1002397. [DOI] [PMC free article] [PubMed] [Google Scholar]
- Huff C, et al. Maximum-likelihood estimation of recent shared ancestry (ERSA) Genome Res. 2011;21:768–774. doi: 10.1101/gr.115972.110. [DOI] [PMC free article] [PubMed] [Google Scholar]
- Kingman J. The coalescent. Stoch. Process. Appl. 1982;13:235–248. [Google Scholar]
- Kirkpatrick B, et al. Pedigree reconstruction using identity by descent. J. Comput. Biol. 2011;18:1481–1493. doi: 10.1089/cmb.2011.0156. [DOI] [PubMed] [Google Scholar]
- Lawson D, Falush D. Population identification using genetic data. Annu. Rev. Genomics Hum. Genet. 2012;13:337–361. doi: 10.1146/annurev-genom-082410-101510. [DOI] [PubMed] [Google Scholar]
- Li H, Durbin R. Inference of human population history from individual whole-genome sequences. Nature. 2011;475:493–496. doi: 10.1038/nature10231. [DOI] [PMC free article] [PubMed] [Google Scholar]
- Liang L, et al. Genome: a rapid coalescent-based whole genome simulator. Bioinformatics. 2007;23:1565–1567. doi: 10.1093/bioinformatics/btm138. [DOI] [PubMed] [Google Scholar]
- McVean GA, Cardin NJ. Approximating the coalescent with recombination. Philos. Trans. R. Soc. Lond. B Biol. Sci. 2005;360:1387–1393. doi: 10.1098/rstb.2005.1673. [DOI] [PMC free article] [PubMed] [Google Scholar]
- Palamara P, et al. Length distributions of identity by descent reveal fine-scale demographic history. Am. J. Hum. Genet. 2012;91:809–822. doi: 10.1016/j.ajhg.2012.08.030. [DOI] [PMC free article] [PubMed] [Google Scholar]
- Pool J, Nielsen R. Inference of historical changes in migration rate from the lengths of migrant tracts. Genetics. 2009;181:711–719. doi: 10.1534/genetics.108.098095. [DOI] [PMC free article] [PubMed] [Google Scholar]
- Ralph P, Coop G. The geography of recent genetic ancestry across Europe. Plos Biol. 2013;11:e1001555. doi: 10.1371/journal.pbio.1001555. [DOI] [PMC free article] [PubMed] [Google Scholar]
- Roach JC, et al. Analysis of genetic inheritance in a family quartet by whole-genome sequencing. Science. 2010;328:636–639. doi: 10.1126/science.1186802. [DOI] [PMC free article] [PubMed] [Google Scholar]
- Sheehan S, et al. Estimating variable effective population sizes from multiple genomes: a sequentially markov conditional sampling distribution approach. Genetics. 2013 doi: 10.1534/genetics.112.149096. [Epub ahead of print, doi:10.1534/genetics.112.149096, April 22, 2013] [DOI] [PMC free article] [PubMed] [Google Scholar]
- Velez C, et al. The impact of converso jews on the genomes of modern latin americans. Hum. Genet. 2012;131:251–263. doi: 10.1007/s00439-011-1072-z. [DOI] [PubMed] [Google Scholar]


