

Abstract
Motivation: Pre-mRNA cleavage and polyadenylation are essential steps for 3′-end maturation and subsequent stability and degradation of mRNAs. This process is highly controlled by cis-regulatory elements surrounding the cleavage/polyadenylation sites (polyA sites), which are frequently constrained by sequence content and position. More than 50% of human transcripts have multiple functional polyA sites, and the specific use of alternative polyA sites (APA) results in isoforms with variable 3′-untranslated regions, thus potentially affecting gene regulation. Elucidating the regulatory mechanisms underlying differential polyA preferences in multiple cell types has been hindered both by the lack of suitable data on the precise location of cleavage sites, as well as of appropriate tests for determining APAs with significant differences across multiple libraries.
Results: We applied a tailored paired-end RNA-seq protocol to specifically probe the position of polyA sites in three human adult tissue types. We specified a linear-effects regression model to identify tissue-specific biases indicating regulated APA; the significance of differences between tissue types was assessed by an appropriately designed permutation test. This combination allowed to identify highly specific subsets of APA events in the individual tissue types. Predictive models successfully classified constitutive polyA sites from a biologically relevant background (auROC = 99.6%), as well as tissue-specific regulated sets from each other. We found that the main cis-regulatory elements described for polyadenylation are a strong, and highly informative, hallmark for constitutive sites only. Tissue-specific regulated sites were found to contain other regulatory motifs, with the canonical polyadenylation signal being nearly absent at brain-specific polyA sites. Together, our results contribute to the understanding of the diversity of post-transcriptional gene regulation.
Availability: Raw data are deposited on SRA, accession numbers: brain SRX208132, kidney SRX208087 and liver SRX208134. Processed datasets as well as model code are published on our website: http://www.genome.duke.edu/labs/ohler/research/UTR/
Contact: uwe.ohler@duke.edu
1 INTRODUCTION
Almost all eukaryotic mRNAs undergo a post-transcriptional processing step called polyadenylation, in which they acquire a polyA tail at their 3′-end. After transcription, the 3′-most segment of the newly made RNA is cleaved off at specific sites (polyA sites) by a set of RNA regulatory proteins, which is followed by the synthesis of the polyA tail by the addition of adenine (A) residues in a non-templated fashion (Andreassi and Riccio, 2009). Around 90 protein factors regulate this process, with CPSF (cleavage and polyadenylation specificity factor), CstF (cleavage simulator factor), CFI (cleavage factor I), CFII (cleavage factor II), PAP (polyA polymerase) and PABII (polyA binding protein) playing a crucial role (Beaudoing et al., 2000; Ji and Tian, 2009; Shi et al., 2009; Tian et al., 2005).
PolyA sites are essential for 3′-end maturation, stability and degradation of mRNAs. Furthermore, polyadenylation defines the extent of the 3′-untranslated region (3′-UTR) of mRNAs, which spans from the stop codon up to the polyA tail and contains many post-transcriptional regulatory sequence elements such as microRNA (miRNA) target sites. In addition, alternative polyadenylation (APA) events arise from the presence of more than one particular functional cleavage/polyadenylation (polyA) site. The specific use of different polyadenylation sites can play a direct role in gene regulation. For instance, eliminating large parts of a 3′-UTR by using the more proximal polyA site enables a transcript to escape from miRNA regulation of its longer isoform. In proliferating cells, proximal polyA sites are therefore favored over distal ones, resulting in the production of mRNAs with shorter 3′-UTR and fewer miRNA-binding motifs (Ji and Tian, 2009; Sandberg et al., 2008). APA can influence mRNA nuclear export, cytoplasmic localization and non-miRNA–mediated changes in mRNA stability and translational efficiency (Majoros and Ohler, 2007; Mayr and Bartel, 2009; Moore, 2005).
As such, it is important to identify not just alternative but specifically regulated alternative events, such as tissue-specific APA. Based on earlier analysis of expressed sequence tags (ESTs), over 50% of the human and more than 30% of mouse genes were observed to have multiple polyadenylation sites, which results in mRNA isoforms different in their 3′-UTR and/or coding sequences (Tian et al., 2005). Initial studies on ESTs and tiling microarrays also indicated a bias in the regulation of polyA sites in certain human tissues (David et al., 2006; Tian et al., 2005; Zhang et al., 2005a).
The introduction of high-throughput sequencing technology has vastly expanded the opportunities to explore APA. Recent deep sequencing of mRNA populations from multiple tissue types has shown that 86% of human genes exhibit variants due to APA sites (Wang et al., 2008). In addition, several protocols relevant for studying polyadenylation have been developed. These protocols are designed to capture the 3′-end of mRNAs using specific primers, then sequence these fragments using second- and third-generation sequencing technologies (Jan et al., 2010; Mangone et al., 2010; Ozsolak et al., 2010; Shepard et al., 2011). However, with one exception (Derti et al., 2012), these approaches have been applied on small samples or non-mammalian genomes, leaving human normal tissues unexplored.
A thorough analysis of the polyadenylation process in adult tissue types, showing differential gene expression, would help us understand tissue-specific APA regulation. Although genome-wide APA profiling enables us to discover genes with multiple polyA isoforms at a genome-wide scale, it introduces major challenges. Without adequate methodology to specify the significance of APA biases in different tissues, we may confuse the mere presence of multiple APA with their specific up- or downregulation across conditions. A clean definition of truly specific sets is necessary to investigate which features allow for successful discrimination via computational models, and to suggest candidate regulatory features for future studies.
In this article, we address several of these challenges by using data from a new RNA-seq protocol applied to sequence the 3′-UTR end of mRNAs from different adult normal tissue types. Using a linear model, we distinguish between constitutive, alternative and alternatively regulated polyadenylation sites. Our linear regression model takes into account different library depth, expression of each gene in each tissue, as well as interactions between tissues and genes. As is still the case with many deep sequencing datasets, we do not have multiple replicates at our disposition that can be used to identify significantly differing APAs across tissues. Instead, significance of differences between samples from different tissue types is assessed by an appropriately designed permutation test. We then use the flanking sequence region around polyA sites to build predictive models both for the discrimination of constitutive polyA sites from genomic background, as well as to distinguish between regulated APA sets from different tissues.
2 RESULTS
2.1 A paired-end sequencing strategy for identifying polyadenylation sites
To precisely map polyA sites at genome-wide scale, we made use of several new libraries generated by a tailored sequencing approach, PA-seq. This protocol yields paired-end tags, with one tag located directly at the cleavage site, and its pair mapping to a more upstream location, typically in the 3′-UTR of the same transcript, Figure 1 (see Section 5).
Fig. 1.

Summary of PA-Seq Protocol: Total mRNA is randomly fragmented and reversed transcribed with a modified oligo(dT) primer, which synthesizes with the polyA tail. cDNA fragments are then captured and sequenced using multiplexed paired-end sequencing on Illumina
We used PA-seq to monitor the differential usage of polyadenylation sites in three different human adult tissue types: brain, liver and kidney. Each tissue was sequenced at varying depth. We obtained 2.8 million raw paired reads from liver, 8 million from kidney and 3.5 million from brain. Of those paired reads, ∼85% mapped to the human genome (hg19). Non-redundant read pairs, i.e. those that showed differences in at least one of the paired end tags, were grouped for each unique 3′ position, denoting a polyA site. These sites were filtered to exclude 3′ locations that mapped to genomic regions with high A content, to exclude possible contaminations by internal priming. PA-seq reads were then clustered into clusters (PAS clusters) analogous to an algorithm previously developed for the analysis of capped 5′ mRNA tags (Ni et al., 2010). We used the total sum of the non-redundant read pairs of all of the 3′ tags in each PAS cluster as a measure of the PAS usage, and considered PAS clusters covering narrow genomic regions and with five or more reads for all further analyses (see Section 5). Table 1 summarizes the data for all libraries.
Table 1.
Summary of PA-seq generated data, filtering steps and clustering in each tissue library
| PA-seq reads and clustering | Liver | Kidney | Brain |
|---|---|---|---|
| Raw read pairs with identifiable linker sequences | 2 851 978 | 8 044 879 | 3 533 285 |
| Read pairs mapped | 2 449 567 | 7 198 135 | 2 711 473 |
| Non-redundant read pairs no priming | 649 410 | 1 353 072 | 1 320 265 |
Non-redundant read pairs  2 distinct 5′ tags 2 distinct 5′ tags |
545 708 | 1 190 344 | 1 001 479 |
| Different polyA sites | 57 396 | 99 482 | 132 616 |
| PAS clusters | 8537 | 12 477 | 15 727 |
| PAS clusters with NPa | 7439 | 10 291 | 13 205 |
aNP = Narrow Peak.
To differentiate between PAS clusters that are constitutively used versus those with more than one polyA site, we grouped all overlapping PASs of the same transcript from the three tissue types together. Each PAS cluster was referred to by the mode of its median (see Section 5). If the gene has one PAS cluster, we refer to it as a constitutive gene; if it has more than one PAS cluster, we refer to it as an alternatively polyadenylated gene. Overall, we identified PAS clusters for 11 454 genes: around 7278 are constitutive and 4176 are alternative polyadenylated. From genes that are expressed in the three tissue types, 2171 are constitutive genes and 1965 are alternative polyadenylated genes. Alternative-polyadenylated genes had 5357 different PAS clusters; this is the set included in our analysis.
2.2 Characterization of tissue-specific regulated polyadenylation sites
Previous research on APA has shown that most of human genes have multiple polyadenylation sites, with many of them being tissue-specific. Testing the statistical significance of differential preferences for APA usage for a gene between tissues has been previously investigated by applying Fisher’s exact tests, chi-square tests or linear trend test (Beaudoing and Gautheret, 2001; Fu et al., 2011; Zhang et al., 2005a). Applied on a gene with multiple PAS, measured across multiple conditions, Fisher’s test will detect a significant difference of the pattern from the null assumption, but further tests are needed to pinpoint exactly which PAS, in which tissue, deviates from constitutive expression. A popular approach for identifying specific events across multiple tissues/sites has therefore been introduced based on Shannon entropy (Schug et al., 2005). Entropy values close to zero represent events specific to a single tissue; values increase as the relative usage spreads more across tissue types, or when the relative contribution of the tissue to the overall usage decreases. However, entropy does not directly reflect significance, as samples with vastly different levels of evidence (e.g. read coverage) may lead to similar entropy values.
To avoid these shortcomings, we specified a linear effects regression model for the read counts of each PAS cluster in each tissue type, motivated by previous applications to detect significant changes in gene expression (Marioni et al., 2008) and alternative splicing patterns (Blekhman et al., 2010). We controlled for fixed effects including different tissue depth, expression of each gene in each tissue, as well as any interaction between tissues and genes. The resulting residual for a given PAS cluster in a given tissue reflects evidence that this PAS cluster is specific, and highly used, in the tissue.
We then needed to quantify whether for a given PAS cluster, an observed difference in read counts in a specific tissue is significant, i.e. more pronounced than what would be expected owing to random variation. Given that the libraries were sequenced without experimental replicates, we applied permutation tests on the read counts of PASs for each gene in our libraries, to determine a tissue-specificity threshold (see Section 5). With three libraries at our disposal, we separated tissue-specific PAS clusters into two groups: clusters that are highly used in one individual tissue (individual), and clusters that are highly used in two tissue types simultaneously (overlapping). Figure 2a shows the test statistics for assessing the overlapping tissue-specificity applied to both original and permuted data.
Fig. 2.
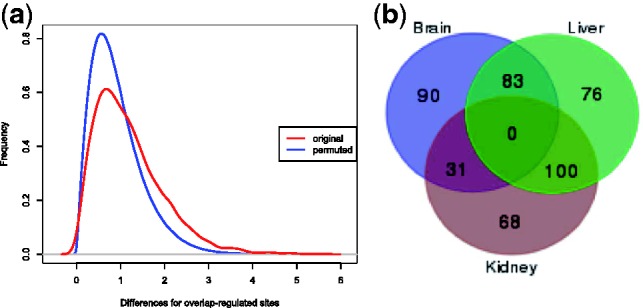
(a) Test statistic for the residual of the original (red) and permuted data (blue) for calculating overlap-significant PAS sites. (b) Number of tissue-specific PAS clusters found in each tissue: total individual sites: 234 (90 + 68 + 76), total overlap sites: 214 (31 + 100 + 83)
By applying our linear model on alternative-polyadenylated genes, our strict selection led to 234 tissue-specific individual PAS clusters, and 214 tissue-specific clusters overlapping in two tissue types [at P < 0.01; false-discovery rate (FDR) < 0.25] (Fig. 2b). To study the biased usage of APA in different tissues, we calculated a variability index (VI) between each pair of tissues. A low VI between two tissues indicates strong concordance in their usage of PAS clusters (see Section 5). Confirming expectations, liver and kidney showed the highest correlation, while brain and kidney were the lowest.
To illustrate the difference of our model compared with previous approaches, we calculated the Shannon entropy for the subset of PAS clusters that showed significant tissue specificity for both the individual and overlap PAS, Figure 3a. While the Shannon entropy is less than one for about 480 PAS clusters, our model identified only half of these as significantly tissue specific, with few additional PASs that had higher entropy. This is mainly because Shannon entropy does not take the abundance of evidence into account. For example, in Figure 3b, while the residual for the most proximal PAS site of the gene HDLBP (on negative strand) in brain indicates its outlier character, it is based on 17 tags ( of the total) and thus not large enough to be significantly brain specific. Additional data would be needed to confirm the specific trend. In turn, our model characterized specific PAS clusters that would have been characterized as non-specific due to higher entropy values. As an example, Figure 3c shows two PAS clusters for the gene BDH1 (on negative strand). The distal cluster is used in the three tissue types, while the proximal is used in kidney and brain only. Using the linear model, the distal cluster was detected as significant in liver, given that the other cluster, the proximal one, shows higher usage in the other two tissues (more than 2-folds).
Fig. 3.

(a) Histogram of Shannon entropy Q-values for all PAS clusters (range from 0 to 9). Red bars represent entropy values for individual-significant PAS detected by our model, blue bars represent overlap-significant PAS. Individual sites cluster at 0–2 entropy, and overlap sites cluster at the upper end of the range. (b) Example showing that Shannon entropy does not take the abundance of the evidence into account for calling sites significant. The usage (count) of each PAS cluster is marked in each tissue, followed by the entropy values then the test statistics resulted from our linear model. Tissue specificity is determined by low entropy values but high test statistics above a certain threshold. The proximal site in brain (17 tags;  of total) is classified as specific (entropy = 0.46). However, this relatively low tag number compared with the overall expression of the gene and the total library depth is not enough to call this site brain-specific. Entropy values for this proximal site in liver and kidney represent pseudo-counts (not shown in figure). (c) Example of a specific PAS cluster detected by our linear model and not by Shannon entropy (BDH1 gene on negative strand). The distal site (65 tags) is the only PAS site for this gene used in liver. Given the relatively low expression level of the gene and the liver-low library depth compared with brain and kidney, this site is classified as significant (test statistic of our model is marked by red circle). Shannon entropy values do not reflect this relative usage
2.3 Modeling constitutive polyadenylation sites
Because the PAPs responsible for synthesizing the polyA tail lack substrate specificity, it necessitates the presence of specific signals in the sequences around polyA sites that control mRNA polyadenylation (reviewed by Tian and Graber, 2012). One of the known main cis-regulatory elements is a conserved hexamer with consensus AWUAAA, located 10–35 nt upstream of the polyA site, referred to as polyadenylation signal (Beaudoing et al., 2000). The sequence composition at the cleavage site itself is not well characterized, but a dinucleotide preference CA was found in vitro (Chen et al., 1995). The sequence around polyA sites are usually G/U-rich with a remarkable downstream element (DSE), located within 30 nt downstream of the cleavage site. Upstream of polyA sites are upstream elements (USE) that are usually also U-rich, while some G-rich sequences have been reported as well. These elements are largely located in the region (+100,−100) nt around polyA sites (Tian and Graber, 2012).
Most early attempts for the computational prediction of polyA sites considered only samples containing the canonical PAS signal. Position weight matrices (PWM) for DSE and USE along with the PAS signal were used as input features for hidden Markov model (HMM) or support vector machines (SVM) (Hajarnavis et al., 2004; Legendre and Gautheret, 2003; Liu et al., 2003; Salamov and Solovyev, 1997; Tabaska and Zhang, 1999). After the characterization of 15 putative regulatory elements surrounding PAS signals (Hu et al., 2005), position-specific scoring matrices for the identified motifs and structural patterns of mRNA, have been later used as input features (Ahmed et al., 2009; Akhtar et al., 2010; Chang et al., 2011; Cheng et al., 2006; Shao et al., 2009). Most recently, the application of artificial neural network and random forests techniques have been proposed (Kalkatawi et al., 2012). These models were largely trained on low-abundance pooled EST data from varying human tissues; none of them examined tissues independently. While the use of curated quality controlled data from collections such as PolyA_DB (Zhang et al., 2005b) made it possible to design models with high accuracy, studies typically restricted their dataset to only include transcripts with PAS signals and results were sometimes hard to interpret owing to negative data not matched to the problem faced by the RNA processing machinery (such as using random genomic locations).
Modeling constitutive and/or APA sites specifically has so far rarely been investigated. The exact motifs responsible for APA are frequently still unknown, especially when it comes to tissue-regulated APA. Calculating PWM scores as features of classifiers, as in the case of constitutive sites with known motifs, will likely not reflect all of the regulatory elements. It is thus more applicable to use a sparse sequence-based classifier that uses a broad definition of the feature space. String kernels transform the input sequences into a higher-dimensional feature space, effectively looking for similarities among substrings, and have been proven to be successful in the prediction of alternative splicing and transcription start sites (Sonnenburg et al., 2006, 2007). Here, we build an SVM, using all of the information available in the sequences flanking the polyA sites, by applying two string kernels, the spectrum kernel (Leslie et al., 2002) and the weighted degree kernel with shifts (WD) (shogun toolbox; version 2.0.0) (Rätsch et al., 2005). While the spectrum kernel highlights the global similarities between sequences as it counts the number of occurrences of similar motifs, the WD kernel counts the number of matching substrings of similar lengths at the same position but allowed to be shifted within a specified window size around that position.
To investigate whether local sequence features around polyA sites are sufficient to explain polyadenylation, we first examined whether PAS clusters for constitutive genes could be classified from non-polyA sites. We focused on (−100,+100) nt around polyA sites, given that the known constitutive elements are located in this region, and that it has additionally been shown to exhibit a biased nucleotide composition (Legendre and Gautheret, 2003; Tian et al., 2005). As the polyadenylation machinery scans transcribed sequences for cleavage locations, it is not appropriate to use random genomic locations as negative set. Within transcripts, the highly distinct higher order nucleotide composition in coding sequences renders them inappropriate. Instead, we built a biologically motivated and challenging negative dataset: for each PAS, we randomly selected 10 positions in the 3′-UTR sequence between the transcript stop codon and the PAS, but not including the last 100 nucleotides. We retrieved the flanking (−100,+100) regions around these positions to create our negative dataset. In total, we extracted 2171 positive examples, and 21 710 negative examples.
Because we needed to set multiple hyper-parameters for the SVM and kernels, like order, shift and the classification penalty, we randomly split our dataset into 20% for model selection and 80% for (independent) training and testing (see Section 5). We applied 5-fold cross validation. The classifier performance using the two string kernels is shown in Figure 4a and b. Calculation of the area under the receiver operating characteristic curve (auROC) showed that the WD kernel substantially outperformed the baseline spectrum kernel (auROC = 99.6, 93.5%).
Fig. 4.

(a) ROC curve for the classification of WD kernel and Spectrum kernel on constitutive PAS clusters versus background. WD outperformed the Spectrum kernel (auROC = 99.6, 93.5%). (b) PRC curve. (c) Sequence Logo for (−30,+30) region around PAS clusters for constitutive genes; PAS site at position 0
We applied WD on varying window sizes around PAS clusters and found that the high performance largely resulted from features in the flanking region of (−40,+40). Our model parameters indicate that most of these motifs are less than 8-mers long, and shifted within 12 nt, which coincides with the findings of (Zhang et al., 2005a). This suggests that motifs around constitutive polyA sites are highly conserved in both sequence and location, and that the WD kernel is powerful enough to capture this phenomenon with near perfect accuracy. To illustrate the PAS sequence landscape, we created sequence logos for the flanking regions, which visually showed that the conserved motifs were found in the region (−30,+30) nt, WebLogo (Crooks et al., 2004), Figure 4c. The polyadenylation signal and DSE were clearly observed, and the cleavage site itself exhibited a strong BA dinucleotide bias (B = C, G or T), in agreement with the previously reported CA dinucleotide.
2.4 Prediction of tissue-specific polyadenylation sites
The presence of conserved motifs for constitutive polyA sites suggests the presence of other motifs that instruct the cell to start the polyadenylation process around APA sites in a condition-specific manner. To investigate this, we first merged all individual-tissue–regulated and the two-tissue–overlap PAS clusters and classified them against the positive constitutive dataset (Fig. 5a). The moderate but highly encouraging performance of the classifier on the individual-regulated and the overlap-regulated datasets (auROC = 74.5 and 66.5%, respectively) support this hypothesis. We then classified each of the individual tissue-specific PAS clusters against constitutive PASs (Fig. 5b). Brain-individual PAS clusters were highly distinguishable from constitutive PASs (auROC = 81.5%), while kidney-individual and liver-individual regulated PASs were classified at lower but reasonable levels (auROC = 72, 63.5%, respectively). An inspection of the sequence logos of each group explained this performance (Fig. 6). We found an A-rich sequence just downstream of brain-individual regulated PAS clusters that is not present in the constitutive subset and other tissue-specific sets. Moreover, while the canonical PAS signal is still found in liver-individual clusters, making them harder to be classified from constitutive clusters, it is completely absent in brain-individual regulated clusters.
Fig. 5.
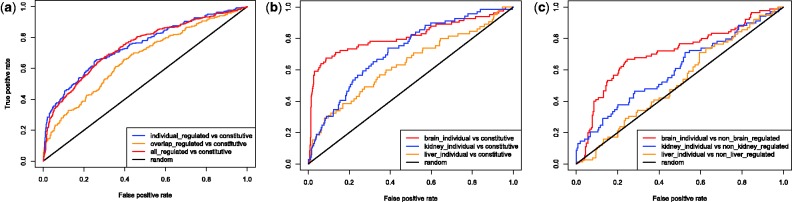
Classification of (a) tissue-specific PAS individual and overlap against constitutive. (b) individual tissue-specific regulated PAS clusters against constitutive. (c) Each individual regulated PAS cluster in one tissue against all regulated in other tissue types
Fig. 6.

Sequence logo for tissue-specific individual PAS clusters in each tissue (a) brain-specific, (b) kidney-specific and (c) liver-specific. PAS site at position 0
Finally, we trained models to compare each of the individual-regulated clusters in one tissue against all regulated clusters in the other two tissue types (both individual and overlap, Fig. 5c). In agreement with the motifs found at brain-specific individual PAS clusters, classification of brain-specific individual regulated PASs showed the best performance (auROC = 71%).
3 DISCUSSION
APA is a regulatory process with major impact on the downstream post-transcriptional fate of affected transcripts, yet it has been fairly sparsely investigated. Recently, several studies have analyzed data resulting from new high-throughput sequencing protocols, and some studies reported on differential preferences for APA usage in some genes from one tissue to another (Shepard et al., 2011). However, without a suitable methodology to specify the significance of these events, we may confuse alternative with specifically regulated polyadenylation.
Using a high-throughput sequencing method particularly designed to probe the mRNA 3′-end, PA-Seq, we were able to accurately identify polyA sites with high resolution. PA-Seq data from brain, liver and kidney were collected and constitutive genes were separated from those having more than one APA isoform. Given the large variability of tag counts across genes and coverage across libraries, simple tag number thresholds or ratios, or information theoretic metrics such as Shannon entropy, are not a well-suited methodology for deep sequencing data. They drastically inflate the number of putative alternative sites, and cannot separate spurious events with little sequence evidence from truly significant ones.
We therefore designed a suitable statistical framework to identify tissue-specific events such as APA sites across multiple deep sequencing libraries. Using a fixed-effects linear model and permutation tests, we were able to assign significance levels to APA usage and identify tissue-specific regulated events. Our stringent test left us with a highly specific and suitable dataset to investigate the regulation of alternative APA, but led to limited sample sizes. For example, the GFER mRNA showed two polyA sites with the distal site being used in brain only, similar to the findings in (Shepard et al., 2011). However, given its relatively low read coverage, it did not meet our stringent specificity threshold. Replicate datasets will enable the use of other statistical tests, which will likely detect a larger subset as significantly different, and may thus help to identify additional regulatory elements that are not covered in our examples.
This study is the first of its kind to analyze multiple APA sites for a transcript and across more than two conditions. We separated constitutive genes from genes with multiple APA sites, and examined each group separately. Our analysis demonstrated that the main cis-regulatory elements described to be responsible for polyadenylation, are a strong—and in fact a highly informative—hallmark for constitutive sites only. Studies have shown that 20–30% of human genes do not have the canonical PAS signal and suggested that polyadenylation regulation is directed by non-canonical sequences (Tian et al., 2005; Zarudnaya et al., 2003). Moreover, regulation by non-canonical sequences is more frequent in genes with APA (Nunes et al., 2010; Tian et al., 2005).
In specifically regulated subsets, in particular brain APA sites, we were able to define a highly enriched motif (AAAAAAAAAA) starting just downstream of the PAS cluster (Fig. 6a; application of MEME to the brain-specific subset confirmed its significance, resulting in an E-value of 1.8e-057). The canonical polyA signal was not observed in brain-specific clusters, and was found at lower conservation in liver and kidney. This agrees with an observation reported in (Nunes et al., 2010), where a polyA site did not possess the canonical polyA signal instead contained an A-rich element in its vicinity. An analysis of a different recent polyA deep sequencing dataset also showed a roughly 2-fold enrichment of the A-rich motif at brain sites, compared with liver and kidney, despite being generated by a different protocol and processed by a different pipeline (Derti et al., 2012). Given that the motif is specifically observed in only one tissue within multiple datasets, it is unlikely to be an experimental artifact resulting from internal priming, but we cautiously point out that it may reflect a property of brain mRNAs unrelated to polyadenylation.
Our methodology can be applied to data from additional libraries, such as the data generated from applying a high-throughput sequencing protocol on five mammals (Derti et al., 2012). This will allow for the definition of specific subsets and aid in the identification of further candidates of regulatory sequence features. Combined with knowledge of regulatory factors affecting polyadenylation and their expression patterns, this will enable the design of models that can build on the encouraging tissue-specific results we have reported here.
4 CONCLUSION
In summary, we have combined high-quality genome-wide data with appropriate downstream analyses and computational modeling. We have described a successful strategy to identify subsets of significant condition-specific polyA events, built sequence-based models to discriminate between them, and identified new candidates for post-transcriptional regulatory features.
5 METHODS
5.1 Paired-end sequencing and read mapping
A new deep sequencing protocol, PA-seq, was used to identify polyadenylation sites at genome-wide scale. Briefly, total mRNA is randomly fragmented and reversed transcribed with a modified oligo(dT) primer that base pairs with the polyadenylation tail. The modified oilgo(dT) primer has a dU in the fourth location in the 3′-end to be later digested by USER digestive enzyme. After that, the double-stranded cDNA fragments are captured by streptavidin-coupled magnetic beads, and sequenced using multiplexed paired end sequencing on Illumina (Fig. 1). Adult human normal kidney and liver samples were obtained from BioChain (Cat. # R1234142-50 and R1234149-50), and brain samples were obtained from Clontech (Cat. # 636102). Detailed description of the PA-seq protocol is available on the website.
Before mapping, we filtered out low-quality reads and tags that did not contain the adapter sequence ‘TTT’. The Burrows-Wheeler Alignment Tool (Li and Durbin, 2009) was used to align the paired end reads independently to the human genome (hg19), allowing two mismatches and no gaps. After that, we only considered 5′ and 3′ read pairs that mapped in the same orientation within 250 000 nt on the same chromosome.
To investigate the genomic regions that our reads came from, we annotated the 5′ aligned reads to their genomic regions using an in-house script (Ni et al., 2010). We did not use 3′ reads for annotation because they might fall beyond the end of annotated transcripts, indicating novel polyA sites. Locations were classified into six possible categories: annotated 3′-UTR,  1000 nt downstream of 3′-UTR, coding region, 5′-UTR, intron and intergenic region. Non-coding genes were ignored, as well as 5′ reads that mapped to 5′-UTR, intergenic regions, introns or upstream of 3′-UTR, as the average insert distance between 5′ and 3′ paired end reads amounted to 180–380 bp.
After alignment, non-redundant mapped read pairs that had the same paired end tags were grouped for each unique 3′ position, denoting a polyA site. For each polyA site, the count of the non-redundant 5′ pairs were used to indicate the relative usage of this site. We then filtered out 3′ tags that had exactly one 5′ paired read (count = 1). Finally, 3′ locations that mapped genomic regions with high A-content were filtered out (13 consecutive As in the 25 nt downstream of the mapped 3′ position), to exclude possible contamination by internal priming.
5.2 PolyA sites cluster identification
To cluster our reads, we used an algorithm previously developed for the analysis of capped 5′ mRNA tags (Ni et al., 2010). Only clusters with tag numbers greater than or equal five were considered. We then selected Narrow Peak clusters (NP), which span  nt, with more than half of the reads falling within ±2 nt of the mode. A minority of ∼15% showed a broader distribution of tags and was not considered further. The relative usage (count of the non-redundant 5′ pairs) of all of the 3′ tags in each PAS cluster was summed up and further used as a measure of the PAS usage, PAScount.
5.3 Identifying constitutive and alternative PAS sets
To determine constitutive set, we first grouped all PAS clusters of the same gene from the three tissue types together if their regions overlapped and their modes were within ±10 nt from the median. To get the median, we ordered clusters according to their start position, and referred to the PAS by the mode of the median cluster. If the PAS appeared in two tissue types only, we used the mode of the second start position. Finally, if the gene had one PAS cluster we called it constitutive; otherwise, it was considered alternative.
5.4 Linear model to identify tissue-specific PAS
To determine tissue-specific contributions to PAS utilization, we implemented a linear fixed-effects model. Let  denote the PAScount for PAS cluster p for gene g in tissue t. Then
| (1) |
where μ is a general intercept term, Tt is a tissue-specific effect, Gg is a gene-specific effect,  is a tissue by gene interaction term and
  is the residual. There was no need to incorporate random effect terms as we did not have variable replicates. Because we controlled for different tissue depth, expression of each gene in each tissue, as well as any interaction between tissues and genes, a correlation of the residual for a particular PAS cluster with tissue suggests differences in PAS usages between tissues. To quantify the differential usage of a PAS between tissues, we computed the differences in the residuals
  . We accounted for the lack of usage of a PAS cluster in a certain tissue by adding pseudo-counts. We applied this model on genes that are expressed in the three tissue types, and fitted the model using Maximum Likelihood approach as implemented in nlme R library (Pinheiro et al., 2011).
5.5 Permutation test to determine P-value
Our dataset was composed of three tissue libraries, each with the same set of genes, but different PAS counts. To preserve library depth and gene expression levels in each tissue, we first calculated the contribution percentage of each PAS cluster on the gene level [cf. Equation (1)]. Then, we used these percentages in our permutations, but noted the total expression level of each gene in each library. Our null hypothesis assumes that PAS clusters are non-tissue–specific regulated. To model this assumption in our permutation test, in each round, we permuted tissue labels for each PAS cluster; then, for each gene, the percentages of the permuted PAS were used to represent a multinomial distribution, from which we drew a random sample, scaled by the total gene expression value in each tissue. As the minimal evidence for each cluster was set to five reads, missing values, i.e. PAS clusters not detected in some of the tissues, were represented by a random number between 1 and 4.
5.6 Identifying individual and overlapping PASs
To identify tissue-specific PASs that are highly used in one individual tissue, we used the difference between the highest and the median residual values for each PAS as test statistic. For each PAS, we computed the test statistic  , where m = 5357 different PAS. For each of the observed differences in our data, we obtained a P-value based on an empirical null distribution from 1000 permutations. P-values were corrected for multiple hypothesis testing using the Storey FDR calculation (Storey and Tibshirani, 2003). We used a liberal FDR of 0.25, to allow for the discovery of significant events given the relatively small number of samples being analyzed. The tissue-specificity threshold was set to 2.376 (in log space, corresponding to P < 0.01, FDR < 0.25); all PASs showing a difference
  were considered significant.
To characterize PAS clusters that are highly used in two tissue types simultaneously (overlapping), we computed the test statistics to be the difference between the mean of the highest two residual values and the lowest value. PASs with residual difference between tissues  were considered significant to the two tissues with the highest values (corresponding to FDR < 0.25, P < 0.011).
5.7 Calculation of VI
To explore differences in APA usage among tissues, we calculated a VI that compares the number of individual regulated PAS to overlap PAS. The VI is defined as follows:
| (2) |
where  is the VI between tissue x and tissue y, Ix and Iy are the number of individually regulated tissue-specific PAS clusters in tissue x and tissue y, respectively, and
  is the number of overlapping regulated tissue-specific PAS clusters in tissues x and y simultaneously. A low value of VI between a pair of tissues indicates a high degree of correlation in APA regulation, whereas a high value of VI indicates a weak correlation. The calculated indices for each pair are VILiverKidney = 1.44, VIBrainLiver = 2, VIBrainKidney = 5.09.
5.8 Calculation of Shannon entropy
We assessed tissue-specific APA in the three tissue types by calculating Shannon entropy on the count of each PAS cluster identified in each tissue, according to (Schug et al., 2005). We only considered genes that were expressed in the three tissue types, i.e. that had at least one PAS cluster annotated for each tissue. We determined the relative expression of each PAS cluster of a gene as follows:
| (3) |
where  = the PAScount for PAS p for gene g in tissue t,
  is the summation of PAScount for all PASs of gene g in tissue t and
  is the number of different PAS clusters for gene g. Next, we computed the probability of observing a PAS cluster in each tissue by
| (4) |
Calculation of entropy values followed (Schug et al., 2005). Entropy values close to zero represent the group of PAS clusters that are specific to a single tissue, and increase when the PAS cluster is more broadly used in different tissue types, or when the relative contribution of the tissue to the overall usage of the PAS decreases (Schug et al., 2005).
5.9 Dataset for constitutive classification against background
Our dataset is best described as a set of sequences, each is composed of an array of characters A, C, G, T. The length of each sequence is 201 characters. For the positive training data, the element at position 101 represents the polyA site (median of the PAS cluster). We chose a flanking region of 100 nt upstream and downstream of the mode of the PAS cluster because previous studies have shown that most of the main features of polyA sites are located in this region (Cheng et al., 2006). We refer to the 101th position as 0, upstream sequences as (−100,−1), and downstream sequences as (+1,+100). We restricted our dataset to include PAS clusters for genes that are expressed in the three tissue types.
To choose a biologically motived background/negative dataset, for each true PAS mode in our PAS cluster positive dataset, we randomly selected 10 positions downstream of the stop codon, but did not include the 100 nt just upstream of the mode of the PAS. If the gene does not have an annotated stop codon, we select positions from the last 500 nt but not including the last 100 nt upstream of the mode of the PAS. We then retrieved the sequence of the 100 nt upstream and downstream of these selected sites to compose our negative dataset.
5.10 String kernels and SVM
Kernel functions measure the similarity between different data points in the feature space. For our purposes, the similarity is between two segments of DNA sequences with the same length. As noted earlier, the main cis-regulatory elements responsible for polyadenylation are located in the flanking region (−40,+40) nt from polyA sites, while further downstream and/or upstream (−100,+100) of the polyA site lie some other G/U-rich segments of sequences, with varying length, location and exact sequence compositions. The spectrum kernel considers the global similarities between two given sequences, by counting the number of occurrences of k-mer motifs (referred to as ‘order’ in Section 5.12) over the entire sequence. The Weight degree kernel with shifts focuses on local similarities between the given sequences by counting the number of matching k-mers at the same positions, within a window around the matching position (referred to as ‘shift’). We applied both string kernels on the region (−100,+100).
5.11 Handling unbalanced data
Our negative dataset has 10 times more examples than the positive set. This unbalanced dataset could be challenging for classifiers; because the data is unbalanced, the cost of misclassification is also unbalanced; thus, a false negative is more costly than a false positive (Ben-Hur et al., 2008). Therefore, we assigned relative misclassification penalty, C, for each set according to its number of examples; for positive training data, C is 10 times larger than that of the negative training data (Provost, 2000).
5.12 Model selection
To settle on the combination of parameters, which represent our model’s ability to accurately distinguish the surrounding sequence of polyA sites from other genomic loci, we applied model selection. The four parameters to be optimized are (i) misclassification penalty or the SVM (C), (ii) length of the substrings compared (order), (iii) positional shifts/window around polyA site for WD kernel and (iv) length of the flanking region around the PAS. We tried different values for each of these parameters, while fixing the rest. To avoid over-fitting, first, we randomly split our data; 20% for model selection and 80% for training and testing. These two sets were kept independent of each other. In the model selection phase, we applied 2-fold cross validation, and selected parameters that gave the highest auROC. The optimal values for each parameter is shown in Table 2. We then used the selected parameters in the training and test phase by applying 5-fold cross validation. Evaluation curves were drawn using ROCR package (Sing et al., 2005).
Table 2.
Model selection parameters for classification of constitutive sites against background
| Parameter | Set of values | Optimal value |
|---|---|---|
| Weight degree kernel with shifts | ||
| Order | {1, 2 , … , 24} | 8 |
| Shift | {4, 8 , … , 48} | 12 |
| C | {0.177, 0.25 , … , 5.6} | 1.4 |
| Spectrum kernel | ||
| Order | {1, 2 , … , 24} | 8 |
| C | {0.177, 0.25 , … , 5.6} | 5.6 |
Note: Model selection was performed on 20% of the data that was kept independent, and applying cross validation.
5.13 SVM on tissue-specific regulated PAS clusters
In this experiment, our positive examples were the set of individual and overlap tissue-specific sites, and negative examples were constitutive sites, expressed in the three tissue types and with exactly one PAS cluster. As the WD kernel clearly outperformed the spectrum kernel on the recognition of constitutive sites, we only used the WD kernel for the rest of our analyses.
Funding: This project was funded by a grant from the National Science Foundation (MCB-0822033).
Conflict of Interest: none declared.
REFERENCES
- Ahmed F, et al. Prediction of polyadenylation signals in human DNA sequences using nucleotide frequencies. In Silico Biol. 2009;9:135–148. [PubMed] [Google Scholar]
- Akhtar MN, et al. POLYAR, a new computer program for prediction of poly (A) sites in human sequences. BMC Genomics. 2010;11:646. doi: 10.1186/1471-2164-11-646. [DOI] [PMC free article] [PubMed] [Google Scholar]
- Andreassi C, Riccio A. To localize or not to localize: mRNA fate is in 3′UTR ends. Trends Cell Biol. 2009;19:465–474. doi: 10.1016/j.tcb.2009.06.001. [DOI] [PubMed] [Google Scholar]
- Beaudoing E, Gautheret D. Identification of alternate polyadenylation sites and analysis of their tissue distribution using EST data. Genome Res. 2001;11:1520–1526. doi: 10.1101/gr.190501. [DOI] [PMC free article] [PubMed] [Google Scholar]
- Beaudoing E, D, et al. Patterns of variant polyadenylation signal usage in human genes. Genome Res. 2000;10:1001–10. doi: 10.1101/gr.10.7.1001. [DOI] [PMC free article] [PubMed] [Google Scholar]
- Ben-Hur A, et al. Support vector machines and kernels for computational biology. PLoS Comput. Biol. 2008;4:e1000173. doi: 10.1371/journal.pcbi.1000173. [DOI] [PMC free article] [PubMed] [Google Scholar]
- Blekhman R, et al. Sex-specific and lineage-specific alternative splicing in primates. Genome Res. 2010;20:180–189. doi: 10.1101/gr.099226.109. [DOI] [PMC free article] [PubMed] [Google Scholar]
- Chang T, et al. Characterization and prediction of mRNA polyadenylation sites in human genes. Med. Biol. Eng. Comput. 2011;49:1–10. doi: 10.1007/s11517-011-0732-4. [DOI] [PubMed] [Google Scholar]
- Chen F, et al. Cleavage site determinants min the mammalian polydenylation signal. Nucleic Acids Res. 1995;23:2614–2620. doi: 10.1093/nar/23.14.2614. [DOI] [PMC free article] [PubMed] [Google Scholar]
- Cheng Y, et al. Prediction of mRNA polyadenylation sites by support vector machine. Bioinformatics. 2006;22:2320–2325. doi: 10.1093/bioinformatics/btl394. [DOI] [PubMed] [Google Scholar]
- Crooks G, et al. WebLogo: a sequence logo generator. Genome Res. 2004;14:1188–1190. doi: 10.1101/gr.849004. [DOI] [PMC free article] [PubMed] [Google Scholar]
- David L, et al. A high-resolution map of transcription in the yeast genome. Proc. Natl Acad. Sci. USA. 2006;103:5320–5325. doi: 10.1073/pnas.0601091103. [DOI] [PMC free article] [PubMed] [Google Scholar]
- Derti A, et al. A quantitative atlas of polyadenylation in five mammals. Genome Res. 2012;22:1173–1183. doi: 10.1101/gr.132563.111. [DOI] [PMC free article] [PubMed] [Google Scholar]
- Fu Y, et al. Differential genome-wide profiling of tandem 3′ UTRs among human breast cancer and normal cells by high-throughput sequencing. Genome Res. 2011;21:741–747. doi: 10.1101/gr.115295.110. [DOI] [PMC free article] [PubMed] [Google Scholar]
- Hajarnavis A, et al. A probabilistic model of 3′ end formation in caenorhabditis elegans. Nucleic Acids Res. 2004;32:3392–3399. doi: 10.1093/nar/gkh656. [DOI] [PMC free article] [PubMed] [Google Scholar]
- Hu J, et al. Bioinformatic identification of candidate cis-regulatory elements involved in human mRNA polyadenylation. RNA. 2005;11:1485–1493. doi: 10.1261/rna.2107305. [DOI] [PMC free article] [PubMed] [Google Scholar]
- Jan C, et al. Formation, regulation and evolution of caenorhabditis elegans 3′ UTRs. Nature. 2010;469:97–101. doi: 10.1038/nature09616. [DOI] [PMC free article] [PubMed] [Google Scholar]
- Ji Z, Tian B. Reprogramming of 3′ untranslated regions of mRNAs by alternative polyadenylation in generation of pluripotent stem cells from different cell types. PLoS One. 2009;4:8419. doi: 10.1371/journal.pone.0008419. [DOI] [PMC free article] [PubMed] [Google Scholar]
- Kalkatawi M, et al. Dragon polya spotter: predictor of poly (A) motifs within human genomic DNA sequences. Bioinformatics. 2012;28:127–129. doi: 10.1093/bioinformatics/btr602. [DOI] [PMC free article] [PubMed] [Google Scholar]
- Legendre M, Gautheret D. Sequence determinants in human polyadenylation site selection. BMC Genomics. 2003;4:7. doi: 10.1186/1471-2164-4-7. [DOI] [PMC free article] [PubMed] [Google Scholar]
- Leslie C, et al. The spectrum kernel: a string kernel for SVM protein classification. Pac. Symp. Biocomput. 2002;575:564–575. [PubMed] [Google Scholar]
- Li H, Durbin R. Fast and accurate short read alignment with Burrows–Wheeler transform. Bioinformatics. 2009;25:1754–1760. doi: 10.1093/bioinformatics/btp324. [DOI] [PMC free article] [PubMed] [Google Scholar]
- Liu H, et al. An in-silico method for prediction of polyadenylation signals in human sequences. Genome Inform. 2003;14:84–93. [PubMed] [Google Scholar]
- Majoros W, Ohler U. Spatial preferences of microRNA targets in 3′ untranslated regions. BMC Genomics. 2007;8:152. doi: 10.1186/1471-2164-8-152. [DOI] [PMC free article] [PubMed] [Google Scholar]
- Mangone M, et al. The landscape of C. elegans 3′ UTRs. Science. 2010;329:432–435. doi: 10.1126/science.1191244. [DOI] [PMC free article] [PubMed] [Google Scholar]
- Marioni J, et al. RNA-seq: an assessment of technical reproducibility and comparison with gene expression arrays. Genome Res. 2008;18:1509–1517. doi: 10.1101/gr.079558.108. [DOI] [PMC free article] [PubMed] [Google Scholar]
- Mayr C, Bartel D. Widespread shortening of 3′UTRs by alternative cleavage and polyadenylation activates oncogenes in cancer cells. Cell. 2009;138:673–684. doi: 10.1016/j.cell.2009.06.016. [DOI] [PMC free article] [PubMed] [Google Scholar]
- Moore M. From birth to death: the complex lives of eukaryotic mRNAs. Science. 2005;309:1514–1518. doi: 10.1126/science.1111443. [DOI] [PubMed] [Google Scholar]
- Ni T, et al. A paired-end sequencing strategy to map the complex landscape of transcription initiation. Nat. Methods. 2010;7:521–527. doi: 10.1038/nmeth.1464. [DOI] [PMC free article] [PubMed] [Google Scholar]
- Nunes N, et al. A functional human poly (a) site requires only a potent DSE and an a-rich upstream sequence. EMBO J. 2010;29:1523–1536. doi: 10.1038/emboj.2010.42. [DOI] [PMC free article] [PubMed] [Google Scholar]
- Ozsolak F, et al. Comprehensive polyadenylation site maps in yeast and human reveal pervasive alternative polyadenylation. Cell. 2010;143:1018–1029. doi: 10.1016/j.cell.2010.11.020. [DOI] [PMC free article] [PubMed] [Google Scholar]
- Pinheiro J, et al. The R development core team 2011 nlme: Linear and nonlinear mixed effects models. R package version 3.1-102. Vienna, Austria: R Foundation for Statistical Computing; 2011. http://cran.r-project.org/web/packages/nlme/index.html. [Google Scholar]
- Provost F. 2000. Machine learning from imbalanced data sets 101. In: Proceedings of the AAAI2000 Workshop on Imbalanced Data Sets, Austin TX. [Google Scholar]
- Rätsch G, et al. RASE: recognition of alternatively spliced exons in C. elegans. Bioinformatics. 2005;21(Suppl. 1):i369–i377. doi: 10.1093/bioinformatics/bti1053. [DOI] [PubMed] [Google Scholar]
- Salamov A, Solovyev V. Recognition of 3′-processing sites of human mRNA precursors. Comp. Appl. Biosci. 1997;13:23–28. doi: 10.1093/bioinformatics/13.1.23. [DOI] [PubMed] [Google Scholar]
- Sandberg R, et al. Proliferating cells express mRNAs with shortened 3′untranslated regions and fewer microRNA target sites. Science. 2008;320:1643–1647. doi: 10.1126/science.1155390. [DOI] [PMC free article] [PubMed] [Google Scholar]
- Schug J, et al. Promoter features related to tissue specificity as measured by shannon entropy. Genome Biol. 2005;6:R33. doi: 10.1186/gb-2005-6-4-r33. [DOI] [PMC free article] [PubMed] [Google Scholar]
- Shao Y, et al. 2009. Density clustering based SVM and its application to polyadenylation signals. In: Proceedings of the Third International Symposium on OSB, Zhangjiajie, China, pp. 117–122. [Google Scholar]
- Shepard P, et al. Complex and dynamic landscape of RNA polyadenylation revealed by PAS-Seq. RNA. 2011;17:761–772. doi: 10.1261/rna.2581711. [DOI] [PMC free article] [PubMed] [Google Scholar]
- Shi Y, et al. Molecular architecture of the human pre-mRNA 3′ processing complex. Mol. Cell. 2009;33:365–376. doi: 10.1016/j.molcel.2008.12.028. [DOI] [PMC free article] [PubMed] [Google Scholar]
- Sing T, et al. Rocr: visualizing classifier performance in r. Bioinformatics. 2005;21:3940–3941. doi: 10.1093/bioinformatics/bti623. [DOI] [PubMed] [Google Scholar]
- Sonnenburg S, et al. Arts: accurate recognition of transcription starts in human. Bioinformatics. 2006;22:e472. doi: 10.1093/bioinformatics/btl250. [DOI] [PubMed] [Google Scholar]
- Sonnenburg S, et al. Accurate splice site prediction using support vector machines. BMC Bioinformatics. 2007;8(Suppl. 10):S7. doi: 10.1186/1471-2105-8-S10-S7. [DOI] [PMC free article] [PubMed] [Google Scholar]
- Storey JD, Tibshirani R. Statistical significance for genomewide studies. Proc. Natl Acad. Sci. USA. 2003;100:9440–9445. doi: 10.1073/pnas.1530509100. [DOI] [PMC free article] [PubMed] [Google Scholar]
- Tabaska J, Zhang M. Detection of polyadenylation signals in human DNA sequences. Gene. 1999;231:77–86. doi: 10.1016/s0378-1119(99)00104-3. [DOI] [PubMed] [Google Scholar]
- Tian B, Graber JH. Signals for pre-mRNA cleavage and polyadenylation. Wiley Interdiscip. Rev. RNA. 2012;3:385–396. doi: 10.1002/wrna.116. [DOI] [PMC free article] [PubMed] [Google Scholar]
- Tian B, et al. A large-scale analysis of mRNA polyadenylation of human and mouse genes. Nucleic Acids Res. 2005;33:201–212. doi: 10.1093/nar/gki158. [DOI] [PMC free article] [PubMed] [Google Scholar]
- Wang E, et al. Alternative isoform regulation in human tissue transcriptomes. Nature. 2008;456:470–476. doi: 10.1038/nature07509. [DOI] [PMC free article] [PubMed] [Google Scholar]
- Zarudnaya M, et al. Downstream elements of mammalian pre-mRNA polyadenylation signals: primary, secondary and higher-order structures. Nucleic Acids Res. 2003;31:1375–1386. doi: 10.1093/nar/gkg241. [DOI] [PMC free article] [PubMed] [Google Scholar]
- Zhang H, et al. Biased alternative polyadenylation in human tissues. Genome Biol. 2005a;6:R100. doi: 10.1186/gb-2005-6-12-r100. [DOI] [PMC free article] [PubMed] [Google Scholar]
- Zhang H, et al. PolyA_DB: a database for mammalian mRNA polyadenylation. Nucleic Acids Res. 2005b;33(Suppl. 1):D116–D120. doi: 10.1093/nar/gki055. [DOI] [PMC free article] [PubMed] [Google Scholar]