Abstract
Alexander Disease (AxD) is a primary disorder of astrocytes, caused by heterozygous mutations in GFAP, which encodes the major astrocyte intermediate filament protein, glial fibrillary acidic protein (GFAP). Astrocytes in AxD display hypertrophy, massive increases in GFAP, and the accumulation of Rosenthal fibers, cytoplasmic protein inclusions containing GFAP, and small heat shock proteins. To study the effects of GFAP mutations on astrocyte morphology and physiology, we have examined hippocampal astrocytes in three mouse models of AxD, a transgenic line (GFAPTg) in which the normal human GFAP is expressed in several copies, a knock-in line (Gfap+/R236H) in which one of the Gfap genes bears an R236H mutation, and a mouse derived from the mating of these two lines (GFAPTg; Gfap+/R236H). We report changes in astrocyte phenotype in all lines, with the most severe in the GFAPTg;Gfap+/R236H, resulting in the conversion of protoplasmic astrocytes to cells that have lost their bushy-like morphology because of a reduction of distal fine processes, and become multinucleated and hypertrophic. Astrocytes activate the mTOR cascade, acquire CD44, and lose GLT-1. The altered astrocytes display a microheterogeneity in phenotypes, even neighboring cells. Astrocytes also show diminished glutamate transporter current, are significantly depolarized, and not coupled to adjacent astrocytes. Thus, the accumulation of GFAP in the AxD mouse astrocytes initiates a conversion of normal, protoplasmic astrocytes to astrocytes that display severely “reactive” characteristics, many of which may be detrimental to neighboring neurons and oligodendrocytes.
Introduction
Alexander disease (AxD) is a primary disorder of astrocytes, caused by heterozygous mutations in GFAP, which encodes the major astrocyte intermediate filament protein, GFAP. In its most severe form, this fatal neurological disease strikes infants and causes developmental retardation and seizures (Messing et al., 2012). Astrocytes in AxD are greatly enlarged and accumulate massive amounts of GFAP, some of which resides in Rosenthal fibers, cytoplasmic protein inclusions of which GFAP and small heat shock proteins are major constituents (Messing et al., 2012). Astrocytes undergo many biochemical changes, including inhibition of proteasomal activity, activation of MAP kinase stress pathways leading to the activation of JNK and p38 kinases, upregulation of small heat shock protein genes encoding αB-crystallin and Hsp27, and loss of GLT-1, a major glutamate transporter in astrocytes (Tang et al., 2006, 2008, 2010; Cho and Messing, 2009; Tian et al., 2006, 2010). Furthermore, the neuropathology of AxD includes not only marked astrocyte pathology, but also demyelination or dysmyelination and variable degrees of neuronal death, indicating that astrocyte dysfunction profoundly affects the functions and survival of both oligodendrocytes and neurons (Messing et al., 2012).
We have examined hippocampal astrocytes in three mouse models of AxD, a transgenic line (GFAPTg) in which the normal human GFAP is expressed in several copies (Messing et al., 1998), a knock-in line (Gfap+/R236H) in which one of the Gfap genes bears an R236H mutation (the mouse homolog of a common human mutation site) (Hagemann et al., 2006), and a mouse derived from the mating of these two lines (GFAPTg;Gfap+/R236H). The life spans of both the GFAPTg and Gfap+/R236H mice are normal, although they display increased sensitivity to induced seizures (Hagemann et al., 2006). The life span of the GFAPTg;Gfap+/R236H is ∼30 d, and they die with convulsive seizures (Hagemann et al., 2006). All three lines accumulate Rosenthal fibers in several brain regions, including the hippocampus (Messing et al., 1998; Hagemann et al., 2006). Since hippocampal abnormalities might result in the seizures in GFAPTg;Gfap+/R236H mice (Hagemann et al., 2006), and the hippocampus was found to be one of the most vulnerable structures, we chose to examine this area as a part of the CNS that might reproduce typical features of astrocyte pathology in AxD.
In the GFAPTg;Gfap+/R236Hmice, protoplasmic astrocytes were converted to cells that had lost their bushy morphology due to a loss of distal fine processes, lost GLT-1, a major glutamate transporter, and lost coupling through gap junctions to adjacent astrocytes. They became hypertrophic and multinucleated, increased their GFAP levels greatly, activated the mTOR pathway, and acquired CD44, a hyaluronan receptor normally found in white matter, subpial, and reactive astrocytes, but not the protoplasmic astrocytes of gray matter (Mansour et al., 1990; Girgrah et al., 1991; Akiyama et al., 1993; Shin et al., 2005; Hagemann et al., 2006; Zamanian et al., 2012). Thus, the massive accumulation of GFAP initiates a series of pathological events that change astrocyte morphologies and functions dramatically, in many ways resembling “reactive” astrocytes in other conditions.
Materials and Methods
Mice.
The mouse lines have been previously described (Messing et al., 1998; Hagemann et al., 2006) (and see Introduction). The GFAPTg line was initially generated in an FVB background, but the mice were crossed into a B6 background over at least five generations before they were used for these experiments. The Gfap+/R236H line was initially generated in mice with a B6 background. All animal use was performed under the guidelines of the Columbia University Institutional Animal Care and Use Committee.
Histology and immunohistochemistry.
Mice were anesthetized with ketamine–xylazine before intracardiac perfusion with 4% paraformaldehyde in PBS. Brains were removed and kept in the fixative for 12–16 h (4°C). Coronal sections (40 μm) were prepared with a vibratome (Leica VT1000S) and stored in cryoprotectant solution at −20°C before use.
Primary antibodies were used against: (1) markers of astroglial cells: (i) glial fibrillary acidic protein (GFAP): monoclonal (1:1000, G3893; Sigma-Aldrich), rabbit polyclonal (1:1000, Z 0334; Dako), and chicken polyclonal (1:500, PCK-591P; Covance); (ii) nestin: rabbit polyclonal (1:500, PRB-570; Covance); (iii) vimentin: goat polyclonal (1:100, sc-365088; Santa Cruz Biotechnology); (iv) glutamine synthetase (GS): monoclonal (1:1000, MAB302; Chemicon) and rabbit polyclonal (1:200, sc-9067; Santa Cruz Biotechnology); (v) astrocyte specific glutamate transporters: GLT-1 (EAAT2): mouse monoclonal (1:500, 611654; BD Transduction Laboratories); GLAST (EAAT1): rabbit monoclonal (1:200, #5684; Cell Signaling); (vi) CD44: rat monoclonal (1:150, 14-0441; eBioscience); (2) markers of the mTOR cascade activation: (i) phospho-S6 ribosomal protein [phosphorylated at Ser235/236 (p-S6(235))]: rabbit monoclonal (1:100, 4857; Cell Signaling), phospho-S6 ribosomal protein [phosphorylated at Ser240/244 (p-S6(240))]: rabbit monoclonal (1:100, 5364; Cell Signaling); (ii) phospho-4E-BP1: rabbit monoclonal (1:100, 2855; Cell Signaling); and (3) Lucifer yellow: rabbit polyclonal (1:200, A-5750; Invitrogen). Secondary antibodies included anti-mouse Alexa Fluor 488, 594, and 633; anti-chicken Alexa Fluor 488, 594, 633; and anti-rabbit Alexa Fluor 594; all from goat or donkey (1:300; Invitrogen).
For double- and/or triple-immunofluorescence, after blocking with 10% normal goat (or donkey) serum [30 min, at room temperature (RT)], free-floating sections were incubated overnight at 4°C in a mixture of primary antibodies raised in different species. For visualization, Alexa Fluor-conjugated secondary antibodies were applied for 1 h at RT. Fluorescent Nissl reagent (NeuroTrace 640/660 deep-red, 1:150, Invitrogen) was used (30 min, RT) for visualization of general histological structure in double immunostaining. DAPI (Vector Laboratories) was used with triple immunostaining. Blocking serum, primary, secondary antibodies, and fluorescent Nissl reagent were applied in 0.2% Triton X-100 in PBS. Sections for fluorescent microscopy were mounted on slides in Vectashield (Vector Laboratory). To control the specificity of immunostaining, primary antibodies were omitted and substituted with appropriate normal serum. Slides were viewed using a Nikon A1R MP confocal microscope. Three-dimensional reconstructions were generated from stacks of images with confocal microscope software NIS-Elements.
Quantitative immunohistochemical analysis.
Double or triple immunostained slices for nestin, pS6, and GFAP were used for quantification of the number of reactive astrocytes in CA1 stratum radiatum (str. rad.) at 4 weeks of age. Quantitation was performed of the images merged from stacks of six adjacent images (1024 × 1024 pixel resolution, observed area 644 × 644 μm) captured at a distance of 0.5 μm from each other. Only cells with clearly outlined nuclei (stained with Nissl or DAPI) were taken into consideration. For analysis of GLT-1 and CD44, immunostaining images were obtained from CA1 str. rad. and the adjacent stratum lacunosum-moleculare (str. lac-mol.). Merged images from three adjacent optical slices {[1024 × 1024 pixel resolution, observed area 57 × 57 μm [this size corresponds to the diameter of an astrocyte domain in rodents (Oberheim et al., 2006); selection of images was done randomly and included cell bodies and neuropil]} acquired at a distance of 0.25 mm from each other. Images were transferred to Adobe Photoshop (version 7.0), grayscaled, and used for analysis of optical density (OD) with Scion Image Beta 4.02 (public domain).
Quantification of Ki67-immunopositive astrocytes was done on images obtained from sections double immunostained for GFAP and Ki67 taken from different rostrocaudal levels of hippocampi (5 slices from each animal, 4 animals in each age group). Merged images from eight adjacent optical slices (step 0.5 μm, 1024 × 1024 pixel resolution, observed area 295 × 295 μm) were taken from str. rad of CA1, str. lac-mol., and stratum moleculare (str. mol.) of the dentate gyrus and used for quantification. Only cells with well outlined nuclei (stained with Nissl reagent) were considered as reliable for counting.
Electrophysiological recording in acute mouse brain slices.
The mouse brain coronal slices (160–180 μm) were cut with a Vibratome (LEICA VT 1000S) in ice-cold oxygenated-modified artificial CSF (aCSF) (in mm): 125 NaCl, 2.5 KCl, 2 CaCl2, 1.5 MgCl2, 1.25 NaH2PO4, 26 NaHCO3, and 10 Dextrose. The slices recovered at 30°C in a chamber for at least 1 h before electrophysiological recording. The above solution was also used for whole-cell patch-clamp recording in brain slices at 30°C. The bath solution was applied at a flow rate of 1.5 ml/min using the VC-6 perfusion valve control system (Warner Instruments) with the TC-344B temperature controller. Cells were visualized under a LEICA DMLFS microscope with a 63× water-immersion lens. The intracellular solution in the patch pipettes contained the following (in mm): 140 KCl, 1 MgCl2, 10 EGTA, 10 HEPES, 3 MgATP, 0.3 Na2ATP, pH 7.3 with KOH. Tetrodotoxin (TTX, 1 μm; Sigma) was applied in the bath solution to block sodium channels. 3-(2-Carboxypiperazin-4-yl) propyl-1-phosphonic acid (40 μm; CPP, Sigma) and 1,2,3,4-tetrahydro-6-nitro-2,3-dioxo-benzo[f]quinoxaline-7-sulfonamide (NBQX, 50 μm; Sigma) were also applied to the bath solution to block NMDA receptors and AMPA receptors, respectively. Pipette resistance was ∼3–5 MΩ. Cell capacitance and series resistance were measured using the software MultiClamp 700A Commander Ver. 1.1.2.27 and pClamp 8 (Axon Instrument, Molecular Devices). l-glutamic acid sodium salt (10 mm; Sigma) or potassium chloride (30 mm; Sigma) in CSF were applied focally on the recording cells using a pressure perfusion system (pressure system IIc, Toohey Company) to assess glutamate transporter function or potassium uptake efficiency. Cells were initially identified morphologically based on the sizes and shapes of their somas and the architecture of their processes. The majority of the astrocytes from which we recorded were located in the str. lac-mol. For analysis of cell morphology and gap junction coupling with the surrounding cells, Lucifer yellow (LY, Sigma-Aldrich) was added to the intracellular solution (final concentration 0.1%) and filtered through a 0.2 μm PTFE filter. After the experiment, slices were immersed in fixative (4% paraformaldehyde in PBS) and kept overnight at 4°C. Slices were immunostained, and observed under a confocal microscope, as above.
Western blotting.
Hippocampi were removed under a dissecting microscope and the tissue either frozen on dry ice and then stored at −80°C until use or lysed directly in ice-cold tissue lysis buffer (Invitrogen, # FNN0011) supplemented with 0.001 m PMSF, protease (complete, mini, EDTA-free Roche) and phosphatase inhibitors (HALT, Thermo Scientific) and SDS to 2%. After mechanical homogenization, tissue was left on ice for 45 min with periodic additional homogenization, then sonicated twice for 3 s, and spun at 14,000 RPM for 10 min. Protein concentration in the supernatant was determined with Pierce 660 nm reagent (Thermo Scientific) supplemented with Ionic compatibility reagent (Thermo Scientific) as per manufacturer's instructions. Proteins (55 μg/lane for CD44 and GLT-1 gels and 10 μg/lane for GFAP) in LDS sample buffer (Invitrogen) under reducing conditions were subjected to SDS-PAGE electrophoresis using NuPage 4–12% Tris-Bis gels and MES buffer (Invitrogen) and then transferred to nitrocellulose membranes (GE Lifesciences). Membranes were blocked with 5% skim milk in TBS (50 mm Tris-HCl, pH 7.5, 150 mm NaCl) for 1 h at RT and then incubated overnight at 4°C in 5% skim milk with 0.1% Tween 20 in TBS (TBS-T buffer) with each of the following primary antibodies: rat anti-CD44 (IM7) (1:4000), anti-rabbit GFAP (1:10,000), and anti-mouse GAPDH (1:3000 EMD Millipore). Blots were washed 3× in TBST and then incubated in primary blocking solution with fluorescent-conjugated anti-rat, anti-rabbit, or anti-mouse secondary antibodies (1:15,000, Li-Cor) for 1 h at RT in the dark. Visualization of bands on membranes was performed using an Odyssey Infrared Scanner, ver. 2.1 (Li-Cor) and optical density was quantified and analyzed using Odyssey version 2.1 software. Band intensities for the protein of interest were normalized within gels using GAPDH and between gels using a common homogenate of WT mouse brain lysate. Optical density is expressed in arbitrary units.
Statistical analysis.
Data are expressed as mean ± SEM. Student's t test, two-way ANOVA for multiple groups, with Tukey test, and Pearson correlation coefficient were used as appropriate. p < 0.05 was considered significant.
Results
Evolution of astrocyte changes in GFAPTg;Gfap+/R236H hippocampi
GFAP
The accumulation of GFAP is considered the major triggering factor in the development of astrocyte pathology in AxD (Messing et al., 2012). To study the evolution of astrocyte changes, we compared the distribution and levels of GFAP in hippocampi of 1, 2, and 4 week-old GFAPTg;Gfap+/R236H mice with wild-type (WT) mice. We found marked pathological changes even during such a short time interval. In WT hippocampus at 1 week of age, GFAP immunostaining was confined largely to the str. lac-mol., and little immunoreactivity was present in the str. rad., which contains the dendrites of the CA1 pyramidal cells, or the stratum moleculare (str. mol.) of the dentate gyrus, which contains the dendrites of granule cells (Fig. 1A). GFAP immunostaining of the hippocampus in 4-week-old WT mice showed more GFAP signal in the str. rad. than at 1 week, but all astrocytes displayed a normal appearance, with thin, GFAP+ proximal processes (Fig. 1A).
Figure 1.
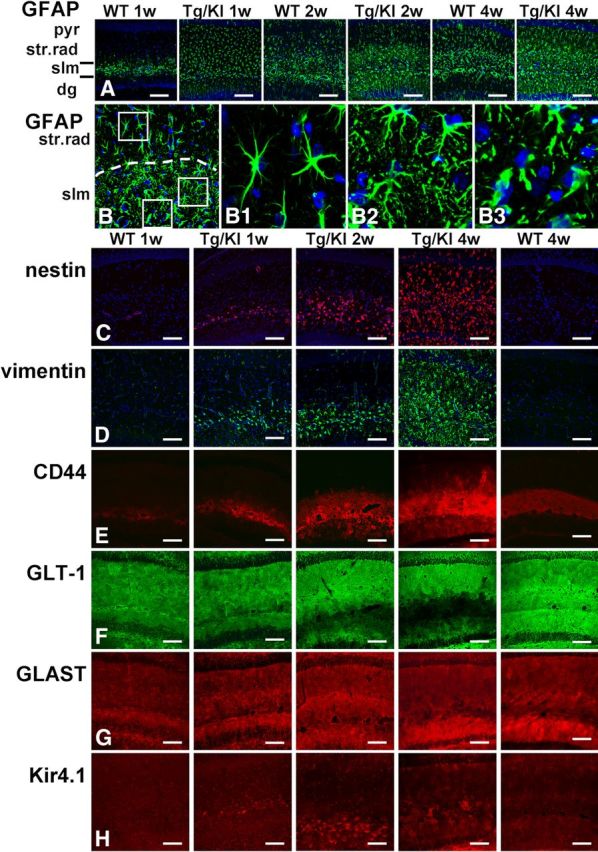
Progressive accumulation of astrocytic pathology in GFAPTg;Gfap+/R236H (Tg/KI) hippocampus at 1, 2, and 4 weeks of age compared with normal astrocyte development in wild-type (WT) mouse hippocampus. Immunostaining in A and B, GFAP; C, nestin; D, vimentin; E, CD44; F, GLT-1; G, GLAST; H, Kir4.1 immunostaining. A, Progressive increase of GFAP immunoreactivity, first in str.lac-mol (slm) and then in str. rad and str. mol is much more prominent in Tg/KI than in WT hippocampi. B, Layer-specific differences in astrocyte morphology in 2-week-old Tg/KI hippocampus. The border between slm and str.rad is dotted. Note that in str.rad (upper boxed area, enlarged in B1), astrocytes have only a slightly thickened appearance, whereas in the slm they have more complex profiles and many thin processes filled with GFAP (middle boxed area, enlarged in B2); in the outer part of the slm, many swollen astrocytes with thick proximal processes are present (lower boxed area, enlarged in B3). Confocal microscopy; pyr, pyramidal cell layer; str.rad, stratum radiatum; slm, stratum lacunosum-moleculare; dg, dentate gyrus. Scale bars: A, 130 μm; B, 70 μm; C–H, 110 μm.
In contrast, by 1 week of age in the GFAPTg;Gfap+/R236Hmice, astrocytes in all hippocampal layers displayed strong GFAP immunostaining, the highest in the str. lac-mol. (Fig. 1A). By 2 weeks, GFAP immunostaining had increased further (Fig. 1A,B). Astrocytes in the str. lac-mol. now appeared enlarged, with thick, short, primary processes (Fig. 1B,B3). In the upper part (near str. mol) of str.lac-mol, astrocytes displayed uneven, processes (Fig. 1B2). Furthermore, large numbers of small, dot-like, GFAP+ structures had appeared in the neuropil between astrocytes, reflecting the presence of GFAP in small astrocyte processes (compare Fig. 1B1,B2). Astrocytes in the str. rad. near the pyramidal cell layer appeared enlarged (Fig. 1B1) but did not display severe changes. Thus, there appeared to be a gradient of pathology, most severe in the str. lac-mol. and least severe in the str. rad. By 4 weeks of age, these changes had become even more pronounced (Fig. 1A) and abnormal astrocytes were present in all layers. Thus, the accumulation of GFAP in the GFAPTg;Gfap+/R236Hhippocampus followed the normal developmental evolution of GFAP in the WT hippocampus (str. lac-mol. first, then str. rad. and str. mol.) but was much more rapid and reached much greater levels than in the WT hippocampus.
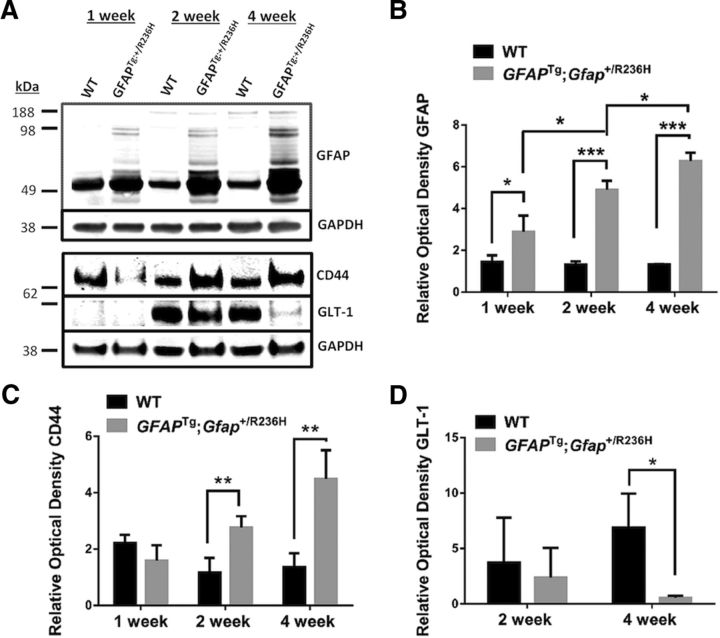
The increase in GFAP immunostaining was mirrored in the increased amount of GFAP, as determined by Western blot (Fig. 2A,B). Note the increase in more slowly moving GFAP reactive bands in the GFAPTg;Gfap+/R236H hippocampus. These reflect ubiquitinated GFAP and higher levels of oligomers (Tang et al., 2006, 2008, 2010).
Figure 2.
Increased protein levels of GFAP and CD44 and decreased GLT-1 in the hippocampus of GFAPTg;Gfap+/R236H (Tg/KI) mice compared with the hippocampus of WT mice. A, Western blot analysis of GFAP (10 μg of total protein load/lane), CD44 (55 μg/lane), and GLT-1 (55 μg/lane) in hippocampi of 1, 2, and 4 week WT and GFAPTg;Gfap+/R236H (Tg/KI) mice. GAPDH is assessed as a loading control. B–D, Quantitation of GFAP (B), CD44 (C), and GLT-1 (D) levels on Western blots based on optical densities normalized to the level of GAPDH. Note that for the GFAP, we scanned all immunoreactive bands, not only the main band at 50 kDa. Data are mean ± SEM of 3 (GFAP) or 4 (GLT-1 and CD44) independent experiments. Two-way ANOVA with Tukey test; *p < 0.05, **p < 0.005, ***p < 0.0005. Only significant differences are marked on the graphs.
Other intermediate filaments, vimentin and nestin
Vimentin and nestin are widely expressed in the immature nervous system; in adult brain, high expression of these proteins is a specific feature of reactive astrocytes appeared after various brain insults (Ridet al., 1997; Sofroniew and Vinters, 2010). In WT hippocampi, astrocytes did not show immunoreactivity for either protein over the 1–4 week postnatal time (Fig. 1C,D). In the GFAPTg;Gfap+/R236H hippocampus, however, both proteins were found in astrocytes beginning at 1 week in the str. lac-mol. and then in astrocytes throughout all subfields (Fig. 1C,D). This progression mirrored that of the aberrant astrocytes shown above with GFAP immunostaining. Both nestin and vimentin labeling were confirmed to be astrocytic by double immunolabeling with GFAP (data not shown).
Plasma membrane proteins (CD44, GLT-1, GLAST, and Kir4.1)
The progression of astrocyte pathology could also be clearly visualized by the analysis of plasma membrane proteins. We initially looked at the localization of CD44, a hyaluronan receptor expressed in white matter and subpial astrocytes in the normal CNS (Akiyama et al., 1993; Cargill et al., 2011). At 1 week of age in both WT and GFAPTg;Gfap+/R236Hmice CD44+ immunostaining predominated in the str. lac-mol. (Fig. 1E). In WT mice CD44 immunostaining remained within the borders of the str. lac-mol. at all time points (shown in Fig. 1E at 1 and 4 weeks, and remained in this stratum up to 1.5 years of age, the oldest mice examined, data not shown). In contrast, by 2 weeks of age in the GFAPTg;Gfap+/R236H mice, astrocytes positive for CD44 had begun to appear outside of the str. lac-mol. and by 4 weeks, CD44 immunostaining occupied most of the str.rad and the str. mol. (Fig. 1E). Western blotting for CD44 showed an increase in the level of the protein over the 4 weeks (Fig. 2A,C).
Immunostaining for GLT-1 and GLAST, the astrocyte-specific glutamate transporters, showed a diffuse pattern throughout all layers in WT hippocampus at every studied time (from 1 week to 1.5 years) (Fig. 1F,G, shown only at 1 and 4 weeks). In the GFAPTg;Gfap+/R236H hippocampus, in contrast, there was a progressive decline in GLT-1 immunostaining from 2 to 4 weeks (Fig. 1F). The decline appeared to begin in the str. lac-mol. and then spread into the str. rad. and str. mol. Western blot analysis of total hippocampus showed a significant difference in GLT-1 between 4-week-old GFAPTg;Gfap+/R236 and WT mice (Fig. 2A,D). GLT-1 levels increased in WT mice from 2 to 4 weeks, but failed to do so in the GFAPTg;Gfap+/R236Hmice.
Kir4.1 is a member of inward rectifier-type potassium channel family responsible for K+ clearance from the extracellular milieu due to a higher propensity for K+ uptake than for release at a normal range of resting membrane potential. Immunostaining for Kir4.1 in WT mice displayed moderate gradual increase from minimal and homogeneous in 1- and 2 week-old animals to more intense and less equal even in neighboring astrocytes in 4 weeks (Fig. 1H). Preabsorption of antibody with the peptide completely abolished immunostaining (data not shown). A striking feature of Kir4.1 immunostaining in GFAPTg;Gfap+/R236H mice was a high intensification in the immunolabeling only of some astrocytes. At 1 week, high immunostaining for Kir4.1 was observed only in a few astrocytes in the str. lac-mol. (Fig. 1H). In 2 weeks, additionally some aberrant astrocytes displayed high staining in the str.lac-mol. and str.mol. (Fig. 1I), and in 4 weeks, such astrocytes appeared in str.rad. (Fig. 1H).
A remarkable feature of the astrocyte populations in the GFAPTg;Gfap+/R236H mice was their phenotypic heterogeneity on a microscopic scale. Even neighboring astrocytes in one layer differed in their immunomarker profiles (Fig. 3A–E). For example, a GLT-1+ astrocyte could reside adjacent to a GLT-1-negative astrocyte and a CD44+ astrocyte could appear adjacent to a CD44-negative astrocyte (Fig. 3A,B,E). Examination of WT hippocampi did not reveal any such heterogeneity, and thus it is not a feature of the normal hippocampal astrocyte population.
Figure 3.
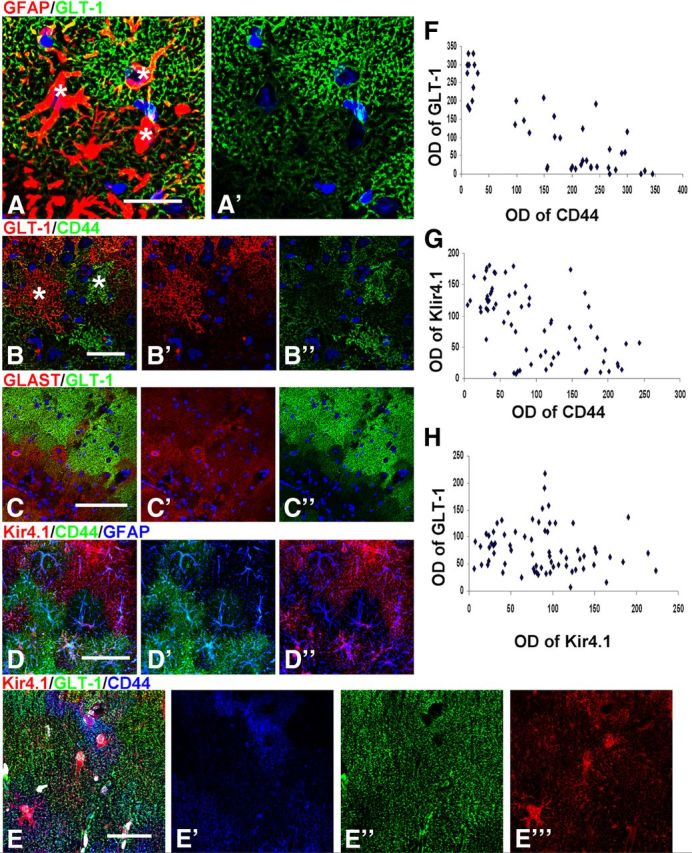
Microheterogeneity in immunohistochemical patterns of CD44, GLT-1, GLAST, and Kir4.1 in GFAPTg;Gfap+/R236H mouse hippocampus. A, Variability of GLT-1 immunostaining in adjacent astrocytes in the str. lac-mol. at 4 weeks; * denote locations of astrocyte nuclei (compare with Nissl); B, GLT-1 level is minimal in cells with high immunostaining for CD44; C, GLAST is present in some astrocytes without GLT-1 immunoreactivity. D, Focal diversity in the levels of CD44 and Kir4.1 immunoreactivity. Note that astrocytes with high CD44 immunoreactivity do not also have high Kir4.1 immunolabeling. E, Triple immunostaining for Kir4.1, GLT-1, and CD44 displays variable pattern of immunolabeling in neighboring astrocytes. Confocal microscopy; scale bars, 95 μm. F–H, Graphs representing optical density readings of CD44 versus GLT-1, CD44 versus Kir4.1, and Kir4.1 versus GLT-1 immunofluorescence, respectively. Note that inverse correlation is significant in F (strong: r = 0.854, p < 0.001) and G (weak: r = −0.573; p < 0.001); in H, there is no correlation between parameters (r = −0.156; p = 0.196).
We looked for correlates between these various phenotypic changes. The decline of GLT-1 appeared inverse to that of the increasing CD44 (Fig. 1E,F). Quantitative analysis of CD44 and GLT-1 immunoreactivity in 4 week GFAPTg;Gfap+/R236H hippocampus based on optical density readings of immunofluorescence-staining in the str. rad. and str. lac.-mol. showed a significant inverse correlation (r = 0.854, p < 0.001) (Fig. 3F). That is, as CD44 increased, GLT-1 decreased. GLAST did not show a similar profound diminution in immunolabeling and many astrocytes devoid of GLT-1 immunoreactivity were GLAST+ (Fig. 3C). Quantification of the optical density of fluorescence showed a significant inverse correlation between Kir4.1 and CD44 immunolabeling (r = −0.573; p < 0.001) (Fig. 3G) but an absence of correlation between Kir4.1 and GLT-1 (r = −0.156; p = 0.196) (Fig. 3H).
mTOR pathway activation
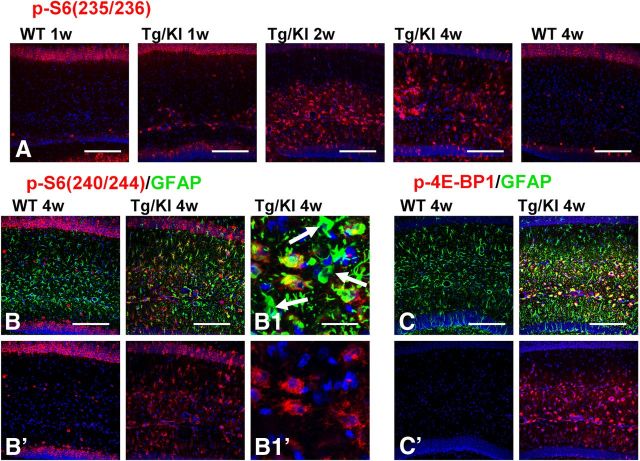
The activation of the mTOR cascade is a characteristic feature of acutely reactive astrocytes in other brain pathologies (Codeluppi et al., 2009; Park et al., 2012). Thus, we looked for mTOR activation by immunostaining hippocampal sections with antibodies to p-S6 and p-4E-BP1, downstream substrates and effectors of mTOR activation. To dissect two pathways participating in the phosphorylation of S6, we used two types of antibodies: p-S6(240/244), specific for the mTOR pathway, and p-S6(235/236), which might indicate involvement of p90 kinase of the MAPK pathway (Anjum and Blenis, 2008). In WT hippocampus, astrocytes did not show immunoreactivity for these antibodies at 1 or 4 weeks (Fig. 4A,B). In contrast, immunostaining of the GFAPTg;Gfap+/R236H hippocampus revealed a marked increase in the numbers of p-S6+ astrocytes from 1 to 4 weeks of age [Fig. 4A,B, time dependence shown only for p-S6(235/236)]. A similar pattern of immunoreactivity in GFAPTg;Gfap+/R236H astrocytes was observed for p-4E-BP1 (Fig. 4C, shown only for the 4-week-old mouse). We also noted that some of the markedly enlarged astrocytes at 4 weeks in the str.lac-mol. revealed minimal or absent p-S6 immunostaining (Fig. 4B1,B1′).
Figure 4.
mTOR cascade components in GFAPTg;Gfap+/R236H (Tg/KI) and WT mice. A, Progressive accumulation of p-S6 (235/236) immunopositive astrocytes in Tg/KI from 1 week to 4 weeks. Note that 1 week and 4 week WT astrocytes do not show p-S6 immunoreactivity; the immunopositive cells in str.rad and str.lac-mol in the WT hippocampus are interneurons, and the pyramidal neurons are also positive. B, Positive immunostaining with p-S6(240/244) of astrocytes in GFAPTg;Gfap+/R236H but not in the WT mouse. B1, Note that some enlarged astrocytes with high levels of GFAP do not show p-S6 immunolabeling (arrows). C, Expression of 4E-BP1 and GFAP in WT and GFAPTg;Gfap+/R236H mice. Confocal microscopy. All scale bars 125 μm, except B1 and B1′ (35 μm).
Aberrant morphological features and multinucleation in AxD astrocytes
We observed highly unusual astrocytes in the str.lac-mol. of GFAPTg;Gfap+/R236H mice. Aberrant astrocyte morphology was especially well visualized when cells were filled with LY during electrophysiological recording: large perikarya gave rise to short primary processes possessing only few thin secondary/tertiary branches that were themselves devoid of the miniature leaf-like processes of normal protoplasmic astrocytes (Fig. 5A). Thus, these cells were drastically altered from the bushy, protoplasmic astrocytes that normally populate the str.lac-mol.
Figure 5.
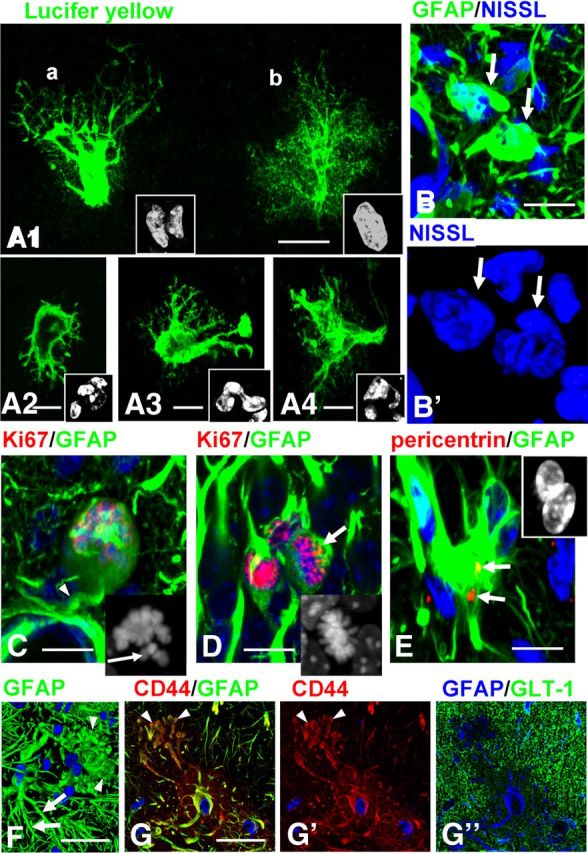
Abnormal morphology of astrocytes in GFAPTg;Gfap+/R236H mouse hippocampus. A1–A4, Aberrant types of astrocytes visualized with Lucifer yellow (LY) filling during electrophysiological recording in the str.lac-mol in 4 week GFAPTg;Gfap+/R236H mice. Note that astrocytes depicted in A1(a) and A2–A4 lack fine peripheral processes, and therefore their profiles are clearly outlined and display nuclear abnormalities. The astrocyte depicted in A1(b) still retains a bushy appearance and a single nucleus. Cell nuclei are shown in insets. B, Aberrant astrocytes (arrows) have multilobulated nuclei in 4 week GFAPTg;Gfap+/R236H mouse. B', Two-dimensional projection of 3D reconstruction of nuclei. C, Arrested mitosis of astrocyte in 2 week GFAPTg;Gfap+/R236H mouse. Note rounded perikaryon lacking primary processes except one forming a perivascular endfoot (arrow). Inset, Unaligned chromosomes in this cell, marked with arrow. D, Normal metaphase of astrocyte (arrow) in 2 week GFAPTg;Gfap+/R236H mouse. Note that nuclei in two neighboring astrocytes are Ki67+ (not in metaphase). Inset, Metaphase chromosomes are congregated in compact group. E, An astrocyte with two nuclei (shown in the inset) has two centrioles (arrows). F, An astrocyte with enlarged, bulbous-like tips of processes (arrowheads). Note that a neighboring astrocyte has more normal long and tapered processes (arrows), immunostained for GFAP (2D projection of 3D reconstruction). G, An astrocyte with similar changes of processes as in F; CD44 immunostaining clearly outlines the bulbous-like profiles of processes (arrows). Note a low level of GLT-1. G, G', and G” are split channel images from a triple-stained slice counterstained with DAPI. Confocal microscopy; scale bars: A1–4, 15 μm; B, 10 μm; C, D, 20 μm; E, 15 μm; F, 20 μm; G, 15 μm.
Nuclei in these abnormal astrocytes were irregular in shape and often lobulated; many cells had several nuclei (Fig. 5A,B). Multinucleated astrocytes, which are typical for AxD (Messing et al., 2012), have been described in various brain pathologies associated with severe astrogliosis and considered as a result of arrested mitoses (Diemer and Klinken, 1976). We assessed this issue and found that some appeared to be arrested in metaphase, with unaligned chromosomes (Fig. 5C, compare with normal metaphase in D, arrow). Furthermore, astrocytes with abnormal nuclei had two centrioles visualized with pericentrin (Fig. 5E), an observation that suggests unfulfilled cytokinesis in the cells, a characteristic result of arrested mitosis (Rieder and Maiato, 2004). We observed multinucleated astrocytes as early as 1 week of age and their numbers increased over the next 3 weeks.
The processes of some astrocytes in the 4 week GFAPTg;Gfap+/R236H ended with large, bulbous-like structures filled with GFAP (Fig. 5F); these processes were in striking contrast with the tapered processes typical for normal astrocytes (Fig. 5F). Because CD44 expression was high in such cells, CD44+ immunostaining outlined these unusual cellular profiles clearly and confirmed the drastic changes in shape (Fig. 5G).
Astrocyte cycling in GFAPTg;Gfap+/R236H
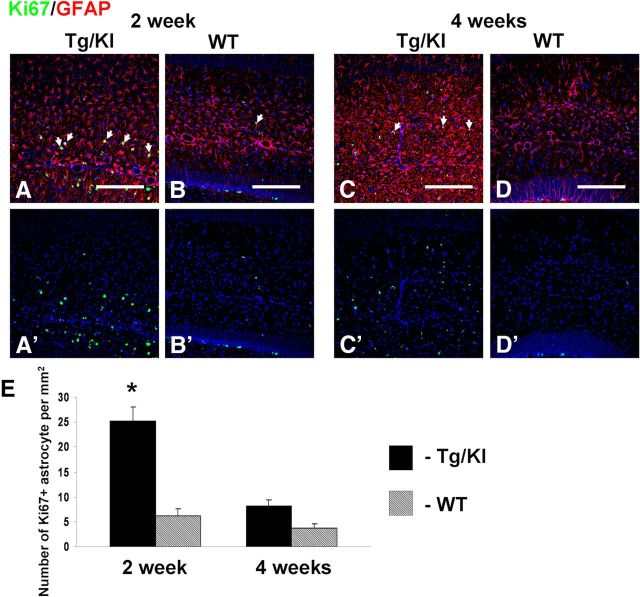
We examined cell cycling with Ki67 immunolabeling, comparing 2 and 4 week GFAPTg;Gfap+/R236Hand WT mice. Significant increases in astrocyte proliferation was found in the GFAPTg;Gfap+/R236H mice (Fig. 6). It should be noted that other, not identified cell types (probably NG2+ cells and microglia) also revealed strong activation of cycling in the GFAPTg;Gfap+/R236H mice, although we did not explore that by immunolabeling. Ki67+ cells were also observed in subgranular layer of dentate gyrus but they were not a focus of the present study.
Figure 6.
Astrocyte proliferation in GFAPTg;Gfap+/R236H (Tg/KI) mice at 2 (A) and 4 weeks (C). WT reveals fewer Ki67+ cells at the same ages (B and D, respectively). Ki67+ astrocytes are marked with arrows. Confocal microscopy. A'–D', Split channel for Ki67 of A–D images. Scale bars, 200 μm. E, Graph showing quantitative evaluation of numbers of Ki67+ astrocytes. *Significant difference. Two-way ANOVA, Tukey's test.
Physiological changes in astrocytes
All astrocytes recorded in the GFAPTg;Gfap+/R236H mice were subdivided into two groups based on post hoc morphological evaluation (immunoreactivity for GFAP and LY cell filling): (1) severe changes (fewer small processes, enlarged cell bodies, high level of GFAP immunostaining) and (2) mild changes (normal bushy-like protoplasmic morphology, low GFAP levels) (see Fig. 8 for examples). We should be noted that all of the astrocytes from which we recorded in the GFAPTg;Gfap+/R236H mice differed from astrocytes in WT mice so we could not compose a group of normal-like astrocytes studied in GFAPTg;Gfap+/R236H mice. This might be because of the initial selection of astrocytes for electrophysiological recording that was aimed at more changed cells (enlarged cell body, higher contrast in DIC microscope).
Figure 8.
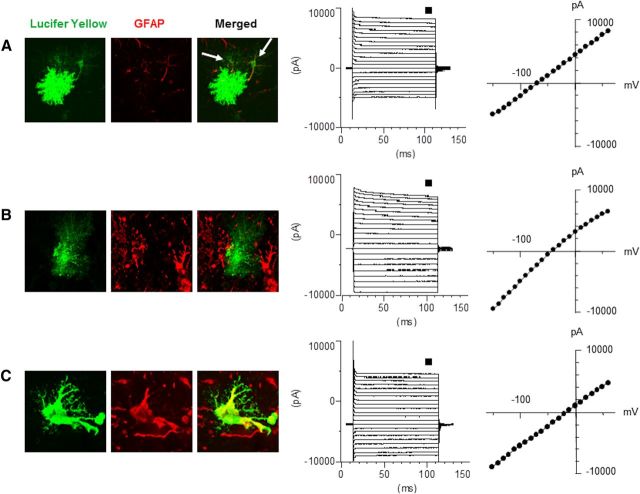
Gap junction coupling and voltage-current relationship in astrocytes from 4-week-old WT (A) and GFAPTg;Gfap+/R236H mice (B, mild morphological changes; C, severe morphological changes). Note that normal astrocytes are coupled (arrows in A depict neighboring astrocytes into which Lucifer yellow diffused), whereas GFAPTg;Gfap+/R236H astrocytes are not coupled with adjacent cells and display a high level of GFAP immunostaining only in drastically changed cells (C). The membrane holding potential was set at −70 mV. The current was evoked by a step voltage protocol (from −160 to +60 mV in 10 mV increments, 100 ms duration). The current–voltage (I–V) curves were obtained from the measurements near the end of each voltage step (small square). All three groups of astrocytes display passive membrane properties with linear current-voltage curves. Note that reversal potential is significantly shifted toward sodium equilibrium in the AxD mouse astrocytes.
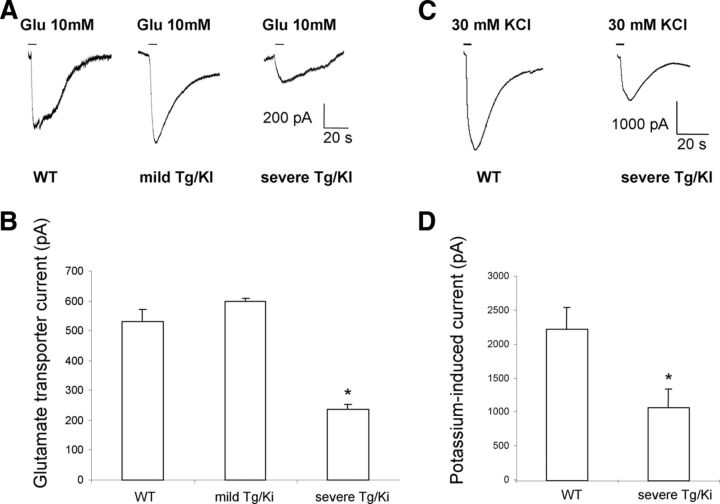
Passive membrane properties of GFAPTg;Gfap+/R236H and WT astrocytes are presented in Table 1. Astrocytes with severe morphological changes in the GFAPTg;Gfap+/R236H had significantly lower resting membrane potentials (RMP), but capacitance and input resistance did not differ significantly from those in WT astrocytes. These astrocytes displayed significantly reduced glutamate-induced current, which indicates a reduced ability for glutamate uptake (Table 1; Fig. 7). Those astrocytes in GFAPTg;Gfap+/R236H hippocampus that displayed only mild changes did not show significant diminution of glutamate uptake or RMP.
Table 1.
Physiological changes in AxD astrocytes
| Astrocyte type | Resting membrane potential (mV) | Capacitance (pF) | Input resistance (MW) |
|---|---|---|---|
| Severe changes (Tg/KI) n = 18 | −36.9 ± 4* | 77 ± 8.5 | 4.6 ± 1 |
| Mild changes (Tg/KI) n = 4 | −74 ± 2.5 | 53.9 ± 12.3 | 6.8 ± 1.7 |
| WT n = 12 | −75.1 ± 2.2 | 64.8 ± 9 | 6.4 ± 0.8 |
Figure 7.
Astrocyte glutamate (A, B) and potassium (C, D) uptake are compromised in the str. lac-mol. in the GFAPTg;Gfap+/R236H (Tg/KI) mice compared with WT. A, Representative inward current traces induced with 10 mm glutamate (Glu) at holding potential −70 mV obtained in WT and GFAPTg;Gfap+/R236H mice. B, Significant reduction of glutamate-induced inward current was observed only in severely changed astrocytes (n = 7), whereas mildly changed astrocytes (n = 4) do not differ from cells in WT mice (n = 6). *p < 0.05, two-way ANOVA, Tukey's test. C, Representative current traces induced with local application of 30 mm potassium at holding potential −70 mV in WT and GFAPTg;Gfap+/R236H mice. D, Significant decline in potassium uptake in GFAPTg;Gfap+/R236H (n = 11) versus WT (n = 6) mice. *p < 0.05, Student's t test. Small horizontal bars in A and C indicate the time of glutamate and potassium application, respectively.
The ability of astrocytes to take up potassium at high external potassium concentration was also significantly diminished in GFAPTg;Gfap+/R236H mice. In this experiment, all recorded cells in GFAPTg;Gfap+/R236H corresponded to severely changed astrocytes so only two groups (GFAPTg;Gfap+/R236H and WT) are shown (Fig. 7).
A prominent feature of astrocytes in GFAPTg;Gfap+/R236H was a loss of intercellular gap junction coupling as visualized with LY injections at the time of intracellular recording. In WT mice the dye spread into adjacent astrocytes (6 cells from a total of 9 recorded showed dye coupling to the surrounding astrocytes), whereas none of the astrocytes from the GFAPTg;Gfap+/R236H mouse filled with LY was coupled to any adjacent cells (Fig. 8).
It is worth noting that all astrocytes recorded at 4 weeks of age in the WT and GFAPTg;Gfap+/R236H mice displayed passive voltage-current relationships with low input membrane resistance, typical membrane properties of mature astrocytes (Schools et al., 2006) (Fig. 8).
GFAPTg and Gfap+/R236H mice display astrocyte pathology similar to that in the GFAPTg;Gfap+/R236H, but the changes evolve much more slowly
We compared hippocampi of the GFAPTg;Gfap+/R236H at 4 weeks of age with those of age-matched GFAPTg and Gfap+/R236H littermates. In line with previous reports (Messing et al., 1998; Hagemann et al., 2006), many astrocytes in the hippocampi in the GFAPTg and Gfap+/R236H lines displayed high levels of GFAP, as judged by immunostaining, although the GFAP+ astrocytes in both were less widely distributed than in the GFAPTg;Gfap+/R236H mice and were confined mostly to the str. lac-mol. (Fig. 9). The astrocytes in the GFAPTg and Gfap+/R236H mice accumulated vimentin, nestin, and CD44 (vimentin not shown) and displayed decreased levels of the glutamate transporter, GLT-1, and increased staining for Kir4.1 in scattered cells (Fig. 9). Many of the astrocytes were p-S6+. Immunostaining for GLAST showed a homogeneous pattern throughout the hippocampal subfields that appeared to remain in a WT pattern in all of the AxD mouse models (data not shown). In the 4-week-old GFAPTg and Gfap+/R236H mice, reactive-like astrocytes were observed mainly in the str. lac-mol., thus similar to the pattern in GFAPTg;Gfap+/R236H mice younger than 2 weeks. Furthermore, we counted the numbers of reactive astrocytes, based on nestin and p-S6 immunostaining and found that in the CA1 str.rad the number of reactive astrocytes in the GFAPTg;Gfap+/R236H mice significantly outnumbered those in GFAPTg and Gfap+/R236H mice at 4 weeks (Fig. 9). Thus, both the GFAPTg and Gfap+/R236H mice showed pathological changes similar to but less severe than those in the GFAPTg;Gfap+/R236H mice.
Figure 9.
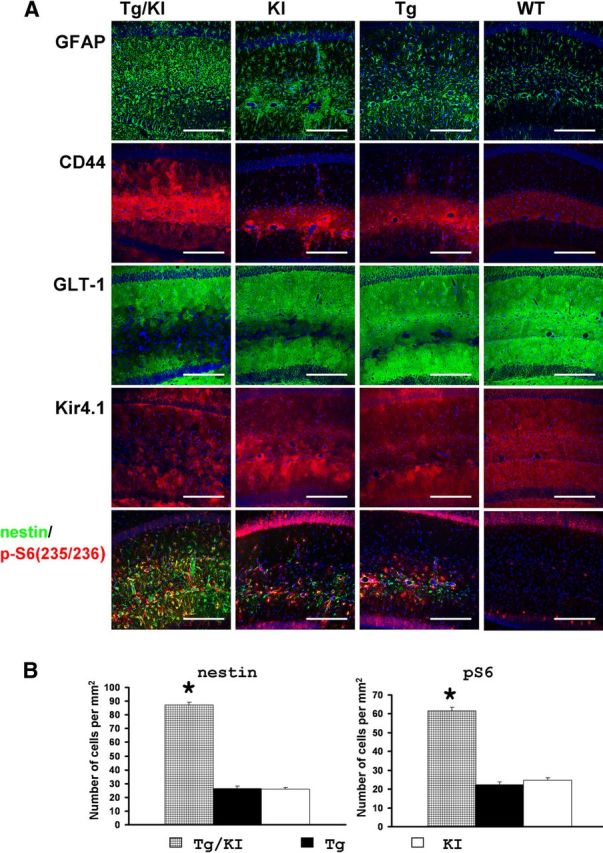
A, Immunohistochemical profile of hippocampal astrocytes in GFAPTg;Gfap+/R236H (Tg/KI), Gfap+/R236H(KI), GFAPTg (Tg), and WT mice at 4 weeks of age. Note that in GFAPTg;Gfap+/R236H mice, astrocytes with reactive-like phenotype occupy most of the CA1 str.rad., whereas in Gfap+/R236H and Tg they are located mainly in str.lac-mol. Pathology in the Gfap+/R236H GFAPT mice is more severe than in WT, but not as severe as the GFAPTg;Gfap+/R236H. Confocal microscopy; scale bars, 185 μm. B, Quantitation of the number of nestin+ and p-S6+ reactive astrocytes in the CA1 str.rad. in the three AxD lines at 4 weeks. The number of reactive astrocytes in GFAPTg;Gfap+/R236H is significantly higher than in GFAPTg and Gfap+/R236H. One-way ANOVA with Tukey's test, p < 0.001. The WT hippocampus did not show any nestin+ or p-S6+ astrocytes (data not shown and not included in statistical analysis).
To ask whether the astrocyte pathology in the GFAPTg and Gfap+/R236H mice continued to evolve, we examined hippocampi of 1-year-old GFAPTg and Gfap+/R236H mice. There were many astrocytes with a reactive phenotype in both lines, distributed in all hippocampal layers (Fig. 10A,B). We also observed the same micro-heterogeneity in astrocytes of the GFAPTg and Gfap+/R236H mice that was present in the GFAPTg;Gfap+/R236H (illustrated for cortex and hippocampus in GFAPTg in Fig. 10C, and hippocampus for Gfap+/R236H in Fig. 10D). In addition, as observed in the GFAPTg;Gfap+/R236H mice, many of the astrocytes displayed an abnormal shape (enlarged cell bodies and long, thick processes) with focal aggregations of GFAP (Fig. 10E). Many were multinucleated with micronuclei (Fig. 10E1,E2). Thus, the astrocyte pathology in the GFAPTg and Gfap+/R236H mice continued to evolve, indicating ongoing transitions of protoplasmic astrocytes into pathological forms.
Figure 10.
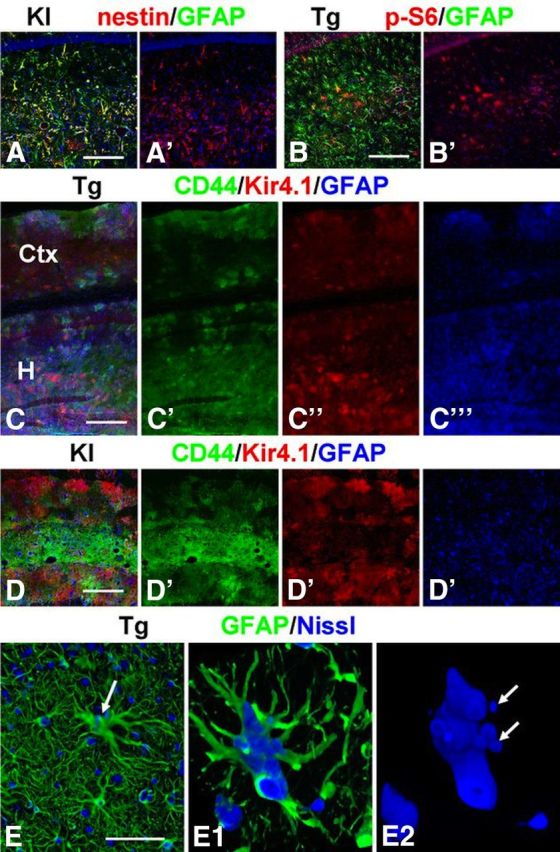
Heterogeneity of astrocytes in hippocampi of adult, 1-year-old Gfap+/R236H (A, D) and GFAPTg (B, C) mice. Note variability in the expression of nestin and p-S6 (235/236) among hippocampal astrocytes in A and B. C, D, Mosaic pattern of immunoreactivity for CD44, Kir4.1, and GFAP in hippocampus (H) and neocortex (Ctx) in the GFAPTg mouse (C) and hippocampus in Gfap+/R236H mouse (D). E, Hypertrophied astrocyte (arrow) in GFAPTg hippocampus with long thick processes and several nuclei, some of which are micronuclei. E1, E2, Three-dimensional reconstruction of hypertrophic astrocyte; E2 shows only the nuclei. Confocal microscopy, Scale bars: A, B, 180 μm; C, 220 μm; D, 200 μm; E, 50 μm.
Astrocyte pathology is widespread in the GFAPTg;Gfap+/R236H brains
In the present study our main attention was focused on the hippocampus. Nevertheless, it is worth noting that many brain regions were severely affected in the GFAPTg;Gfap+/R236H mice (Fig. 11). In the cortex, especially in the piriform cortex, many astrocytes displayed reactive features similar to those shown in hippocampus (Fig. 11E,F). Two features of astrocytes should be noted related to the neocortex: (1) the appearance of reactive astrocytes recapitulated normal developmental expression of GFAP (e.g., in piriform cortex, where in control brains astrocytes revealed higher levels of GFAP, there were more reactive astrocytes vs neighboring parts of temporal cortex), and (2) the highest GFAP signal in the cortex was found in astrocytes around large blood vessels and in subpial astrocytes (Fig. 11B,E).
Figure 11.
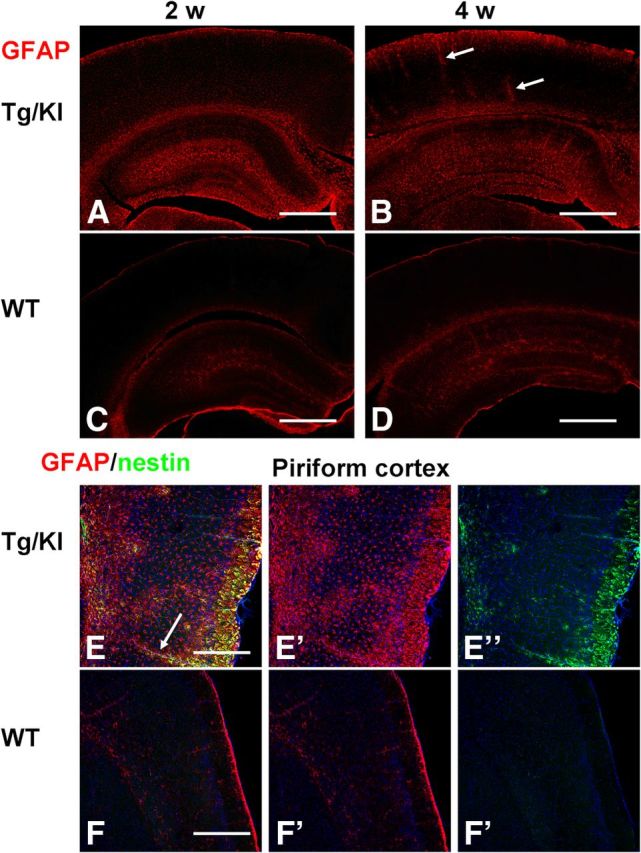
Astrocyte changes are widespread in the neocortex of GFAPTg;Gfap+/R236H mice. Note the difference between levels of GFAP in neocortex in 2 and 4 week GFAPTg;Gfap+/R236H (A and B, respectively) mice versus age-matched WT mice (C and D, respectively). E, F, Reactive astrocytes populate the piriform cortex in GFAPTg;Gfap+/R236H mouse (E) and are absent from piriform cortex in WT mouse (F). Astrocytes around blood vessels (arrows, B, E) stained strongly for GFAP. Confocal microscopy; scale bars: A–D, 350 μm; E, F, 200 μm.
Discussion
Protoplasmic astrocytes convert dramatically to a reactive phenotype in AxD mice
Astrocytes in the AxD mice appear similar in many ways to reactive astrocytes in other conditions. The hypertrophic appearance with thickening of astrocyte processes and increases in GFAP is a characteristic reactive change in astrocytes in response to many CNS pathologies (Eddleston and Mucke, 1993; Wilhelmsson et al., 2006). In addition, astrocytes displayed increases in nestin, vimentin, CD44, p-S6, loss of GLT-1, and intracellular coupling, and nuclear pathology, including multinucleated forms, molecular changes likely to be caused by mechanisms similar to those that result in reactive astrocytes in other conditions. One of the general mechanisms may be activation of the mTOR cascade, activated in AxD astrocytes and reactive astrocytes in other pathologies. The activation of stress kinase pathways in AxD astrocytes (Tang et al., 2006, 2008, 2010) is a likely mechanism for mTOR activation, since ERK activation inactivates TSC2 and also phosphorylates p90RSK, which in turn phosphorylates raptor, one of the TORC1 components (Cully and Downward, 2009). Both of these events would increase mTOR activity. Furthermore, astrocytes in the mutant mice show signs of an unfolded protein response [CHOP and BIP expression (E. Guilfoyle, unpublished observations)]. The UPR leads to aggregation of polyubiquinated cytosolic proteins and an activation of mTOR (Appenzeller-Herzog and Hall, 2012; Liu et al., 2012). However, we also noted that the enlarged, markedly misshapen astrocytes in the str. lac-mol. of the 4 week GFAPTg;Gfap+/R236H mice displayed weak or no immunostaining for p-S6, suggesting that the initial activation of the mTOR pathway represents an early but transitory phenomenon. Phosphorylation of this ribosomal protein happens only in the acute phase of brain injury and then gradually diminishes with time (Codeluppi et al., 2009; Park et al., 2012). Eventually in chronic gliosis, astrocytes deactivate mTOR, which promotes autophagy. We have previously observed a decline in mTOR signaling and an increase in autophagy in AxD astrocyte lines and evidence for autophagy in human AxD brain tissues (Tang et al., 2008).
One of the most robust changes in the AxD mouse astrocytes is the increase in levels of CD44, a receptor for hyaluronan and chondroitin sulfate proteoglycans. Since CD44 is linked to the underlying actin network via ERM proteins, it will be interesting to determine whether CD44 is in part responsible for the changes in astrocyte cell shape. It will also be important to determine whether CD44 expression is causally linked to changes in levels of GLT-1.
Our observations suggest a sequence of pathological changes, beginning with the accumulation of GFAP. Increased CD44 and a loss of intercellular gap junction coupling appear to be among the early changes, while loss of GLT-1 appears later. The activation through the mTOR pathway appears to be an early change, while the later, more severe pathology is accompanied by mTOR inactivation.
The evolution of astrocyte pathology in the hippocampus coincides with the developmental expression of GFAP
The initial changes in astrocytes occurred in the str. lac-mol., rather than being randomly distributed through all hippocampal layers. This area (str. lac. per se) contains both incoming myelinated axons from the perforant pathway and distal dendrites of pyramidal neurons, thus being a mix of white matter and gray matter and normally has higher levels of GFAP than either str. rad. or str. mol., evident in WT mice (Fig. 1). A high level of GFAP in an astrocyte is critical in promoting pathological changes in AxD (Messing et al., 2012). Thus it is reasonable that astrocytes with the highest initial levels of GFAP, as determined during normal astrocyte development (Nixdorf-Bergweiler et al., 1994), would reach a pathological threshold before neighboring gray matter astrocytes, which normally have lower GFAP levels. Thus, the normal developmental pattern of GFAP expression would explain the general pattern of GFAP increases of all of the mutants, in that the str. lac-mol. is the first zone to show enlarged astrocytes, followed by the str. rad. and str. mol.
Astrocyte pathology is heterogeneous on a microscopic scale
In addition to the overall pattern of GFAP accumulation, we observed a striking pattern of spatial heterogeneity on a micro scale, with abnormal astrocytes next to normal-appearing astrocytes and CD44+ astrocytes next to CD44− astrocytes, and similarly for the other markers. We do not understand this mosaicism at present, but such micro-heterogeneity in the context of AxD suggests that different astrocytes in the same vicinity accumulate GFAP at different rates. The mosaicism is unlikely to result from mosaicism of transgene expression, since we also observed this heterogeneity in the Gfap+/R236H hippocampus. Zamanian et al. (2012) observed local heterogeneity of Lcn2 and Serpin3a immunostaining in reactive astrocytes after a transient middle cerebral artery occlusion. Thus, heterogeneity may be a more general feature of astrocyte reactions.
Astrocytes cycle but do not undergo cytokinesis
By 1 week of age, many of the GFAPTg;Gfap+/R236H astrocytes display multiple nuclei, suggesting that they are driven to proliferate, but cytokinesis is inhibited. Site-specific phosphorylation of intermediate filaments by Cdk1, Plk1, Rho-kinase, and Aurora-B kinases are required during cytokinesis (Izawa and Inagaki, 2006). The accumulation of GFAP in AxD astrocytes may in some way interfere with filament phosphorylation at the critical time of cytokinesis, leading to failure of cytokinesis and a polyploid state. Alternatively, the accumulations of GFAP may physically interfere with cytokinesis. AxD astrocytes manifest a number of biochemical changes of intracellular stress (Tang et al., 2006, 2008, 2010), and it is possible that the activation of intracellular stress pathways activates MAP kinase pathways and drives the cells into cycle.
How might the marked changes in the shapes of astrocytes effect interactions between astrocytes and other CNS cells?
Many of the astrocytes changed from their normal, highly branched, protoplasmic forms to irregular cells that displayed thickened processes and a loss of fine processes. Since the fine processes of astrocytes are normally wrapped around and in close apposition to interneuronal synapses (Parpura et al., 2012), we infer that the astrocyte ensheathment of these synapses and therefore the astrocyte regulation of synaptic function is likely to be disrupted significantly. The diminution of glutamate and potassium uptake by AxD astrocytes would further disrupt this astrocyte regulation of synaptic function. Indeed, it is possible that the astrocyte pathology plays a role in the development of the seizures (Seifert et al., 2010; de Lanerolle et al., 2010). However, before 4 weeks, these animals do not display seizures, indicating that the developing astrocyte pathology we observed at 1–2 weeks is not a result of seizures.
The distal apical dendrites of CA1 hippocampal pyramidal neurons manifest large plateau potentials, with Ca2+ influx, large after-depolarizations, burst output, and LTP in the axo-dendritic synapses formed by axons of the perforant pathway and Schaffer collaterals (Takahashi and Magee, 2009). These distal dendrites are located among the most altered astrocytes in the AxD mice. This activity at the distal dendrites might make them particularly dependent on astrocyte glutamate buffering. Examining the structure and function of apical dendrites that course through the pathological astrocyte domains in the AxD mice will reveal the extent of synaptic and dendritic pathology.
Many of the AxD mouse astrocytes are depolarized (Table 1). In addition to showing lower glutamate-induced currents, they also display a decrease in K+ buffering capacity, although the input resistance was not changed. These alterations could in part be due to a loss of Kir4.1, since knock-out of Kir4.1 in astrocytes leads to depolarization, although not to the degree that we observe, and a diminution of K+ buffering (Chever et al., 2010). We have not yet examined the AxD mouse astrocytes for the expression of other ion channels or electrogenic pumps, however.
AxD is classified as a leukodystrophy, a disease in which white matter degenerates with loss of myelin. Since oligodendrocytes do not express GFAP, the pathology of astrocytes must affect oligodendrocyte function and myelination. We do not yet know how oligodendrocyte function is perturbed, but we can speculate that effects on oligodendrocytes could arise from secretion of toxic cytokines (TNFα, for example) or inhibition of myelination [by hyaluronan for example, which we have found increased in the AxD hippocampus (E. Guilfoyle, unpublished observations)].
The full expression of astrocyte pathology may not be cell autonomous
The accumulation of large amounts of GFAP, both normal and mutant, is sufficient to initiate a cell autonomous process that eventually results in profound changes in astrocytes. We cannot conclude, however, that all of the astrocyte pathology has a cell-autonomous basis. For example, changes in astrocytes likely evoke pathological changes in neighboring cells, and those pathologies could affect the astrocytes, inducing positive feedback cycles. There is microglial activation in the hippocampus of the GFAPTg and Gfap+/R236H mice (Hagemann et al., 2006, 2012), and we have evidence that microglia in the GFAPTg;Gfap+/R236H mouse hippocampus become activated during the development of the astrocyte pathology and that levels of a variety of cytokines and chemokines increase (E. Guilfoyle, E. Hod, and A. Sosunov, unpublished observations). Studying the interactions between astrocytes and their neighbors will be important to understanding mechanisms of AxD neuropathology and astrocyte reactions/gliosis more widely.
Footnotes
This work was supported by NIH Grant NS42803 and the Tuberous Sclerosis Alliance. We thank Drs. Markel Olabarria-Larizgoita, Marisa Cotrina, Albee Messing, Tracy Hagemann, Maiken Nedergaard, Michael Brenner, and Mel Feany for advice and discussions.
The authors declare no competing financial interests.
References
- Akiyama H, Tooyama I, Kawamata T, Ikeda K, McGeer PL. Morphological diversities of CD44 positive astrocytes in the cerebral cortex of normal subjects and patients with Alzheimer's disease. Brain Res. 1993;632:249–259. doi: 10.1016/0006-8993(93)91160-T. [DOI] [PubMed] [Google Scholar]
- Anjum R, Blenis J. The RSK family of kinases: emerging roles in cellular signalling. Nat Rev Mol Cell Biol. 2008;9:747–758. doi: 10.1038/nrm2509. [DOI] [PubMed] [Google Scholar]
- Appenzeller-Herzog C, Hall MN. Bidirectional crosstalk between endoplasmic reticulum stress and mTOR signaling. Trends Cell Biol. 2012;22:274–282. doi: 10.1016/j.tcb.2012.02.006. [DOI] [PubMed] [Google Scholar]
- Cargill R, Kohama SG, Struve J, Su W, Banine F, Witkowski E, Back SA, Sherman LS. Astrocytes in aged nonhuman primate brain gray matter synthesize excess hyaluronan. Neurobiol Aging. 2012;33:830.e13–e24. doi: 10.1016/j.neurobiolaging.2011.07.006. [DOI] [PMC free article] [PubMed] [Google Scholar]
- Chever O, Djukic B, McCarthy KD, Amzica F. Implication of Kir4.1 channel in excess potassium clearance: an in vivo study on anesthetized glial-conditional Kir4.1 knock-out mice. J Neurosci. 2010;30:15769–15777. doi: 10.1523/JNEUROSCI.2078-10.2010. [DOI] [PMC free article] [PubMed] [Google Scholar]
- Cho W, Messing A. Properties of astrocytes cultured from GFAP over-expressing and GFAP mutant mice. Exp Cell Res. 2009;315:1260–1272. doi: 10.1016/j.yexcr.2008.12.012. [DOI] [PMC free article] [PubMed] [Google Scholar]
- Codeluppi S, Svensson CI, Hefferan MP, Valencia F, Silldorff MD, Oshiro M, Marsala M, Pasquale EB. The Rheb-mTOR pathway is upregulated in reactive astrocytes of the injured spinal cord. J Neurosci. 2009;29:1093–1104. doi: 10.1523/JNEUROSCI.4103-08.2009. [DOI] [PMC free article] [PubMed] [Google Scholar]
- Cully M, Downward J. Translational responses to growth factors and stress. Biochem Soc Trans. 2009;37:284–288. doi: 10.1042/BST0370284. [DOI] [PubMed] [Google Scholar]
- de Lanerolle NC, Lee TS, Spencer DD. Astrocytes and epilepsy. Neurotherapeutics. 2010;7:424–438. doi: 10.1016/j.nurt.2010.08.002. [DOI] [PMC free article] [PubMed] [Google Scholar]
- Diemer NH, Klinken L. Astrocyte mitoses and Alzheimer type I and II astrocytes in anoxic encephalopathy. Neurobiol Appl Neurobiol. 1976;2:313–321. [Google Scholar]
- Eddleston M, Mucke L. Molecular profile of reactive astrocytes–implications for their role in neurologic disease. Neuroscience. 1993;54:15–36. doi: 10.1016/0306-4522(93)90380-X. [DOI] [PMC free article] [PubMed] [Google Scholar]
- Girgrah N, Letarte M, Becker LE, Cruz TF, Theriault E, Moscarello MA. Localization of the CD44 glycoprotein to fibrous astrocytes in normal white matter and to reactive astrocytes in active lesions in multiple sclerosis. J Neuropathol Exp Neurol. 1991;50:779–792. doi: 10.1097/00005072-199111000-00009. [DOI] [PubMed] [Google Scholar]
- Hagemann TL, Connor JX, Messing A. Alexander disease-associated glial fibrillary acidic protein mutations in mice induce Rosenthal fiber formation and a white matter stress response. J Neurosci. 2006;26:11162–11173. doi: 10.1523/JNEUROSCI.3260-06.2006. [DOI] [PMC free article] [PubMed] [Google Scholar]
- Hagemann TL, Jobe EM, Messing A. Genetic ablation of nrf2/antioxidant response pathway in Alexander disease mice reduces hippocampal gliosis but does not impact survival. PLoS One. 2012;7:e37304. doi: 10.1371/journal.pone.0037304. [DOI] [PMC free article] [PubMed] [Google Scholar]
- Izawa I, Inagaki M. Regulatory mechanisms and functions of intermediate filaments: A study using site- and phosphorylation state-specific antibodies. Cancer Sci. 2006;97:167–174. doi: 10.1111/j.1349-7006.2006.00161.x. [DOI] [PMC free article] [PubMed] [Google Scholar]
- Liu XD, Ko S, Xu Y, Fattah EA, Xiang Q, Jagannath C, Ishii T, Komatsu M, Eissa NT. Transient aggregation of ubiquitinated proteins is a cytosolic unfolded protein response to inflammation and endoplasmic reticulum stress. J Biol Chem. 2012;287:19687–19698. doi: 10.1074/jbc.M112.350934. [DOI] [PMC free article] [PubMed] [Google Scholar]
- Mansour H, Asher R, Dahl D, Labkovsky B, Perides G, Bignami A. Permissive and non-permissive reactive astrocytes: immunofluorescence study with antibodies to the glial hyaluronate-binding protein. J Neurosci Res. 1990;25:300–311. doi: 10.1002/jnr.490250306. [DOI] [PubMed] [Google Scholar]
- Messing A, Head MW, Galles K, Galbreath EJ, Goldman JE, Brenner M. Fatal encephalopathy with astrocyte inclusions in GFAP transgenic mice. Am J Pathol. 1998;152:391–398. [PMC free article] [PubMed] [Google Scholar]
- Messing A, Brenner M, Feany MB, Nedergaard M, Goldman JE. Alexander disease. J Neurosci. 2012;32:5017–5023. doi: 10.1523/JNEUROSCI.5384-11.2012. [DOI] [PMC free article] [PubMed] [Google Scholar]
- Nixdorf-Bergweiler BE, Albrecht D, Heinemann U. Developmental changes in the number, size, and orientation of GFAP-positive cells in the CA1 region of rat hippocampus. Glia. 1994;12:180–195. doi: 10.1002/glia.440120304. [DOI] [PubMed] [Google Scholar]
- Oberheim NA, Wang X, Goldman S, Nedergaard M. Astrocytic complexity distinguishes the human brain. Trends Neurosci. 2006;29:547–553. doi: 10.1016/j.tins.2006.08.004. [DOI] [PubMed] [Google Scholar]
- Park J, Zhang J, Qiu J, Zhu X, Degterev A, Lo EH, Whalen MJ. Combination therapy targeting Akt and mammalian target of rapamycin improves functional outcome after controlled cortical impact in mice. J Cereb Blood Flow Metab. 2012;32:330–340. doi: 10.1038/jcbfm.2011.131. [DOI] [PMC free article] [PubMed] [Google Scholar]
- Parpura V, Heneka MT, Montana V, Oliet SH, Schousboe A, Haydon PG, Stout RF, Jr, Spray DC, Reichenbach A, Pannicke T, Pekny M, Pekna M, Zorec R, Verkhratsky A. Glial cells in (patho)physiology. J Neurochem. 2012;121:4–27. doi: 10.1111/j.1471-4159.2012.07664.x. [DOI] [PMC free article] [PubMed] [Google Scholar]
- Ridet JL, Malhotra SK, Privat A, Gage FH. Reactive astrocytes: cellular and molecular cues to biological function. Trends Neurosci. 1997;20:570–577. doi: 10.1016/S0166-2236(97)01139-9. [DOI] [PubMed] [Google Scholar]
- Rieder CL, Maiato H. Stuck in division or passing through: what happens when cells cannot satisfy the spindle assembly checkpoint. Dev Cell. 2004;7:637–651. doi: 10.1016/j.devcel.2004.09.002. [DOI] [PubMed] [Google Scholar]
- Schools GP, Zhou M, Kimelberg HK. Development of gap junctions in hippocampal astrocytes: evidence that whole cell electrophysiological phenotype is an intrinsic property of the individual cell. J Neurophysiol. 2006;96:1383–1392. doi: 10.1152/jn.00449.2006. [DOI] [PubMed] [Google Scholar]
- Seifert G, Carmignoto G, Steinhäuser C. Astrocyte dysfunction in epilepsy. Brain Res Rev. 2010;63:212–221. doi: 10.1016/j.brainresrev.2009.10.004. [DOI] [PubMed] [Google Scholar]
- Shin T, Ahn M, Kim H, Moon C, Kang TY, Lee JM, Sim KB, Hyun JW. Temporal expression of osteopontin and CD44 in rat brains with experimental cryolesions. Brain Res. 2005;1041:95–101. doi: 10.1016/j.brainres.2005.02.019. [DOI] [PubMed] [Google Scholar]
- Sofroniew MV, Vinters HV. Astrocytes: biology and pathology. Acta Neuropathol. 2010;119:7–35. doi: 10.1007/s00401-009-0619-8. [DOI] [PMC free article] [PubMed] [Google Scholar]
- Takahashi H, Magee JC. Pathway interactions and synaptic plasticity in the dendritic tuft regions of CA1 pyramidal neurons. Neuron. 2009;62:102–111. doi: 10.1016/j.neuron.2009.03.007. [DOI] [PubMed] [Google Scholar]
- Tang G, Xu Z, Goldman JE. Synergistic effects of the SAPK/JNK and the proteasome pathway on glial fibrillary acidic protein (GFAP) accumulation in Alexander disease. J Biol Chem. 2006;281:38634–38643. doi: 10.1074/jbc.M604942200. [DOI] [PubMed] [Google Scholar]
- Tang G, Yue Z, Talloczy Z, Hagemann T, Cho W, Messing A, Sulzer DL, Goldman JE. Autophagy induced by Alexander disease-mutant GFAP accumulation is regulated by p38/MAPK and mTOR signaling pathways. Hum Mol Genet. 2008;17:1540–1555. doi: 10.1093/hmg/ddn042. [DOI] [PMC free article] [PubMed] [Google Scholar]
- Tang G, Perng MD, Wilk S, Quinlan R, Goldman JE. Oligomers of mutant glial fibrillary acidic protein (GFAP) Inhibit the proteasome system in alexander disease astrocytes, and the small heat shock protein alphaB-crystallin reverses the inhibition. J Biol Chem. 2010;285:10527–10537. doi: 10.1074/jbc.M109.067975. [DOI] [PMC free article] [PubMed] [Google Scholar]
- Tian R, Gregor M, Wiche G, Goldman JE. Plectin regulates the organization of glial fibrillary acidic protein in Alexander disease. Am J Pathol. 2006;168:888–897. doi: 10.2353/ajpath.2006.051028. [DOI] [PMC free article] [PubMed] [Google Scholar]
- Tian R, Wu X, Hagemann TL, Sosunov AA, Messing A, McKhann GM, Goldman JE. Alexander disease mutant glial fibrillary acidic protein compromises glutamate transport in astrocytes. J Neuropathol Exp Neurol. 2010;69:335–345. doi: 10.1097/NEN.0b013e3181d3cb52. [DOI] [PMC free article] [PubMed] [Google Scholar]
- Wilhelmsson U, Bushong EA, Price DL, Smarr BL, Phung V, Terada M, Ellisman MH, Pekny M. Redefining the concept of reactive astrocytes as cells that remain within their unique domains upon reaction to injury. Proc Natl Acad Sci U S A. 2006;103:17513–17518. doi: 10.1073/pnas.0602841103. [DOI] [PMC free article] [PubMed] [Google Scholar]
- Zamanian JL, Xu L, Foo LC, Nouri N, Zhou L, Giffard RG, Barres BA. Genomic analysis of reactive astrogliosis. J Neurosci. 2012;32:6391–6410. doi: 10.1523/JNEUROSCI.6221-11.2012. [DOI] [PMC free article] [PubMed] [Google Scholar]


