

Abstract
Autophagy is a lysosomal degradative process to recycle cellular waste and eliminate potentially toxic damaged organelles and protein aggregates. The important cytoprotective functions of autophagy are evidenced by the diverse pathogenic consequences that may stem from autophagy dysregulation in a growing number of neurodegenerative disorders. In many of the diseases associated with autophagy anomalies, it is the final stage of autophagy-lysosomal degradation that is disrupted. In several disorders, including AD, defective lysosomal acidification contributes to this proteolytic failure. The complex regulation of lysosomal pH makes this process vulnerable to disruption by many factors and reliable lysosomal pH measurements have become increasingly important in investigations of disease mechanisms. Although various reagents for pH quantification have been developed over several decades, they are not all equally well-suited for measuring the pH of lysosomes. Here, we evaluate the most commonly used pH probes for sensitivity and localization and identify Lysosensor Yellow/Blue-Dextran, among currently used probes, as having the most optimal profile of properties for measuring lysosomal pH. In addition, we review evidence that lysosomal acidification is defective in Alzheimer’s disease (AD) and extend our original findings of elevated lysosomal pH in presenilin 1 (PS1)-deficient blastocysts and neurons to additional cell models of PS1- and PS1/2-deficiency, to fibroblasts from AD patients with PS1 mutations, and to neurons in the PS/APP mouse model of AD.
Keywords: Autophagy, lysosome, neurodegeneration, pH, presenilin, v-ATPase
Introduction
Defects at different stages of autophagy have been identified in neurodegenerative diseases with increasing frequency, and in some disorders, like Alzheimer’s disease (AD) and Parkinson’s disease (PD), these defects are considered primary factors contributing to disease pathogenesis rather than being mainly secondary pathological consequences of cellular dysfunction (Nixon & Yang, 2012a; Nixon, 2013). In AD, autophagy induction may, in fact, be stimulated; however, the last step of autophagy—the degradation of autophagic cargo in lysosomes—is inhibited leading to massive accumulations of autophagic vacuoles in grossly swollen neurites of affected neurons (Nixon & Yang, 2011).
The near complete loss of function of specific lysosomal enzymes leads to lysosomal storage disorders with diverse pathologies, commonly appearing early in life and often exhibiting severe neurodegeneration (Nixon, 2013). Lysosomal defects that less profoundly influence degradative capacity have also been associated with adult-onset neurodegenerative diseases. The regulation of pH is among the affected lysosomal processes contributing to neurodegeneration. Correct acidification of the lysosome is critical for its ability both to transport and degrade cargo via the endocytic or autophagic pathways. Maintaining lysosomal pH homeostasis requires not only mainly a proton pump, the vacuolar-type ATPase (Kane, 1995; Inoue et al., 2005), but also the coordinated actions of various ion transporters. Observations that mutations in a range of disparate lysosomal proteins alter lysosomal pH, and cause diseases often affecting the brain, highlight the critical importance of proper lysosomal pH balance and the particular vulnerability of neural cells to pH lysosomal perturbations.
Given the emerging attention being paid to lysosomal pH in neurodegeneration, an ability to measure lysosome pH reliably has become increasingly important. New commercially available dyes are now available to measure the pH of various acidic organelles, including lysosomes, each with different merits or disadvantages as sensitive and specific probes of lysosomal pH (Table 1). In this article, we compare the most frequently used of these methods and assess their specificity for lysosomes and sensitivity for accurately quantifying the very low pH values of lysosomes. In this report, after briefly reviewing mechanisms by which lysosomal pH is disrupted in neurodegenerative diseases, including the most common early-onset familial form of AD caused by presenilin 1 mutations (FAD) (Sherrington et al., 1995), we present new evidence for defective lysosomal acidification in presenilin (PS1) and PS2 knockout cell lines, PS-FAD fibroblasts, and a mouse model of PS-FAD, the PS/APP mouse. These findings and new confirmatory studies from other laboratories reinforce the conclusion that abnormally elevated lysosomal pH and lysosomal proteolytic disruption are major contributors to autophagy failure and its pathological consequences in AD.
Table 1.
Summary of probes commonly utilized to assess lysosomal pH
| Probe | Usage | Excitation/Emission | pKa | pH optima | Incubation time* | Limitations |
|---|---|---|---|---|---|---|
| Lysosensor Yellow/Blue- Dextran | in vitro | 384nm/440nm 540nm | ~4.2 | 3–9 | 12–24 hours |
|
| Fluorescein- Dextran | in vitro | 494nm/521nm | ~6.2 | 5–8 | 12–24 hours |
|
| Lysosensor Yellow/Blue DND-160 | in vitro | 329nm/440nm 540nm | ~4.2 | 3–9 | 5 min maximum |
|
| pHrodo- Dextran | in vitro | 560nm/585nm | N/A | 5–8 | 12–24 hours |
|
| Lysotracker Red-99 | in vitro | 577nm/590nm | N/A | < 5.2 | 30 min |
|
| DAMP | in vivo | N/A | N/A | N/A | 12 hours in anti-DNP primary antibody |
|
Incubation times should be empirically determined for individual cell lines
Materials and Methods
Cell lines and mouse
Murine blastocysts were used in this study. Cells were grown in 35 mm dishes in DMEM (Life Technologies, 11995-073) supplemented with penicillin/streptomycin (Life Technologies), 15 % fetal bovine serum (Hyclone), NEAA (Invitrogen) and β-Mercaptoethanol (Sigma) at 37°C and 5% CO2. Mouse Embryonic Fibroblasts lines (MEFs), acquired from Dr. Bart De Strooper (Leuven Institute for Neurodegenerative Disease, Belgium), were maintained in DMEM with 10% FBS, Glutamax and penicillin/streptomycin (Life Technologies) at 37°C and 5% CO2.. Human fibroblast lines (WT:7621, PS1A246E: 6840) were acquired from the Coriell Institute (Camden NJ) and were maintained in MEM (Life Technologies, Carlsbad CA) with 15% FBS (Hyclone, Logan, UT) at 37°C and 5% CO2. APPswe/PS1M146V transgenic mouse (Rozmahel et al., 2002) were studied at 10 month together with age-matched controls. All animal experiments were performed according to “Principles of Animal Care” (NIH, 1985) and approved by the Institutional Animal Care and Use Committee at the NKI.
Antibodies and Reagents
Rabbit anti-Cathepsin D pAb (1/5000) was generated in house for western blot. Sheep anti-CatD (D23, 1/50) antibody was kindly provided from Dr. Ann Cataldo (Harvard University, USA) for immuno EM. Rabbit polyclonal antibody to Cat D (1:50, IEM) was purchased from DAKO. Goat anti-CatB (GT15047, 1/2000) antibody was purchased from Neuromics. pAb against V0a1 subunit of the vacuolar proton pump (1/1000) was purchased from Synaptic Systems. V1B2 antibody was from Abcam. Rabbit polyclonal anti-GAPDH (1/5000) and ammonium chloride (NH4Cl, final 20 mM) were purchased from Sigma. LysoTracker Red DND-99 (1/10000), Bodipy-FL-Pepstatin A, anti-Bodipy-FL rabbit pAb (1/500), anti-DNP rat mAb (1/500), DAMP (30 μM stock), Fluorescein-dextran (D1820), pHrodo-dextran (P35368), Lysosensor yellow/blue DND-160 (L7545), Lysosensor yellow/blue-dextran (L22460), Alexafluor 488-dextran (D22910), and Alexafluor 546-dextran (D22911) were from Life Technologies.
Gel electrophoresis and immunoblotting
Cells for Western blot analysis were lysed in buffer containing 50 mM Tris (pH=7.4), 150 mM NaCl, 1mM EDTA, 1 mM EGTA, 1 % Triton X-100 and 0.5 % Tween-20 with protease and phosphatase inhibitors. Samples were mixed with 2x urea sample buffer and incubated 15 min at 55°C to prevent v-ATPase aggregation, otherwise samples were mixed with 2x SDS sample buffer and incubated 5 min at 100°C. Following electrophoresis on a 4–20 % Tris-glycine gradient gel (Life Technologies), proteins were transferred onto 0.45 μm nitrocellulose for v-ATPase detection or PVDF membranes (Millipore) for detection of all other proteins then incubated overnight in primary antibody. HRP conjugated secondary antibody was added the following morning and incubated for one hour at room temperature. The blot was developed using Novex ECL-kit (Life Technologies).
Confocal laser scanning microscopy
Immunocytochemistry was performed as previously described (Yu et al., 2005). Organelles with low internal pH were labeled by LysoTracker DND-99 dye (Life Technologies) at a final concentration of 100 nM for 60 min. To block v-ATPase proton pump activity, ammonium chloride (NH4Cl) was added directly to the medium at a final concentration of 20 mM for 6 hrs prior to LysoTracker addition. For assessing Cat B activation, MagicRed Cathepsin B (Immunochemistry Technologies) for active Cat B was added to the cells at the concentration suggested by company (1:260). Cells were incubated for 30 min with MR-Cathepsin B. Specific pH probes were added at concentrations and for the times indicated, fluorescein-dextran (500 μg/ml) together with Alexafluor 546-Dextran (10 μg/ml) were incubated for 3 hrs, followed by a 1 hr chase in dye free media. The pHrodo-Dextran (5 μg/ml) together with Alexafluor 488-Dextran (10 μg/ml) were added for 12 hrs, washed then chased in dye free media for additional 6 hrs prior to imaging. Following wash with PBS, new medium was added and then cells were imaged using a plan-Apochromat 40x or 100x/1.4 oil DIC objective lens on the laser scanning confocal microscope, LSM 510 META, with LSM software v3.5 (Carl Zeiss MicroImaging Inc). Images were analyzed using the ImageJ program (NIH).
Epifluorescent Microscopy
WT blastocyst derived cells were grown on glass bottom dishes to 50% confluency. Lysosensor Yellow/Blue-Dextran (25 μg/ml) and Alexafluor 546-Dextran (10 μg/ml) were added and incubated 12 hrs, followed by 6 hour chase in dye free media. Lysosensor Yellow/Blue DND-160 (1 μm) was added for 5 minutes. Alexafluor 546-Dextran (10 μg/ml) was added for 12 hrs with additional 6 hr chase prior to the addition of Lysosensor DN-160. Cells were washed 3 times with HBSS then imaged in dye free media with plan-NeoFluor 100X/1.3 oil DIC objective lens on a Zeiss Axiovert 200M microscope outfitted with Yellow (350 nm excitation/540 nm emission) and Blue (350 nm excitation/460 nm emission) filter cubes and acquired with Axiovision v4.6 (Carl Zeiss MicroImaging Inc). Images were analyzed using ImageJ (NIH).
Lysosomal pH measurement
Procedures were performed as previously described (Lee et al., 2010). Briefly, cells were grown in 96 well plate dish and 2ul of 0.05 mg/ml Lysosensor Yellow/Blue-dextran was added and incubated for 1 hour at 37°C with 5% CO2. The standard curve was generated by incubating cells in 10 uM monensin and 10 uM nigericin in MES buffer (5 mM NaCl, 115 mM KCL, 1.3 mM MgSO4, 25 mM MES), with the pH adjusted to a range from 3.5–7.0 for 7–10 min prior to lysosensor addition. The samples were then read in a Wallac Victor 2 fluorimeter (Perkin Elmer) with excitation at 355nm. The ratio of emission 440nm/535nm was then calculated for each sample. pH values were determined from the standard curve generated via the pH calibration samples.
Briefly for in vivo pH measurement using IEM method, for DAMP (20 μl of 30 mM stock solution prepared in PBS), the sections were incubated with an antibody to DNP (Invitrogen 1:50) and CatD (1:50, DAKO) overnight. Grids were subsequently washed with PBS and incubated for 2 hrs in room temperature with secondary antibody coupled with 6 and 10 nm gold for CatD and DAMP, respectively. For Bodipy-FL-Pepstatin A (24 μl of 1 mM stock solution prepared in PBS), the sections were incubated with an antibody to Bodipy-FL (Invitrogen 1:50) overnight. Grids were subsequently washed with PBS and incubated for 2 hrs in room temperature with secondary antibody coupled with gold for Bodipy-FL. Sections were washed with PBS and were stained briefly with uranyl acetate and lead citrate. Sections were examined and photographed with a Philips CM10 electron microscope. More than 200 vesicles were counted.
Enzymatic assays
In vitro CatB activity was assayed as described previously (Marks and Berg, 1987). Samples were preincubated in 0.1 M sodium acetate (pH 5.5) containing 1 mM EDTA and 2 mM cysteine-HCl for 5 min for activation. Following addition of 5 μM Z-Phe-Arg-AMC in 0.1% Brij-35, reaction mixtures were further incubated for 10–30 min at 37 °C. Reactions were stopped by addition of 200 μl 0.1 M sodium monochloroacetate in 0.1 M sodium acetate (pH 4.3) and then samples were read in a Wallac Victor-2 spectrofluorimetric plate reader (PerkinElmer Life and Analytical Science Inc., Wellesley, MA). Specificity of hydrolysis by these cathepsins was monitored by inhibition with 1 mM leupeptin and enzymatic activity was expressed as leupeptin-inhibitable hydrolytic activity obtained by subtracting the fluorescent AMC units released in the presence of leupeptin from the total fluorescent AMC units in the acid soluble fraction.
Subcellular fractionation
Procedures were performed as previously described (Lee et al., 2010; Yang et al., 2011). For each mouse genotype, cerebral cortices from five or more brains were pooled. Using a protocol modified from Marzella et al. (1982), the samples were homogenized and subjected to differential centrifugation to separate a fraction enriched in autophagic vacuoles, lysosomes and mitochondria as described previously (Cuervo et al., 1995; Singh et al., 2009). The different organelles in this fraction were isolated by floatation in a discontinuous gradient of metrizamide (50, 26, 24, 20 and 10%) and the lysosome-enriched fraction was recovered in the 24–16% interface. A fraction enriched in endoplasmic reticulum resealed vesicles (microsomes) and the cytosolic fraction was obtained in the pellet and supernatant, respectively, after centrifugation of the supernatant at 100,000 g for 1 h.
Analytical Procedures
The quantitative colocalization analysis was performed using ImageJ software (NIH Image) with colocalization analysis plugins (Wright Cell Imaging facility). The value shown represents Pearson’s coefficient. Statistical analysis was calculated by two-tailed paired student t-test using GraphPad InStat (GraphPad Software Inc.). Error bars represents standard error of the mean (±S.E.M).
BIOLOGY OF THE LYSOSOMAL SYSTEM
Lysosomes are single membrane, cytoplasmic organelles present in almost all eukaryotic cells. When identified by Christian De Duve 50 years ago, lysosomes were initially considered to be suicide bags that could precipitate cell death in development or time of stress by releasing resident proteases into the cytoplasm (De Duve et al., 1955). While the connection to degenerative phenomena remained tight, the involvement of lysosomes in other cellular processes essential for cellular homeostasis was soon recognized, including the critical role of lysosomes in autophagy, a degradative process for recycling obsolete cellular constituents to generate component amino acid and lipids for new synthesis and energy and the targeted elimination of potentially toxic damaged organelles and proteins. (Levine & Kroemer, 2008) (Mizushima et al., 2008) (Rubinsztein, 2006). Moreover, the metabolic products released from lysosomes may have additional roles in signaling other pathways to respond to changes in the cell’s nutritional status. Lysosomes receive extracellular substrates (heterophagy) mainly by endocytosis, while intracellular constituents are targeted to lysosomes by autophagy, involving several different mechanisms of substrate delivery to lysosomes and each sharing the common feature of terminal digestion within lysosomes (i.e., the “phagy” in autophagy).
Degradation in lysosomes occurs through the action of over 50 different hydrolases, including up to several dozen proteases (“cathepsins”) that function optimally in an acidic environment. To activate these enzymes, lysosomes maintain an average lumenal pH of ~4.7 through the action of a proton pump and multiple ion channels on the lysosomal limiting membrane. Most cathepsins in lysosomes are extensively processed post-translationally in the endoplasmic reticulum (ER), after which they complex with the mannose-6-phosphate receptor (MPR) in the trans-Golgi network, which targets them to the lysosome. These enzyme-complexes dissociate in the acidic environment of the lysosome and the proteolytic processing of some enzymes from proforms to active forms also requires the strongly acidic pH of lysosomes (Demarchi et al., 2006). For example, cathepsin D is a glycoprotein synthesized as a 53 kDa proenzyme that is proteolytically processed to a 42–47 kDa intermediate during its transport to the lysosome. This intermediate is further processed in lysosomes to the mature two-chain enzyme composed of a larger catalytic (31–33 kDa) and a smaller fragment (14–16 kDa) (Richo & Conner, 1994). Cathepsin B is also a glycoprotein synthesized as procathepsin B (44 kDa), converted to the 33 kDa single-chain form during lysosomal transport and further processed in the lysosome into the enzymatically active two-chain form, consisting of 27/24 kDa and 5 kDa polypeptides (Gelb et al., 1997).
Intracellular organelles maintain a lumenal pH suited to their specific biochemical function. Most organelles that comprise the canonical endolysosomal and secretory pathways maintain an acidic lumenal pH mainly through the action of a primary electrogenic proton pump. Coffely and De Duve suggested that lysosomal enzymes share an acidic pH optimum to limit their processing activity to a specialized digestion-resistant compartment in order to prevent hydrolases released by occasional rupture of a lysosome from degrading critical cytosolic proteins (DeDuve & Wattiaux, 1966). The acidic lumenal pH is generated principally by the vacuolar-type ATPase (v-ATPase), a ubiquitously expressed, multi-subunit complex that mediates the ATP-driven transport of protons across biological membranes. The principal actions of v-ATPase in maintaining lysosomal pH not only regulate the intracellular targeting and maturation of lysosomal enzymes, but also influence diverse functions of lysosomes, such as receptor-ligand trafficking, modulation of lysosomal Ca2+ levels (Mindell, 2012), transport of degradative axonal compartments (Lee et al., 2011), and membrane fusion events (Williamson & Hiesinger, 2010).
Vacuolar v-ATPases are composed of two major domains; the cytosolic V1 domain is necessary for ATP-binding and hydrolysis, while the membrane-associated V0 domain forms the proton translocation pore. These two domains are connected through a stalk like structure (subunits D and F of the V1 domain) and work in concert, deploying ATP hydrolysis to drive proton translocation against the gradient of the lysosome (Saroussi & Nelson, 2009). The “a” subunit is the largest transmembrane subunit of the V0 domain. Four distinct isoforms of the V0a subunit (a1, a2, a3, and a4) have been identified in mice and humans. (Manolson et al., 1992) Each isoform is localized to either a specific endomembrane organelle or, in some specialized cells, to the plasma membrane. The expression of the different a-isoforms generally occurs in a tissue dependent manner, as Northern analysis has confirmed that in mouse tissue, expression of the isoforms occurs as follows: the a1 isoform is expressed predominantly in brain and liver tissue; the a2 isoform is expressed selectively in heart, kidney, and liver; and the a3 isoform is highly enriched in the heart and the liver. Interestingly, the a4 isoform is only expressed in the kidneys of adult mice (Schulz et al., 2007). The distribution of the respective proteins for these transcripts is not well characterized. Significantly, in Drosophila photopreceptors, loss of the V0a1 subunit lowers the number of acidified compartments in eye-brain culture by almost half and leads to the accumulation of autophagosomal compartments (Williamson et al., 2010).
Several ion channels and transporters have also been proposed to have a significant role in maintaining lysosomal acidification. For example, a recent study has implicated the Ca2+ pore, Mucolipin 1, in lysosomal pH regulation (Soyombo et al., 2006). Loss of function of this channel causes mucolipidosis type IV, a disease where lysosomal pH is increased and the cellular pathology includes defective autophagy and prominent autolysosome accumulations (Vergarajauregui et al., 2008; Curcio-Morelli et al.). A second lysosomal Ca2+ channel, TPC2, may also regulate lysosomal pH via an NAADP dependent Ca2+/pH feedback mechanism, whereby calcium regulation and acidification of the lysosome are intimately linked through the activity of this two pore, outwardly rectifying channel (Pitt et al., 2010). Additionally, the lysosomal specific, inwardly rectifying chloride channel CLC-7 has been identified as potentially providing the negative counter ion flux necessary to maintain lysosomal pH, although there is some disagreement as to the overall magnitude of the contribution of CLC-7 and chloride in this process (Graves et al., 2008; Pressey et al.).
Given the importance of the role v-ATPase has in maintaining the acidic environment of the lysosomal lumen, and importance of this acidification is for the final degradative stages of autophagy, it is not surprising that v-ATPase function is especially critical in autophagy, where fusion of substrate-laden autophagosomes with lysosomes requires rapid proton import to re-acidify newly formed autolysosomes. Evidence of this was demonstrated by Nakamura and colleagues, who tested whether vacuolar acidification was required for autophagy and confirmed that v-ATPase activity is required for the final step of autophagy/lysosomal protein turnover. Upon starvation, vma (yeast v-ATPase) mutant cells show accumulation of autophagic bodies as well as decreased protein degradation. (Nakamura et al., 1997). In addition, numerous studies have shown acidity of the lysosome to be closely tied to mechanisms of cell aging and mitochondrial function. As one example, Hughes et al. demonstrated that the acidification state of the yeast vacuole can directly affect the function of mitochondria, and by extension, the life span of the yeast. After budding, the mother cell demonstrated a decrease in the acidity of the vacuole compared to the daughter cells, and this decrease in acidity correlated with increased mitochondrial dysfunction. Moreover, they demonstrated after caloric restriction--long known to extend yeast life span (Guarente & Picard, 2005) (Anderson et al., 2003)--the yeast vacuole was re-acidified (Hughes & Gottschling, 2012).
Approaches to the measurement of lysosomal pH
Qualititative measurements of pH can be achieved using fluorescent indicators that signal on or off within a defined pH range. Such measurements, however, may be influenced by many factors, including indicator dye excitation intensities, concentration of loaded dye, and cell culture conditions. Below, we review the current methods for assessing lysosomal pH and their merits and limitations.
LysoTracker Red DND-99 (Life Technologies) is a lipophilic dye that consists of a fluorophore linked to a weak base that is only partially protonated at neutral pH. This allows LysoTracker to freely permeate cell membranes in live cells and selectively accumulate in cellular compartments with an acidic lumenal pH. The principal intended use of LysoTracker is to mark strongly acidified vesicular compartments, which may include lysosomes, autolysosomes, and late endosomes. There are significant caveats to using this probe as the sole tool to assess lysosomal pH beyond the fact that it is qualitative and does not enable quantitative measurement of pH. First, the intensity of the dye is significantly weakened upon fixation, making use of live cells preferable for this method. Moreover, after epifluorescent excitation, cells exhibit an intense green signal due to a shift in the emission of LysoTracker to a green wavelength, a phenomenon known as pseudo-green signaling. This makes dual-labeling with LysoTracker and a second compartment-specific probe challenging (Freundt et al., 2007). Additionally, LysoTracker has alkalinizing effects on lysosomes, such that a longer incubation with this probe can artifactually increase lysosomal pH. Moreover, a false positive staining pattern can be obtained in instances where the cells are overloaded with the dye. In this case, irrespective of the actual pH of the lysosome, it is possible to saturate the lysosome and obtain a fluorescence signal that would appear to indicate that lysosomal pH is in the normal range. Therefore, LysoTracker signal intensity is not always an accurate reflection of lysosomal acidity or function, and its use as the sole method for assessing lysosomal pH is not advisable.
The first methods developed for directly quantifying lysosomal pH involved the introduction of radioactive species and a series of difficult measurements. Since these initial studies, there have been a number of different non-isotopic methods intended to accurately measure lysosomal pH. Recently, use of pH sensitive fluorescent probes has become the preeminent method for determining lysosomal pH. Among these probes are common fluorophores such as fluorescein and Oregon Green 488, as well as proprietary probes designed specifically to measure lysosomal pH, including Lysosensor Yellow/Blue and pHrodo (Table 1) (Life Technologies). While the existence of many different reagents should be a boon for investigators, the reality is that in many cases quantifying with one probe may yield an entirely different result compared to another, as not all probes are ideal for assaying lysosomal pH, including probes sometimes used for this purpose.
Given that interpreting the mechanism of autophagy dysfunction in a disease state relies heavily on accurate assessment of lysosomal pH, as illustrated by our studies of autophagy dysfunction in AD, we have compared the method used in our studies to those previously published protocols utilized for assessing lysosomal pH in other studies. Four different pH probes, Fluorescein-dextran, pHrodo-dextran, lysosensor yellow/blue dextran and lysosensor yellow/blue DND-160, were assessed for their ability to localize to the lysosome and fluoresce with a bright enough intensity by microscopy to allow us to quantify the signal.
Fluorescein-Dextran has been used in several studies to measure lysosomal pH (Sturgill-Koszycki & Swanson, 2000; Hayward et al., 2006; Glozman et al., 2009) despite the fact that fluorescein has several characteristics that make quantitative measurements of highly acidic compartments difficult, including rapid photobleaching, and an extremely low signal at acidic pH (practical pH range 5–8). These properties more appropriately recommend it for measuring pH values closer to neutrality (e.g., early endosomes), according to the manufacturer’s data sheet (http://tools.invitrogen.com/content/sfs/manuals/mp12050.pdf). As previously indicated, there is some debate as to the role of CLC-7 in lysosomal pH acidification. The crux of this disagreement hinges on the different pH probes used in each study, and as shown in a recent study, fluorescein-dextran is less than ideal as a lysosomal pH probe due to its elevated pKa (DiCiccio & Steinberg, 2011).
To assess the suitability of fluorescein-dextran as a pH probe, WT mouse blastocysts (BD) were stained with fluorescein-dextran according to a previously published protocol (Coen et al., 2012). Concomitantly, these cells were labeled with Alexafluor 546-dextran (AF546) to establish internalization of the fluorescein-dextran probe into lysosomes. As seen in Figure 1A, while AF546 dextran exhibits a robust punctate signal, we could not detect a fluorescein signal after 3 hrs. Notably, a study using fluorescein-dextran to quantify lysosomal pH in WT and PS1KO MEFs could not discriminate a difference in lysosomal pH between WT and PS1KO cells (Coen et al., 2012), in contrast to our previous and current observations that loss of presenilin leading to marked decline in v-ATPase levels elevates lysosomal pH by nearly 1 pH unit (Fig. 2B) (Lee et al., 2010). In our attempt to reproduce the results of the Coen study, we were unable to detect a fluorescein signal. It is worth noting that in the published protocol (Coen et al., 2012), cells were pulsed with fluorescein for only three hours followed by a one hour chase. Fluorescein has been successfully used in the past to accurately determine lysosomal pH, yet in these instances the pulse time is much longer, approaching and even exceeding 24 hours (Sturgill-Koszycki & Swanson, 2000; Hayward et al., 2006; Glozman et al., 2009). Therefore, while the older fluorescein-based approach is being replaced by more sensitive dyes, it may be possible to measure lysosomal pH using fluorescein-dextran, provided appropriate pulse/chase times and controls are applied.
Figure 1.
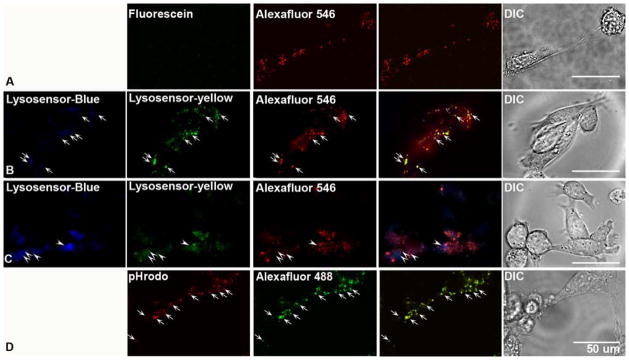
Assessment of commonly utilized pH sensitive probes (A) WT blastocyst derived cells (BD) were stained for 3 hours with fluorescein-dextran after which no observable signal was detected via confocal microscopy. While Alexafluor 546-dextran yielded a clear punctate signal. (B) Lysosensor yellow/blue-dextran signals were colocalized with Alexafluor 546-dextran under triple labeling (arrows). In these images, 523 nm emission for yellow signal was converted to pseudo-green. (C) Lysosensor Yellow/Blue DND-160 demonstrated a more random localization with only a fraction of the blue signal, which indicate fewer acidic organelles colocalizing with the Alexfluor 546-dextran. Moreover, the intensity of the blue signal from the Lysosensor was elevated, indicating a more alkaline lysosome. In these images, 523 nm emissions for yellow signal were converted to pseudo-green. (D) The majority of the pHrodo-dextran signal colocalized with Alexafluor 488-dextran in the lysosome (arrow). Scale bar is 50 μm.
Figure 2.

Lysosomal acidification is affected in PS1/2 DKO MEF cells: (A) PSDKO MEFs exhibit decreased LysoTracker-Red signal compared to WT MEFs. Rare PS1/2 DKO cells exhibiting strong LysoTracker red signal (<2% of total population) were seen in some fields. After incubation with 100nM LysoTracker Red DND-99, cells were washed with PBS and immediately imaged using LSM 510 META confocal microscopy and imaged by phase contrast microscopy. (DIC- differential interference contrast). Arrowheads indicate individual cells. An arrow depicts a rare PSDKO cell displaying unusually high LysoTracker signal. (B) Lysosomal pH is elevated in PS1KO and PDKO MEFs. (C) In vivo Cat B activity assays using MR-cathepsin. PS1/2 DKO MEF exhibit markedly decreased MR-CatB signal compared to WT MEFs. PS1/2 DKO MEFs displaying normal MR-CatB signals were rarely seen similar to the pattern in NH4Cl treated WT MEFs. Arrowheads indicate individual cells. The bottom panels in each image set depict higher magnifications showing a representative single cell from the cell populations in the upper panels. Scale bars represent 50 μm (upper panel) and 10 μm (bottom panel). (D) In vitro assays of Cat B enzyme activity in PS1/2 DKO MEF lysates is also decreased compared to that in control cells. (E) Lysosomal pH is elevated in PS1 FAD patient fibroblasts (Cell line 6840). Lysosomal pH was determined fluorometrically using Dextran conjugated LysoSensor DND-160 Yellow/Blue. Quantitative data are presented as means ±S.E.M. for 3 different experiments. * p<0.0001.
The results with fluorescein probes contrast sharply with results obtained by labeling cells with Lysosensor Yellow/Blue-Dextran, a dextran-conjugated dye used in several studies (Fiebiger et al., 2001; Seral et al., 2003; Yanagawa et al., 2007; Xu et al., 2012) (Lee et al., 2010). The LysoSensor reagent, which was engineered specifically for determining lysosomal pH (Diwu et al., 1999), yields a more accurate read out of lysosomal pH due to the fact that it was designed to detect changes in a broad pH range (3.0 – 9.0) including the range of possible lysosome pH values. For the pH measurements contained herein and in our previous work (Lee et al., 2010), we used this ratiometric dye in a fluorometric assay to quantify lysosomal pH. As seen in Figure 1B, after a 12 hour pulse and 6 hour chase, Lysosensor yellow/blue-dextran is clearly punctate at both emission wavelengths (421/545nm), and colocalizes with the internalized AF546-dextran.
Contrasting with the aforementioned dextran-conjugated LysoSensor probe, LysoSensor yellow/blue DND-160 is the free acid form of the dye, which is internalized by rapid diffusion and sequestration in acidic organelles. In our application of this dye, we observed some degree of colocalization with AF546-dextran, but the bulk of the signal from the unconjugated lysosensor was detected in AF546-dextran-negative vesicles, confirming that this dye labels largely non-lysosomal organelles (Fig. 1C). This makes lysosomal pH measurements with this dye problematic, because the measured pH is artificially high due to the inclusion of organelles such as early endosomes and golgi, which have a significantly higher pH than the lysosome (Kindberg et al.). Moreover, in cells stained with LysoSensor Yellow/Blue DND-160, the intensity observed at 421nm emission is much higher than with LysoSensor Yellow/Blue-dextran. An elevation in the blue emission is indicative of increased alkalinity, a known caveat of this dye when cells are incubated for a time frame that exceeds 5 minutes. Therefore, in order to insure accurate reads of lysosomal pH, it is essential that a dextran-conjugated form of the dye be used for targeting it specifically to lysosomes, as the unconjugated dye enters all vesicular compartments of the cell.
In a final pH analysis, we tested a new probe, pHrodo-dextran. As seen in Figure 1D, pHrodo staining was easily visible in BD cells after a 12 hour incubation, and colocalized with Alexafluor 488-dextran. pHrodo-dextran, may, however, be more suited to measuring late endosomal pH, as the technical specifications for this probe indicate that its fluorescent intensity increases with increasing acidity, reaching a point of saturated intensity when the pH of the organelle is ~ 5.0, (Life Technologies). However, there is a dearth of literature indicating using this dye to quantify pH measurements, and it has not utilized extensively to fluorometrically quantify lysosomal pH. Moreover, pHrodo, unlike lysosensor, does not possess the ability to measure pH via ratiometric measurements, meaning utilization of this dye requires co-labeling with another, pH insensitive, fluorophore. Despite this limitation, pHrodo remains a possible alternative to the Lysosensor probe.
The aforementioned pH probes are designed for cells in culture and cannot be used in vivo. To assess lysosomal pH in vivo, we and others have used DAMP (N-(3-((2,4-dinitrophenyl amino propyl)-N-(3-aminopropyl)methylamine, dihydrochloride), a probe that is sensitive to acidic pH (Anderson et al., 1984) and broadly applicable for detecting acidic organelles by electron microscopy in conjunction with anti-DNP antibodies. Although it is a useful approach for qualitative comparisons of pH differences in two different lysosome populations or lysosome populations under two different experimental conditions, this method does not allow lysosomal pH to be calculated. Given the importance of accurately determining the status of lysosomes in disease states, the development of probes that enable lysosomal pH to be quantified in vivo will be critical to furthering our understanding of lysosomal pH, its regulation, and the consequences arising from its dysfunction in disease. In the following section, we review evidence that the autophagy dysfunction observed in AD involves defective lysosomal acidification.
Lysosome acidification, autophagy dysfunction, and neurodegeneration
Autophagy is a lysosomal degradative process by which cellular constituents are recycled for new synthesis and energy, in response to a number of different cellular stresses or damaged organelles, and proteins eliminated by selective targeting to lysosomes (Klionsky, 2007); (DeDuve & Wattiaux, 1966). There are at least three subtypes of autophagy: chaperone-mediated autophagy (CMA), microautophagy, and macroautophagy (Cuervo, 2004). While the mechanisms for lysosomal delivery and the specific cargo for each of the three autophagic processes differs, the final step, lysosomal degradation, is common to all forms of autophagy. Macroautophagy, hereafter referred to as autophagy, is initiated by the inhibition of mTOR kinase (mammalian target of Rapamycin) or activation of AMP-activated protein kinase (AMPK). Sequestration of cytoplasm within a double membrane limited vacuole, the autophagosome, is coordinated by the sequential involvement of multiple signaling and ubiquitination complexes. Autophagosomes mature by fusing with endosomes and ultimately with lysosomes to form an autolysosome. Autophagy is completed upon digestion of the autophagosome and its contents and the release of amino acids and other metabolic products (Klionsky & Emr, 2000).
Autophagy is essential for neuron survival and, in most disease states, is considered to be a neuroprotective process induced to alleviate cellular stresses, such as nutrient deprivational states and protein aggregate accumulation (Nixon & Yang, 2012b). Initial studies suggested that the rate of autophagy in neurons is quite low because autophagosomes are rarely seen in healthy neurons. Later studies, however, have indicated that neuronal autophagy is constitutively active but very efficient in clearing autophagosomal cargoes (Boland et al., 2008). In neurons, this efficient clearance depends heavily on optimally functioning lysosomal proteolysis in order to maintain active retrograde transport of autophagosomes to the cell body where lysosomes are most prevalent (Lee et al., 2011). Inhibition of lysosomal proteolysis causes autophagosome axonal transport impairments leading to profuse accumulations of substrate-laden autophagic vacuoles in swollen axons and dendrites (Lee et al., 2011).
The robust pathological effects of autophagic disruption in Alzheimer’s disease have been well characterized (Nixon, 2007; Nixon & Yang, 2011). Abnormalities of the lysosomal system in AD are a continuum that includes very early appearing endosome enlargement, reflecting endocytic pathway upregulation and increased lysosome biogenesis. AVs accumulate progressively in affected neurons and are the predominant organelles within grossly swollen dystrophic neurites, a hallmark of AD neuropathology. These autophagic lesions likely reflect the selectively impaired axonal transport of autophagy/lysosomal related compartments, a known pathological consequence of lysosomal proteolysis inhibition (Lee et al., 2011). The striking neuronal autophagy pathology is comparable to that observed in lysosomal storage disorders and more robust than in any other late onset brain disease.
Current evidence indicates that autophagy is principally defective at the stage of autolysosomal proteolysis in AD. The selective accumulation of AVs and especially autolysosomes in dystrophic neurites (Nixon et al., 2005) implies that autophagosomes can form and fuse with lysosomes, but that elimination of substrates from these autolysosomes is defective. This pathological picture contrasts with the exceptional efficiency of AV clearance in normal neurons (Boland et al., 2008). Neuritic dystrophy and selective AV accumulation can be reproduced by blocking lysosomal proteolysis pharmacologically or genetically in in vitro and in vivo models (reviewed in Nixon and Yang 2011) whereas it is not seen when autophagy is strongly induced in otherwise healthy neurons (Boland et al., 2008; Lee et al., 2011). Lysosomal proteolysis failure is further supported by the recently identified role of presenilin (PS) 1 as a chaperone essential for the delivery of v-ATPase to lysosomes, which is essential for lysosome acidification and protease activation. Mutations of PS1, the most common cause of early onset familial AD (Sherrington et al., 1995) cause impaired lysosomal acidification and autolysosomal maturation (Lee et al., 2010), providing a possible basis for why PS1 mutations potentiate autophagic/lysosomal, amyloid, and tau pathologies, as well as accelerate neuronal cell death in patients with PS-FAD or mouse models (Cataldo et al., 2004). Similar lesions in mouse AD models have been shown to be accelerated when lysosomal proteolysis function is further inhibited, and to be prevented when lysosomal function is restored using various lysosomal modulation approaches in AD mouse models (Nixon & Yang, 2011).
In our original study of PS1-related autophagy failure, we provided proof that defective lysosomal acidification in PS1-deleted blastocysts is the mechanism underlying the autophagic dysregulation observed in PS1KO cells based upon several lines of evidence. This evidence included (1) elevation of lysosomal pH measured directly with ratiometric pH sensing dyes; (2) decreased levels of LysoTracker signal; (3) decreased in situ activity of cathepsin D and of cathepsin B in lysosomes of living cells; (4) decreased activity and specific activity of cathepsins D,B, and L measured in vitro; (5) decreased dissociation of MPR-cathepsin complexes; and (6) delayed clearance of autophagy substrates from autolysosomes after induction of autophagy. Moreover, lysosomal acidification defects were also demonstrated in the brains of PS1 hypomorphic and conditional PS1/2 knockout mice (Lee et al., 2010).
To expand on those original studies, we quantified lysosomal pH using Lysosensor Yellow/Blue-Dextran in multiple other cell lines, including PS1KO Mouse Embryonic Fibroblasts (MEFs) and PS1-FAD patient derived fibroblasts. In MEFs, similar to that seen in blastocysts, LysoTracker-red staining was markedly decreased (Fig. 2A) and importantly, lysosomal pH in the absence of PS1 was elevated from ~4.5 in wild type cells to 5.1 (p<0.0001) Lysosomal pH quantification was also performed in PS1/PS2 double knockout (DKO) MEFs where a reduction in LysoTracker staining was observed (Fig. 2A). Lysosomal pH in PS1/2 DKO MEFs was also significantly increased compared to WT cells, but was not more altered than the values from MEFs that only had a deletion of PS1 (Fig. 2B), which correlates well with our LysoTracker data. We also measured cathepsin B activity using both Magic Red-CatB inPS1/2 DKO MEF and confirmed that signal is markedly reduced and comparable to the signal in WT cells treated with NH4Cl to block lysosomal acidification (Fig. 2C, D). Besides PS1/2 DKO MEFs, we measured lysosomal pH in control and PS1-FAD fibroblasts observing significant elevation in lysosomal pH from 4.99 to 5.25 (p<0.0001) (Fig. 2E), consistent with previous evidence indicating lysosomal acidification impairment in these cells related to a partial loss of PS1 function (Lee et al., 2010).
To assess lysosome acidification in vivo in mouse models of AD, we performed intraventricular injections of DAMP, a probe sensitive to changes in vesicular pH, followed by double-immunogold EM using antibodies to CatD to identify lysosome-related vesicles, and dinitrophenol to detect the presence of DAMP, the abundance of which reflects the degree of acidification of the compartments (Anderson et al., 1984). These data demonstrated a significant reduction in vesicular acidification in Cat D-positive compartments of neurons from PS1/APP mice compared to those from WT controls. Similarly, to assess Cat D activation within lysosomes, we injected Bodipy-FL-pepstatin A, which binds selectively to active Cat D (Chen et al., 2000) and immunogold EM was performed with anti-Bodipy antibody. Bodipy-FL-pepstatin A labeling within these vesicles was markedly reduced in PS1/APP mice brain (p<0.001) (Fig. 3A).
Figure 3.

Autophagosome accumulation and defective acidification in PS/APP mice. (A) DAMP, a marker which localizes to acidic compartments, was infused intraventricularly into the brains of mice, which were then analyzed by immuno-electron microscopy using DNP (10 nm-gold) and CatD (6 nm-gold) (top panel) or Bodipy-FL (10 nm-gold, bottom panel) antibodies. Graphs show quantitative results of immunogold labeling for DAMP, CatD, and Bodipy-FL-Pepstain A. (B) v-ATPase V0a1 subunit immunoblotting of brains of 10 month old PS/APP show similar levels of the mature form compared to WT controls. However, the amount of ATPase was significantly decreased in the lysosomal fraction (C). Quantitative data are presented as means ±S.E.M. for 3 different experiments. * p < 0.001. Scale bars equal 500 nm.
Several additional in vivo studies point to lysosomal acidification defects in other AD related mouse models. Eldar-Finkelman and colleagues report that lysosomal acidification is impaired in the 5xFAD mouse brain (Avrahami et al., 2012). In brains of these mice, mTOR and CatD activity and maturation were markedly decreased but restored by GSK3 inhibitor L803-mt. Although lysosomal pH was not directly quantified in vivo, these studies strongly supports the idea that impaired autophagic/lysosomal degradation arises from defects in lysosomal acidification, in agreement with our findings.. Addtionally, a significant decrease in the maturation and activity of both cathepsins B and D has been observed in PS1M146L/APP751s1 mice, implicating autophagy/lysosomal proteolysis impairment in the age-dependent increase in neuronal pathology (Torres et al., 2012). In addition to these mouse AD models, recent studies confirmed reduced LysoTracker-red staining in PS1 null cells. Although the pH of lysosomes was not directly quantified, these investigators demonstrated that the same abnormalities of late endosomal-mediated Wnt signaling seen in PS1 cells were recapitulated in WT cells when lysosome/late endosome pH was elevated with chloroquine (Dobrowolski et al., 2012).
Two studies have reported no acidification defects under PS1-deficient conditions; however, these results were obtained utilizing methods that, as previously discussed, are suboptimal for quantifying lysosomal pH. In one of these studies (Zhang et al., 2012), the use of LysoSensor DND-160 yielded a value for “vesicular pH” of 6.6. A pH of this magnitude has questionable relevance to lysosomal pH, which is known to be less than 5.0 and, sharply contrasts with our lysosomal pH measurements in WT and PS1KO cells and those reported by Coen et al., 2012. In the Zhang et al. report, the majority of the pH values measured in the wild-type cells were above pH 7.0, and exceeded the range of the standard curve. Any pH measurement using ratiometric dyes requires that actual pH values be extrapolated from ratios of the two measured fluorescent signals using a standard curve of broad enough range to include all of the measured values. In this study, >70% of the values in WT cells were out-of-range, as were different large percentages of the values in the PS1 KO cell lines being compared. These values were excluded from the calculation of “vesicular pH” (~6.6) in the cell lines, making the interpretation of the pH determination and the absence of any difference in average pH difficult to interpret. In the second study that could not detect pH differences between WT and PS1KO cells (Coen et al., 2012), the same unconjugated LysoSensor dye was also used in some experiments. In this report, the data were expressed as ratios and actual pH values were not extrapolated from standard curves. It is possible, therefore, that the failure to confirm differences in lysosomal pH in these two studies (Coen et al., 2012) (Zhang et al., 2012) reflects the use of a pH probe that is not targeted specifically to lysosomes. Moreover, in one of these studies, lysosomal pH was determined with a fluorescein-dextran probe, using short labeling times that may be insufficient for specific lysosomal localization or sensitive detection of signal. In the latter study, the finding that pH was not elevated in PS1 KO cells is particularly surprising given that these investigators observed Ca2+ efflux from lysosomes in these cells, which we and others have observed to be one consequence of pH elevation.
We have previously shown that the molecular basis for lysosomal proteolytic defects in PS1 KO cells is loss of function of the PS1 holoprotein in facilitating the maturation and stability of the v-ATPase V0a1 subunit within the ER, and resulting in insufficient amounts of this proton pump subunit from reaching lysosomes. Correct targeting of this subunit is essential for proper lysosomal acidification and protease activation, both of which are necessary for degradation of autophagic/lysosomal substrates.
To further explore the consequences of PS1-related v-ATPase dysfunction, we performed additional analyses in PS1M146L/APPswe mice, exhibiting extensive autophagy/lysosomal pathology and amyloidosis. Not unexpectedly, analysis of whole brain lysates from these mice did not reveal altered maturation of the v-ATPase V0a1 subunit (Fig. 3B) because mutant PS1 and APP are expressed by a neuron-specific promoter with relatively high expression in only a subpopulation of the entire neuronal population. Changes in v-ATPase due to partial loss of PS1 function are expected to be partial (as in PS1-FAD fibroblasts) and present in a subpopulation of brain cells and possibly further diluted by pools of v-ATPase in other organelles (e.g., endosomes, etc.). Therefore, in further analyses, we enriched the brain lysates for lysosomes by AV/lysosomal fractionation from the cerebral cortices of PS1M146L/APPswe mice brains (Fig. 3C). Consistent with our earlier finding that lysosomal acidity was decreased using in vivo IEM studies, immunoblot analysis showed that the amount of mature v-ATPase V0a1 subunit in the lysosomal fraction of PS1/APP mice brain was decreased by approximately 40%. Qualitative analyses in these mice using subcellular markers also showed greater co-fractionation of the V0a1 subunit with an ER enriched fraction compared to that fractionating with lysosomes (Fig. 3C). In addition, western blot analyses of CatD revealed a significant reduction in the active form (31 & 14 kDa) of this enzyme (Fig. 3C), indicating that CatD maturation is decreased as a consequence of the lysosomal acidification defect precipitated by the impairment of v-ATPase maturation in lysosomes of PS1/APP mice.
These findings provide a basis for earlier observations that v-ATPase V0a1 subunit maturation was not altered in PS1M146L/APP751s1 mice (Torres et al., 2012), even though these investigators observed a significant reduction in the mature forms of both cathepsins B and D and significantly decreased lysosomal enzyme activity consistent with impaired lysosomal acidification.
Consistent with the foregoing results and Lee et al (2010), Avrahami et al. recently demonstrated that 5xFAD mice, which co-express AD-related mutant forms of APP and PS1, exhibit decreased N-glycosylation of the V0a1 subunit. Inhibition of GSK-3 signalling reversed this pathology, re-acidified lysosomes, and restored autophagy, leading to extensive clearance of cerebral As deposits. This recovery was mediated, at least in part, by increased glycosylation of v-ATPase subunit V0a1 and mTOR reactivation strongly supports the idea that maturation of V0a1 is necessary for the complex’s stability and its function in lysosomal acidification (Avrahami et al., 2012). A similar relationship has been observed in the disease osteopetrosis where the R444L mutation in the V0a3 isoform alters its glycosylation, resulting in its retention and increased degradation in the ER, which markedly reduces steady-state levels of the protein in osteoclasts (Bhargava et al., 2012). Taken together, these studies suggest that glycosylation of the V0a subunit is a critical post-translational modification for the correct folding and stability of the protein.
Two other analyses have argued that glycosylation of V0a has no significant impact on its trafficking and function (Coen et al., 2012; Zhang et al., 2012) involved the overexpression of exogenous V0a1 subunit, in contrast to the studies described above, including our studies where analysis were conducted at endogeneous levels of the V0a subunit. There are several possible explanations as to why these studies failed to detect effects on v-ATPase resulting from the loss of V0a1 glycosylation. First, as is the case with the V0a3 R444L, amino acids other than Asn (N) can serve as putative glycosylation sites in V0a isoforms (Bhargava et al., 2012), suggesting that perhaps the putative mutated residues were not the only residues that could serve to anchor the polysaccharide glycosylation of V0a1 as mediated by PS1. Second, when the V0a1 subunit is overexpressed, the amount of subunit escaping from the ER would be expected to be considerably greater even though it still represents a small percentage of the total translated subunit. It is reasonable to speculate that the amount of escaped subunit might be higher if overexpressed protein facilitates successful folding or completely inhibits degradation. This possibility has been demonstrated in studies of F508-CFTR, which failed to exit the ER but when overexpressed, was able to avoid the ER quality control mechanisms to some extent and to reach the plasma membrane in functional form (Cheng et al., 1995). As a result, it is likely that sufficiently overexpressed V0a1 escapes retention in the ER despite the lack of glycosylation, giving the appearance that this post-translational modification is dispensable for function.
Not surprisingly, lysosomal pH deficits are an emerging theme in mechanisms underlying a number of diseases other than AD, including prototypical lysosomal storage diseases, including Niemann Pick Type C, Mucolipidosis type IV and Juvenile Neuronal Ceroid Lipofuscinosis (Kindberg et al., 1987; Holopainen et al., 2001) Accumulation of autophagosomes and dopaminergic cell death are well known pathogenesis of Parkinson disease (PD) (Dehay et al., 2010) and recently, loss of function of lysosomal P-type ATPase, ATP13A2 which linked to autosomal recessive familial parkinsonism, has been shown to impair lysosomal acidification, cathepsin maturation, and autophagic proteolytic clearance, supporting the pathogenic importance of lysosomal acidification failure in the autophagy/lysosomal protein degradation system (Ramirez et al., 2006; Dehay et al., 2012).
DISCUSSION
In this study, we have further validated by confirming that lysosomal pH defect are not only present in PS1KO BD cells but also in additional PS1KO cell lines, including MEFs and patient fibroblasts, and in a mutant PS1-related mouse model of AD. We also establish that glycosylation and lysosomal levels of V0a1 are lowered in PS/APP mice, precipitating the aforementioned pH defect. While lysosomal acidification defects significantly impair autophagy leading to the accumulation of pathogenic proteins, the implications of abnormally increased lysosomal pH are more far reaching (Figure 4). Beyond effects on cathepsin maturation and activity, potentially deleterious protein fragments, oxidized lipids and reactive oxygen species increase in the lumens of compromised lysosomes and may destabilize lysosomal membranes resulting in activated caspases that induce apoptosis or necrosis (Nixon & Yang, 2012a). By reducing release of amino acids, elevated lysosomal pH may also suppress mTOR reactivation and thereby depress rates of protein synthesis, as well as decrease proteolysis. Finally, abnormal Ca2+ efflux caused by lysosomal pH elevation (Christensen et al., 2002) can abnormally modulate membrane fusion events or downstream enzymes reliant on calcium binding.
Figure 4.

Schematic representation of the lysosome dysfunction mediated by pH alteration. Increased lysosomal pH leads to reduced lysosomal degradation of lipid or toxic protein followed by down regulation of lysosomal enzyme (i.e. cathepsin) maturation as well as activity (Lee et al., 2010). The accumulations of lipid or ROS generation result in lysosome membrane damage and release lysosomal protease to the cytosol (Zdolsek et al., 1993). Abnormal lysosome permeabilization results in apoptosis or necrosis (Guicciardi et al., 2004). Altered lysosomal degradation induces massive accumulation of autolysosome and turn result in axonal transport impairment (Lee et al., 2011). Also, impairment of the nutrients (i.e. amino acid) recycle followed by delayed lysosomal proteolysis suppresses mTOR and keeps autophagy induction constitutive (Zoncu et al., 2011). Increases in lysosomal pH also decrease lysosomal calcium efflux, also increasing cytosolic calcium levels (Christensen et al., 2002).
Clarifying the role of PS1 function in autophagy ultimately required an ability to directly quantify lysosomal pH. Several groups have confirmed pH deficits under PS1 loss of function conditions. Reliable lysosomal pH measurement requires an appropriate probe and optimal experimental conditions and controls. Even the most advanced probes, however, are not infallible, and therefore, ancillary readouts reflecting pH dysregulation are critical to establishing lysosomal pH defects, including, for example, (1) maturation status and activity of lysosomal enzymes (i.e. cathepsin), (2) measurement of v-ATPase levels and activity in situ and on isolated lysosomes and (3) EM analysis of accumulation of autophagy substrates. Combining these approaches with a direct quantification of lysosomal pH will provide the most complete picture of lysosomal dysfunction, and allow for a better understanding of autophagy/lysosomal dysfunction in neurodegenerative states.
Acknowledgments
We are very grateful to Dr. Alan Bernstein (Global HIV Vaccine Enterprise, USA) for PS blastocysts, Dr. Bart De Strooper (Leuven Institute for Neurodegenerative disease, Belgium) for PS MEF cell line, and CDR animal core for APP/PS1 mice. The authors would also like to thank Nicole Piorkowski for assisting in manuscript preparation and Cori Peterhoff for assisting in formatting figures and Panaiyur S. Mohan for performing the CatB enzyme activity assay. This work was supported by National Institutes of Health grant number P01AG017617 (R.A.N), New York Community Trust (R.A.N), and Litwin Foundation, Inc. (R.A.N).
Abbreviations
- AD
Alzheimer’s disease
- AMPK
AMP-activated protein kinase
- APP
amyloid precursor protein
- AV
autophagic vacuole
- BD
blastocyst
- Cat
cathepsin
- CLC
voltage-dependent chloride channels
- CMA
chaperone-mediated autophagy
- DAMP
(N-(3-((2,4-dinitrophenyl amino propyl)-N-(3-aminopropyl)methylamine, dihydrochloride)
- KO
knockout
- MEF
mouse embryonic fibroblast
- MPR
mannose-6-phosphate receptor
- mTOR
mammalian target of rapamycin
- NAADP
Nicotinic acid adenine dinucleotide phosphate
- PD
Parkinson disease
- PS
presenilin
- TPC2
two pore segment channel 2
Footnotes
The authors have no conflict of interest to declare.
References
- Anderson RGW, Falck JR, Goldstein JL, Brown MS. Visualization of Acidic Organelles in Intact Cells by Electron Microscopy. Proc Natl Acad Sci USA. 1984;81:4838–4842. doi: 10.1073/pnas.81.15.4838. [DOI] [PMC free article] [PubMed] [Google Scholar]
- Anderson RM, Latorre-Esteves M, Neves AR, Lavu S, Medvedik O, Taylor C, Howitz KT, Santos H, Sinclair DA. Yeast life-span extension by calorie restriction is independent of NAD fluctuation. Science. 2003;302:2124–2126. doi: 10.1126/science.1088697. [DOI] [PMC free article] [PubMed] [Google Scholar]
- Avrahami L, Farfara D, Shaham-Kol M, Vassar R, Frenkel D, Eldar-Finkelman H. Inhibition of GSK-3 Ameliorates beta-Amyloid(A-beta) Pathology and Restores Lysosomal Acidification and mTOR Activity in the Alzheimer’s Disease Mouse Model. In vivo and In vitro Studies. J Biol Chem. 2012 doi: 10.1074/jbc.M112.409250. [DOI] [PMC free article] [PubMed] [Google Scholar]
- Bhargava A, Voronov I, Wang Y, Glogauer M, Kartner N, Manolson MF. Osteopetrosis mutation R444L causes endoplasmic reticulum retention and misprocessing of vacuolar H+-ATPase a3 subunit. J Biol Chem. 2012;287:26829–26839. doi: 10.1074/jbc.M112.345702. [DOI] [PMC free article] [PubMed] [Google Scholar]
- Boland B, Kumar A, Lee S, Platt FM, Wegiel J, Yu WH, Nixon RA. Autophagy induction and autophagosome clearance in neurons: relationship to autophagic pathology in Alzheimer’s disease. J Neurosci. 2008;28:6926–6937. doi: 10.1523/JNEUROSCI.0800-08.2008. [DOI] [PMC free article] [PubMed] [Google Scholar]
- Cataldo AM, Peterhoff CM, Schmidt SD, Terio NB, Duff K, Beard M, Mathews PM, Nixon RA. Presenilin mutations in familial Alzheimer disease and transgenic mouse models accelerate neuronal lysosomal pathology. J Neuropathol Exp Neurol. 2004;63:821–830. doi: 10.1093/jnen/63.8.821. [DOI] [PubMed] [Google Scholar]
- Chen CS, Chen WN, Zhou M, Arttamangkul S, Haugland RP. Probing the cathepsin D using a BODIPY FL-pepstatin A: applications in fluorescence polarization and microscopy. J Biochem Biophys Methods. 2000;42:137–151. doi: 10.1016/s0165-022x(00)00048-8. [DOI] [PubMed] [Google Scholar]
- Cheng SH, Fang SL, Zabner J, Marshall J, Piraino S, Schiavi SC, Jefferson DM, Welsh MJ, Smith AE. Functional activation of the cystic fibrosis trafficking mutant delta F508-CFTR by overexpression. Am J Physiol. 1995;268:L615–L624. doi: 10.1152/ajplung.1995.268.4.L615. [DOI] [PubMed] [Google Scholar]
- Christensen KA, Myers JT, Swanson JA. pH-dependent regulation of lysosomal calcium in macrophages. J Cell Sci. 2002;115:599–607. doi: 10.1242/jcs.115.3.599. [DOI] [PubMed] [Google Scholar]
- Coen K, Flannagan R, Baron S, Carraro-Lacroix L, Wang D, Vermeire W, Michiels C, Munck S, Baert V, Sugita S, Wuytack F, Hiesinger P, Grinstein S, Annaert W. Lysosomal calcium homeostasis defects, not proton pump defects, cause endo-lysosomal dysfunction in PSEN-deficient cells. J Cell Biol. 2012;198:23–35. doi: 10.1083/jcb.201201076. [DOI] [PMC free article] [PubMed] [Google Scholar]
- Cuervo AM. Autophagy: many paths to the same end. Mol Cell Biochem. 2004;263:55–72. doi: 10.1023/B:MCBI.0000041848.57020.57. [DOI] [PubMed] [Google Scholar]
- Cuervo AM, Palmer A, Rivett AJ, Knecht E. Degradation of proteasomes by lysosomes in rat liver. Eur J Biochem. 1995;227:792–800. doi: 10.1111/j.1432-1033.1995.tb20203.x. [DOI] [PubMed] [Google Scholar]
- Curcio-Morelli C, Charles FA, Micsenyi MC, Cao Y, Venugopal B, Browning MF, Dobrenis K, Cotman SL, Walkley SU, Slaugenhaupt SA. Macroautophagy is defective in mucolipin-1-deficient mouse neurons. Neurobiol Dis. 2010;40:370–377. doi: 10.1016/j.nbd.2010.06.010. [DOI] [PMC free article] [PubMed] [Google Scholar]
- De Duve C, Passau L, Maisin J. Acid phosphatase and beta-glucuronidase activities in the livers from rats fed 4-dimethylaminoazobenzene. Acta Unio Int Contra Cancrum. 1955;11:638–639. [PubMed] [Google Scholar]
- DeDuve C, Wattiaux R. Functions of lysosomes. Annual Rev Physiol. 1966;28:435–492. doi: 10.1146/annurev.ph.28.030166.002251. [DOI] [PubMed] [Google Scholar]
- Dehay B, Bove J, Rodriguez-Muela N, Perier C, Recasens A, Boya P, Vila M. Pathogenic lysosomal depletion in Parkinson’s disease. J Neurosci. 2010;30:12535–12544. doi: 10.1523/JNEUROSCI.1920-10.2010. [DOI] [PMC free article] [PubMed] [Google Scholar]
- Dehay B, Ramirez A, Martinez-Vicente M, Perier C, Canron MH, Doudnikoff E, Vital A, Vila M, Klien C, Bezard E. Loss of P-type ATPase ATP13A2/PARK9 function induces general lysosomal deficiency and leads to Parkinson disease neurodegeneration. Proceedings of the National Academy of Sciences. 2012;109:9611–9616. doi: 10.1073/pnas.1112368109. [DOI] [PMC free article] [PubMed] [Google Scholar]
- Demarchi F, Bertoli C, Copetti T, Tanida I, Brancolini C, Eskelinen EL, Schneider C. Calpain is required for macroautophagy in mammalian cells. J Cell Biol. 2006;175:595–605. doi: 10.1083/jcb.200601024. [DOI] [PMC free article] [PubMed] [Google Scholar]
- DiCiccio JE, Steinberg BE. Lysosomal pH and analysis of the counter ion pathways that support acidification. The Journal of general physiology. 2011;137:385–390. doi: 10.1085/jgp.201110596. [DOI] [PMC free article] [PubMed] [Google Scholar]
- Diwu Z, Chen CS, Zhang C, Klaubert DH, Haugland RP. A novel acidotropic pH indicator and its potential application in labeling acidic organelles of live cells. Chem Biol. 1999;6:411–418. doi: 10.1016/s1074-5521(99)80059-3. [DOI] [PubMed] [Google Scholar]
- Dobrowolski R, Vick P, Ploper D, Gumper I, Snitkin H, Sabatini DD, De Robertis EM. Presenilin Deficiency or Lysosomal Inhibition Enhances Wnt Signaling through Relocalization of GSK3 to the Late-Endosomal Compartment. Cell Rep. 2012 doi: 10.1016/j.celrep.2012.09.026. in press. [DOI] [PMC free article] [PubMed] [Google Scholar]
- Fiebiger E, Meraner P, Weber E, Fang IF, Stingl G, Ploegh H, Maurer D. Cytokines regulate proteolysis in major histocompatibility complex class II-dependent antigen presentation by dendritic cells. J Exp Med. 2001;193:881–892. doi: 10.1084/jem.193.8.881. [DOI] [PMC free article] [PubMed] [Google Scholar]
- Freundt EC, Czapiga M, Lenardo MJ. Photoconversion of Lysotracker Red to a green fluorescent molecule. Cell Res. 2007;17:956–958. doi: 10.1038/cr.2007.80. [DOI] [PubMed] [Google Scholar]
- Gelb BD, Shi GP, Heller M, Weremowicz S, Morton C, Desnick RJ, Chapman HA. Structure and chromosomal assignment of the human cathepsin K gene. Genomics. 1997;41:258–262. doi: 10.1006/geno.1997.4631. [DOI] [PubMed] [Google Scholar]
- Glozman R, Okiyoneda T, Mulvihill CM, Rini JM, Barriere H, Lukacs GL. N-glycans are direct determinants of CFTR folding and stability in secretory and endocytic membrane traffic. J Cell Biol. 2009;184:847–862. doi: 10.1083/jcb.200808124. [DOI] [PMC free article] [PubMed] [Google Scholar]
- Graves AR, Curran PK, Smith CL, Mindell JA. The Cl−/H+ antiporter ClC-7 is the primary chloride permeation pathway in lysosomes. Nature. 2008;453:788–792. doi: 10.1038/nature06907. [DOI] [PubMed] [Google Scholar]
- Guarente L, Picard F. Calorie restriction--the SIR2 connection. Cell. 2005;120:473–482. doi: 10.1016/j.cell.2005.01.029. [DOI] [PubMed] [Google Scholar]
- Guicciardi MA, Leist M, Gores GJ. Lysosomes in cell death. Oncogene. 2004;23:2881–2890. doi: 10.1038/sj.onc.1207512. [DOI] [PubMed] [Google Scholar]
- Hayward R, Saliba KJ, Kirk K. The pH of the digestive vacuole of Plasmodium falciparum is not associated with chloroquine resistance. J Cell Sci. 2006;119:1016–1025. doi: 10.1242/jcs.02795. [DOI] [PubMed] [Google Scholar]
- Holopainen JM, Saarikoski J, Kinnunen PK, Jarvela I. Elevated lysosomal pH in neuronal ceroid lipofuscinoses (NCLs) Eur J Biochem. 2001;268:5851–5856. doi: 10.1046/j.0014-2956.2001.02530.x. [DOI] [PubMed] [Google Scholar]
- Hughes AL, Gottschling DE. An early age increase in vacuolar pH limits mitochondrial function and lifespan in yeast. Nature. 2012;492:261–265. doi: 10.1038/nature11654. [DOI] [PMC free article] [PubMed] [Google Scholar]
- Inoue T, Wang Y, Jefferies K, Qi J, Hinton A, Forgac M. Structure and regulation of the V-ATPases. J Bioenerg Biomembr. 2005;37:393–398. doi: 10.1007/s10863-005-9478-8. [DOI] [PubMed] [Google Scholar]
- Kane PM. Disassembly and reassembly of the yeast vacuolar H(+)-ATPase in vivo. J Biol Chem. 1995;270:17025–17032. [PubMed] [Google Scholar]
- Kindberg GM, Refsnes M, Christoffersen T, Norum KR, Berg T. The relationship between autophagy and the intracellular degradation of asialoglycoproteins in cultured rat hepatocytes 299. J Biol Chem. 1987;262:7066–7071. [PubMed] [Google Scholar]
- Klionsky DJ. Autophagy: from phenomenology to molecular understanding in less than a decade. Nat Rev Mol Cell Biol. 2007;8:931–937. doi: 10.1038/nrm2245. [DOI] [PubMed] [Google Scholar]
- Klionsky DJ, Emr SD. Autophagy as a regulated pathway of cellular degradation. Science. 2000;290:1717–1721. doi: 10.1126/science.290.5497.1717. [DOI] [PMC free article] [PubMed] [Google Scholar]
- Lee JH, Yu WH, Kumar A, Lee S, Mohan PS, Peterhoff CM, Marinez-Vicente M, Massey AG, Sovak G, Uchiyama Y, Cuervo AM, Nixon RA. Lysosomal proteolysis and autophagy require presenilin 1 and are disrupted by Alzheimer-related PS1 mutations. Cell. 2010;141:1146–1158. doi: 10.1016/j.cell.2010.05.008. [DOI] [PMC free article] [PubMed] [Google Scholar]
- Lee S, Sato Y, Nixon RA. Lysosomal Proteolysis Inhibition Selectively Disrupts Axonal Transport of Degradative Organelles and Causes an Alzheimer’s-Like Axonal Dystrophy. J Neurosci. 2011;31:7817–7830. doi: 10.1523/JNEUROSCI.6412-10.2011. [DOI] [PMC free article] [PubMed] [Google Scholar]
- Levine B, Kroemer G. Autophagy in the Pathogenesis of Disease. Cell. 2008;132:27–42. doi: 10.1016/j.cell.2007.12.018. [DOI] [PMC free article] [PubMed] [Google Scholar]
- Manolson MF, Proteau D, Jones EW. Evidence for a conserved 95–120 kDa subunit associated with and essential for activity of V-ATPases. J Exp Biol. 1992;172:105–112. doi: 10.1242/jeb.172.1.105. [DOI] [PubMed] [Google Scholar]
- Mindell JA. Lysosomal acidification mechanisms. Annu Rev Physiol. 2012;74:69–86. doi: 10.1146/annurev-physiol-012110-142317. [DOI] [PubMed] [Google Scholar]
- Mizushima N, Levine B, Cuervo AM, Klionsky DJ. Autophagy fights disease through cellular self-digestion. Nature. 2008;451:1069–1075. doi: 10.1038/nature06639. [DOI] [PMC free article] [PubMed] [Google Scholar]
- Nakamura N, Matsuura A, Wada Y, Ohsumi Y. Acidification of Vacuoles Is Required for Autophagic Degradation in the Yeast, Saccharomyces cerevisiae. J Biochem (Tokyo) 1997;121:338–344. doi: 10.1093/oxfordjournals.jbchem.a021592. [DOI] [PubMed] [Google Scholar]
- NIH. Laboratory animal welfare; U.S. government principles for the utilization and care of vertebrate animals used in testing, research and training; notice. Fed Regist. 1985;50:20864–20865. [PubMed] [Google Scholar]
- Nixon RA. Autophagy, amyloidogenesis and Alzheimer disease. J Cell Sci. 2007;120:4081–4091. doi: 10.1242/jcs.019265. [DOI] [PubMed] [Google Scholar]
- Nixon RA. Lysosomal mechanisms in autophagy and neurodegenerative disease: Emerging therapeutic opportunities. Nature Medicine. 2013 in press. [Google Scholar]
- Nixon RA, Wegiel J, Kumar A, Yu WH, Peterhoff C, Cataldo A, Cuervo AM. Extensive involvement of autophagy in Alzheimer disease: an immuno-electron microscopy study. J Neuropathol Exp Neurol. 2005;64:113–122. doi: 10.1093/jnen/64.2.113. [DOI] [PubMed] [Google Scholar]
- Nixon RA, Yang D. Autophagy and neuronal cell death in neurological disorders. In: Baehrecke E, Green D, Kornbluth S, Salvesen G, editors. Cell Survival and Cell Death. Cold Spring Harbor Laboratory Press; Woodbury, NY: 2012a. in press. [DOI] [PMC free article] [PubMed] [Google Scholar]
- Nixon RA, Yang DS. Autophagy failure in Alzheimer’s disease-locating the primary defect. Neurobiol Dis. 2011;43:38–45. doi: 10.1016/j.nbd.2011.01.021. [DOI] [PMC free article] [PubMed] [Google Scholar]
- Nixon RA, Yang DS. Autophagy and neuronal cell death in neurological disorders. Cold Spring Harb Perspect Biol. 2012b:4. doi: 10.1101/cshperspect.a008839. [DOI] [PMC free article] [PubMed] [Google Scholar]
- Pitt SJ, Funnell TM, Sitsapesan M, Venturi E, Rietdorf K, Ruas M, Ganesan A, Gosain R, Churchill GC, Zhu MX, Parrington J, Galione A, Sitsapesan R. TPC2 is a novel NAADP-sensitive Ca2+ release channel, operating as a dual sensor of luminal pH and Ca2+ J Biol Chem. 2010;285:35039–35046. doi: 10.1074/jbc.M110.156927. [DOI] [PMC free article] [PubMed] [Google Scholar]
- Pressey SN, O’Donnell KJ, Stauber T, Fuhrmann JC, Tyynela J, Jentsch TJ, Cooper JD. Distinct neuropathologic phenotypes after disrupting the chloride transport proteins ClC-6 or ClC-7/Ostm1. J Neuropathol Exp Neurol. 2010;69:1228–1246. doi: 10.1097/NEN.0b013e3181ffe742. [DOI] [PubMed] [Google Scholar]
- Ramirez A, Heimbach A, Grundemann J, Stiller B, Hampshire D, Cid LP, Goebel I, Mubaidin AF, Wriekat AL, Roeper J, Al-Din A, Hillmer AM, Karsak M, Liss B, Woods CG, Behrens MI, Kubisch C. Hereditary parkinsonism with dementia is caused by mutations in ATP13A2, encoding a lysosomal type 5 P-type ATPase. Nat Genet. 2006;38:1184–1191. doi: 10.1038/ng1884. [DOI] [PubMed] [Google Scholar]
- Richo GR, Conner GE. Structural requirements of procathepsin D activation and maturation. J Biol Chem. 1994;269:14806–14812. [PubMed] [Google Scholar]
- Rozmahel R, Huang J, Chen F, Liang Y, Nguyen V, Ikeda M, Levesque G, Yu G, Nishimura M, Mathews P, Schmidt SD, Mercken M, Bergeron C, Westaway D, St George-Hyslop P. Normal brain development in PS1 hypomorphic mice with markedly reduced gamma-secretase cleavage of betaAPP. Neurobiol Aging. 2002;23:187–194. doi: 10.1016/s0197-4580(01)00267-6. [DOI] [PubMed] [Google Scholar]
- Rubinsztein DC. The roles of intracellular protein-degradation pathways in neurodegeneration. Nature. 2006;443:780–786. doi: 10.1038/nature05291. [DOI] [PubMed] [Google Scholar]
- Saroussi S, Nelson N. The little we know on the structure and machinery of V-ATPase. J Exp Biol. 2009;212:1604–1610. doi: 10.1242/jeb.025866. [DOI] [PubMed] [Google Scholar]
- Schulz N, Dave MH, Stehberger PA, Chau T, Wagner CA. Differential localization of vacuolar H+-ATPases containing a1, a2, a3, or a4 (ATP6V0A1–4) subunit isoforms along the nephron. Cell Physiol Biochem. 2007;20:109–120. doi: 10.1159/000104159. [DOI] [PubMed] [Google Scholar]
- Seral C, Michot JM, Chanteux H, Mingeot-Leclercq MP, Tulkens PM, Van Bambeke F. Influence of P-glycoprotein inhibitors on accumulation of macrolides in J774 murine macrophages. Antimicrobial agents and chemotherapy. 2003;47:1047–1051. doi: 10.1128/AAC.47.3.1047-1051.2003. [DOI] [PMC free article] [PubMed] [Google Scholar]
- Sherrington R, Rogaev EI, Liang Y, Rogaeva EA, Levesque G, Ikeda M, Chi H, Lin C, Li G, Holman K, et al. Cloning of a gene bearing missense mutations in early-onset familial Alzheimer’s disease [see comments] Nature. 1995;375:754–760. doi: 10.1038/375754a0. [DOI] [PubMed] [Google Scholar]
- Singh R, Kaushik S, Wang Y, Xiang Y, Novak I, Komatsu M, Tanaka K, Cuervo AM, Czaja MJ. Autophagy regulates lipid metabolism. Nature. 2009;458:1131–1135. doi: 10.1038/nature07976. [DOI] [PMC free article] [PubMed] [Google Scholar]
- Soyombo AA, Tjon-Kon-Sang S, Rbaibi Y, Bashllari E, Bisceglia J, Muallem S, Kiselyov K. TRP-ML1 regulates lysosomal pH and acidic lysosomal lipid hydrolytic activity. J Biol Chem. 2006;281:7294–7301. doi: 10.1074/jbc.M508211200. [DOI] [PubMed] [Google Scholar]
- Sturgill-Koszycki S, Swanson MS. Legionella pneumophila replication vacuoles mature into acidic, endocytic organelles. J Exp Med. 2000;192:1261–1272. doi: 10.1084/jem.192.9.1261. [DOI] [PMC free article] [PubMed] [Google Scholar]
- Torres M, Jimenez S, Sanchez-Varo R, Navarro V, Trujillo-Estrada L, Sanchez-Mejias E, Carmona I, Davila JC, Vizuete M, Gutierrez A, Vitorica J. Defective lysosomal proteolysis and axonal transport are early pathogenic events that worsen with age leading to increased APP metabolism and synaptic Abeta in transgenic APP/PS1 hippocampus. Mol Neurodegener. 2012;7:59. doi: 10.1186/1750-1326-7-59. [DOI] [PMC free article] [PubMed] [Google Scholar]
- Vergarajauregui S, Connelly PS, Daniels MP, Puertollano R. Autophagic dysfunction in mucolipidosis type IV patients. Hum Mol Genet. 2008;17:2723–2737. doi: 10.1093/hmg/ddn174. [DOI] [PMC free article] [PubMed] [Google Scholar]
- Williamson WR, Hiesinger PR. On the role of v-ATPase V0a1-dependent degradation in Alzheimer disease. Commun Integr Biol. 2010;3:604–607. doi: 10.4161/cib.3.6.13364. [DOI] [PMC free article] [PubMed] [Google Scholar]
- Williamson WR, Wang D, Haberman AS, Hiesinger PR. A dual function of V0-ATPase a1 provides an endolysosomal degradation mechanism in Drosophila melanogaster photoreceptors. J Cell Biol. 2010;189:885–899. doi: 10.1083/jcb.201003062. [DOI] [PMC free article] [PubMed] [Google Scholar]
- Xu M, Liu K, Swaroop M, Porter FD, Sidhu R, Finkes S, Ory DS, Marugan JJ, Xiao J, Southall N, Pavan WJ, Davidson C, Walkley SU, Remaley AT, Baxa U, Sun W, McKew JC, Austin CP, Zheng W. delta-Tocopherol Reduces Lipid Accumulation in Niemann-Pick Type C1 and Wolman Cholesterol Storage Disorders. J Biol Chem. 2012;287:39349–39360. doi: 10.1074/jbc.M112.357707. [DOI] [PMC free article] [PubMed] [Google Scholar]
- Yanagawa M, Tsukuba T, Nishioku T, Okamoto Y, Okamoto K, Takii R, Terada Y, Nakayama KI, Kadowaki T, Yamamoto K. Cathepsin E deficiency induces a novel form of lysosomal storage disorder showing the accumulation of lysosomal membrane sialoglycoproteins and the elevation of lysosomal pH in macrophages. J Biol Chem. 2007;282:1851–1862. doi: 10.1074/jbc.M604143200. [DOI] [PubMed] [Google Scholar]
- Yang DS, Stavrides P, Mohan PS, Kaushik S, Kumar A, Ohno M, Schmidt SD, Wesson D, Bandyopadhyay U, Jiang Y, Pawlik M, Peterhoff CM, Yang AJ, Wilson DA, St George-Hyslop P, Westaway D, Mathews PM, Levy E, Cuervo AM, Nixon RA. Reversal of autophagy dysfunction in the TgCRND8 mouse model of Alzheimer’s disease ameliorates amyloid pathologies and memory deficits. Brain. 2011;134:258–277. doi: 10.1093/brain/awq341. [DOI] [PMC free article] [PubMed] [Google Scholar]
- Zdolsek J, Zhang H, Roberg K, Brunk U. H2O2-mediated damage to lysosomal membranes of J-774 cells. Free Radic Res Commun. 1993;18:71–85. doi: 10.3109/10715769309147344. [DOI] [PubMed] [Google Scholar]
- Zhang X, Garbett K, Veeraraghavalu K, Wilburn B, Gilmore R, Mirnics K, Sisodia S. A Role for Presenilins in Autophagy Revisited: Normal Acidification of Lysosomes in Cells Lacking PSEN1 and PSEN2. J Neurosci. 2012;32:8633–8648. doi: 10.1523/JNEUROSCI.0556-12.2012. [DOI] [PMC free article] [PubMed] [Google Scholar]
- Zoncu R, Bar-Peled L, Efeyan A, Wang S, Sancak Y, Sabatini DM. mTORC1 senses lysosomal amino acids through an inside-out mechanism that requires the vacuolar H(+)-ATPase. Science. 2011;334:678–683. doi: 10.1126/science.1207056. [DOI] [PMC free article] [PubMed] [Google Scholar]