

Abstract
Drug resistance is a major obstacle for controlling infectious diseases. A key challenge is detecting the early signs of drug resistance when little is known about its genetic basis. Focusing on malaria parasites, we propose a way to do this. Newly developing or low level resistance at low frequency in patients can be detected through a phenotypic signature: individual parasite variants clearing more slowly following drug treatment. Harnessing the abundance and resolution of deep sequencing data, our ‘selection differential’ approach addresses some limitations of extant methods of resistance detection, should allow for the earliest detection of resistance in malaria or other multi-clone infections, and has the power to uncover the true scale of the drug resistance problem.
Keywords: Plasmodium, deep sequencing, parasite clearance curves, mixed infections, selection differential, artemisinin
Drug resistance and clearance curves
The evolution of drug resistant pathogens is a major challenge in the fight to control infectious diseases. Malaria parasites are a prime example of this: resistance has evolved to nearly every anti-malarial drug in use [1] and appears to be emerging against the current front-line artemisinin derivatives [2–7]. Ensuring the continued efficacy of these important drugs requires good surveillance, early and rapid detection of resistance, and containment of its spread [3,8–13]. Ideally, resistance would be detected when it is at a low level (drug ‘tolerance’) and low frequency in a patient, well before it has become a clinical problem. Once a new drug resistance mutation has generated sufficient treatment failure to arouse suspicion, its spread is probably well advanced. Current methods used to detect resistance struggle to detect rare or low level resistance. Here we propose a new approach that in principle has substantially greater sensitivity.
Three main tools are used to detect drug resistant malaria parasites. For simplicity, we here use the term ‘resistance’ to include any significant reductions in drug sensitivity below that found in wild type populations prior to drug use, including weak resistance or drug tolerance, though we note that there is disagreement over whether these phenotypes should be considered resistance [14,15]. These three tools are: (i) molecular markers of resistance, (ii) in vitro susceptibility tests, and (iii) therapeutic efficacy tests. Limitations of these approaches have been described in detail elsewhere (e.g., [12,16,17]). Briefly, searching for molecular markers requires knowledge of parasite candidate genes or pathways, yet little can be known in advance about the mechanisms underlying resistance when it is just starting to emerge. This is particularly so in malaria parasites where resistance mechanisms frequently involve loci other than those encoding drug targets [18]. Further, the list of known genetic markers of resistance will never be an exhaustive set of all pathways to resistance; new resistance mechanisms could regularly be evolving, and mechanisms need not be genetic. Testing the susceptibility of parasites to drugs in vitro is problematic because in vivo phenotypes do not necessarily correlate with in vitro performance (e.g., [4]), in addition to being technically challenging, laborious, and expensive. While less technically demanding, therapeutic efficacy tests are logistically challenging and imprecise. The World Health Organization protocol [19] involves extensive follow up, monitoring patients for up to one month or more, during which time any estimate of resistance could be confounded by reinfections or relapses from liver stages. That protocol also sets out rigid criteria for parasitemia and other symptoms over the course of infections that indicate parasite resistance, thus failing to control for any possible sources of inter-individual variation (e.g., host factors such as immunity, drug compliance, or coinfection) [8,11,16,20,21].
Recent studies of drug resistance in malaria parasites have addressed some of these problems by using a more quantitative tool for assaying therapeutic efficacy, the parasite clearance curve [2,4,6,7,22,23]. The remarkable efficiency with which artemisinins act generates a pattern of log-linear decline in parasite densities on a very short timescale [24–26]. With sufficiently frequent sampling of parasite densities, the slope of their decline can be used to calculate a half-life (the time it takes for parasites to reach half of their initial density) [24,27,28]. Parasites that are cleared more slowly from a patient have longer half-lives and are deemed more ‘resistant’. Comparisons of the average half-lives of parasites in different host populations have demonstrated artemisinin resistance emerging in Cambodia [4,5,6], Thailand [2], and Myanmar [7] and failing to emerge, for now, in Laos [23] and Mali [29].
Parasite clearance curves are important tools for defining host population level distributions of parasite half-lives, and they have the advantage of being able to account for some of the variation that occurs between hosts. For instance, some infections show a lag phase before parasite densities start to drop after treatment is initiated, or a tail phase where parasite densities remain above the detectable threshold after a period of log-linear decline [24,27]. The Parasite Clearance Estimator [27] controls for these non-linearities when estimating a half-life. While these patterns could be the result of host effects, they could also be measurement errors or, importantly, could indicate parasite subpopulations within a host that respond differently to treatment [24]. Parasite clearance curves are not able to give finer resolution on this sort of within-host variation since they are not designed for making patient-level inferences. A parasite clearance curve offers a single estimate of the clearance rate of parasites: a weighted average of the clearance trajectories of all parasites within a patient [24]. Malaria infections in humans seldom consist of one parasite clone; many parasite genotypes share their hosts with other genotypes (e.g., [30–38]). A consequence of this is that resistant parasites will often share their host with sensitive parasites, particularly early in the evolutionary process as resistance is spreading. The interpretation of clearance curves for individual patients is affected by this within-host diversity.
Consider a patient that harbors two parasite clones: a fast-clearing, drug-sensitive clone and a slow-clearing, drug-resistant clone. When the individual clearance curves of these two different clones cannot actually be distinguished, two opposing conclusions can be reached, depending on the relative frequency of the clones. If these two clones are at equal frequencies in a patient when drug treatment is initiated, then the clearance curve observed follows the trajectory of the resistant parasite, since it quickly becomes numerically dominant in a drug-treated infection (Figure 1A). If, however, the resistant clone is initially at low frequency in the patient, then our ability to ‘see’ those resistant parasites in the infection is vastly diminished. The clearance curve now follows the trajectory of the sensitive clone (Figure 1B). From clearance curves alone, it is impossible to tell that the patient in Figure 1B is harboring resistant parasites and potentially transmitting those parasites. Current approaches may therefore underestimate the scale of the drug resistance problem.
Figure 1. Clearance curves of diverse infections.


Predicted clearance curves of sensitive (black) and resistant (red) parasite clones in hypothetical infections after drug treatment is initiated (ignoring any possible lag or tail phases [24,27]). The blue line shows the clearance curve that would actually be measured for an individual patient using standard approaches (i.e., it shows the change in the total parasite density over time). Initial frequencies of the resistant clone are (A) 50% and (B) 0.5%. Half-lives for sensitive and resistant clones are taken from [2] (3.7 hours and 6.2 hours, respectively). Despite harboring resistant parasites in both cases, the infection in (A) appears resistant while in (B) appears sensitive.
Capitalizing on within-host diversity with next generation approaches
We propose that, rather than being an obstacle to identifying drug resistance in individual patients, the within-host diversity of infections can instead be exploited to detect it. When drug treatment is applied to mixed infections, clones with any degree of resistance will rise in frequency in the parasite population within that host. Even weakly drug tolerant clones will become more frequent because fully susceptible parasites will be cleared at faster rates. Thus, an increase in the frequency of any clone-specific genetic marker is indicative of up-selection by drugs of a tolerant or resistant clone in a sea of susceptible parasites. The critical requirement for identifying such a change in frequency is a detection technique that can quantify the relative abundance of different clones and sufficiently sensitive to detect rare variants in a mixed population. Next generation sequencing (NGS) technologies, when they are used to deeply sequence a single highly polymorphic region hundreds or thousands of times in a single infection, can do this. The incredible scale and high resolution of the data generated through these technologies have exposed the true (and vastly underestimated) within-host diversity of malaria infections [30,39–42] and prevalence of rare drug-resistant variants in HIV infections (e.g., [43–46]). Using these same deep sequencing tools to detect drug resistance in malaria infections, as well as quantify the extent and magnitude of that resistance, is the logical next step.
With longitudinal samples, including a pre-treatment sample and perhaps as few as one subsequent sample at least one replicative cycle later, deep sequencing can generate a picture of how individual parasite variants respond to drug treatment. This approach, which we refer to as the selection’ differential’ approach because that is what is being estimated [47], provides access to those clone-specific parasite clearance curves that are unobtainable with current tools. Revisiting the hypothetical patients described in Figure 1, if deep sequencing was used to quantify the relative abundance of different clones in place of tracking parasite densities, a clear signature of drug resistance would emerge regardless of whether the resistant variant was initially at a high or low frequency (Figure 2). Importantly, identifying drug resistance with deep sequencing does not require knowing (or sequencing) the molecular markers of resistance. Instead, the phenotype of resistance can be seen – slower clearance, increasing relative abundance – by sequencing any coding region that is highly polymorphic. Since parasite recombination does not occur within human hosts, such a gene region is in essence a clone-specific marker. The ability to detect all of the variants in an infection, and hence the power of the method, will depend on the polymorphism of the gene region targeted; a high degree of polymorphisms allows for a relatively rare resistant clone to be exclusively represented by one or a few alleles within an individual infection.
Figure 2. Relative abundance measures of diverse infections.


Relative abundance of drug-sensitive (black) and resistant (red) parasites before and after drug treatment of hypothetical infections in Figure 1. Half-lives are as given in Figure 1, and initial frequencies of the resistant clone are again (A) 50% and (B) 0.5%. In both cases, the relative abundance of the red parasite variant dramatically increases after drug treatment, indicating that it is being cleared more slowly than the black variant and providing a striking signal of resistance. Deep sequencing can provide this sort of data on the relative abundance of parasite variants.
The selection differential approach offers a number of advantages as a tool to detect drug resistance. First, what we propose is a short-term test (perhaps just two or three replicative cycles) meaning that even if a parasite variant is below the limit of detection in a pre-treatment sample (e.g., if sequencing is not sensitive enough to detect a variant at 0.05%, as depicted in the left panel of Figure 2B), it would be highly unlikely that its detection in a subsequent sample would be due to a reinfection or relapse. Second, what we propose should in principal be feasible with as few as two blood samples from patients, although certainly more power will be garnered by additional time-points, and these may be necessary if lag phases are a parasite genetic effect (Box 1). Finally, what we propose is intra-patient; while recent studies have reported that a substantial amount of the variation in clearance times is attributable to parasite genetics [2,48], some of it is not. With the selection differential approach, all patient-specific variables (like immune status, coinfection, drug uptake, compliance, dosing, drug quality, etc.) are held constant while the clearance rates of individual parasite clones within that patient are investigated.
Box 1. Outstanding questions.
How well do different sequencing platforms estimate the relative abundances of known mixtures? Given this noise, how rare could a resistant clone be in an infection and still be detected using the selection differential approach?
What magnitude of change in relative abundances can be generated through immune selection alone, i.e., how effective at killing parasites are clone-specific immune responses? On what timescale are these changes observable?
How does sampling and sequencing parasites at different stages in their replicative cycle affect estimates of relative abundance?
How much variation in cell cycle duration is there among the parasites within an infection?
If there is variation in cell cycle duration, and the stage of sampled parasites affects estimates, what sampling regime could provide a meaningful picture of the relative abundance of clones?
Does residual DNA from dying or dead parasites contribute to estimates of relative abundance from deep sequencing?
Are the lag phases in parasite clearance curve a host effect (e.g., drug metabolism) or a parasite effect (e.g., parasite subpopulations that are inaccessible to drugs) [24]? If lags are parasite effects that are unrelated to drug sensitivity, how many more samples would be needed to rule out changes in relative abundance due to different lengths of lag phases?
Next generation challenges
Using deep sequencing for early detection of drug resistance is not without its own challenges (Box 2). Chief among these is discriminating real changes in the relative abundance of different parasite variants over time from noise. Accurate characterization of variants within an infection and quantification of the relative abundance of those variants are key for inferring drug resistance from the changes that occur over the course of treatment. But deep sequencing is error-prone and observation error will always muddle attempts to characterize a large parasite population based on a small sample. In a forthcoming article, we develop statistical methods to analyze the type and quality of data involved and use these to provide estimates of the power of the approach to detect low frequency and low level resistance. In Box 3 we illustrate the variation that can arise across technical replicates from these sources of error and briefly describe how, by borrowing tools from community ecology, this noise can in principle be harnessed to develop a null expectation and define thresholds for inferring resistance.
Box 2. Technological challenges.
Next generation sequencing of malaria parasites has been used to quantify and track the clonal diversity within individual infections [30,41,42], to examine diversity and population genetic patterns at the whole parasite population level (among hosts in a given region; 39–41], and to correlate population genetic patterns with resistance phenotypes [58]. These studies represent a combination of whole genome and amplicon sequencing approaches, and each has its own challenges. For studies using whole genome sequencing [41,42, 58], relatively large amounts of DNA are required. This necessitates collection of large volumes of whole blood, cold storage of samples between the field and the lab, filtering of samples to remove host white blood cells, and, sometimes, short-term in vitro culturing to increase parasite numbers (and DNA) [59,60]. The key challenges for whole genome sequencing studies, then, occur at the sampling and sample-processing end of the pipeline. In addition, when used for studying multi-clone infections, whole genome sequencing provides limited depth and short reads, both of which limit the ability to study variants occurring at low frequencies.
These challenges are less of a problem for amplicon sequencing, the approach that we are advocating. Less DNA is required for amplicon sequencing [30,39,40], and sufficient volumes can be obtained directly from blood spots on filter paper, which require desiccation rather than refrigeration for storage. Because amplification of a target locus by PCR is performed, large blood samples and filtering of host white blood cells are unnecessary [61]. However, this PCR step also has the potential to introduce base pair substitutions due to polymerase errors and, more challenging, chimeric sequences due to incomplete primer extension on one haplotype followed by completion of extension on another (PCR-mediated recombination; e.g., [62]). Such chimeras are likely a significant contributor to the noise described in Box 3. These issues shift the key challenges with amplicon sequencing towards the bioinformatics and sequence-processing end of the pipeline. Computational tools have been developed to deal with chimeras and other PCR-introduced artifacts (e.g., [63–65]), but these have so far been restricted to making assignments in clonal populations or at higher taxonomic levels (i.e., genus-level). For sexually recombining organisms such as malaria, chimeras, and true recombinants lack a priori distinguishing features. For now, studies try to circumvent these problems by using stringent criteria for calling variants, for example by requiring a variant to occur in multiple technical replicates, as in [39].
Box 3. Quantifying resistance through noise.
In a recent study [39], DNA was extracted from single blood spots from 100 individual malaria patients prior to receiving treatment, and then divided into two for PCR and sequencing. An approximately 250 bp region of the highly polymorphic P. falciparum csp gene was amplified, and the amplicon product was sequenced on the Roche 454 platform. For each replicate sample from individual patients, reads were clustered into parasite variants (haplotypes). Based on control sequencing, the authors required that a variant be at a frequency of at least 1% and occur in both replicates before being considered a true variant for their analysis. Here we include all initially called variants in each replicate regardless of their frequency or reproducibility to provide a maximal estimate of noise. Figure Ia shows the relative abundance of variants, as estimated in the two technical replicates, for two patients (labeled 1111 and 1128) before treatment. Most of the 100 patients generate graphs that look like patient 1111, i.e., the frequency of variants is relatively reproducible across replicates. For a minority of patients (fewer than 10), the pattern looks more like patient 1128, with large shifts in frequency across replicates. No systematic underlying cause of these shifts could be determined and all samples passed sequencing quality control cutoffs [39]. The dark blue variant in patient 1128 undergoes precisely the sort of change expected for a drug resistant parasite during treatment. If such patterns can arise due to noise across a single time point, how can one be sure that the same pattern across time points indicates resistance?
With such technical replicates from pre-treatment sampling, one can generate a null expectation against which to compare changes that occur over the course of treatment. Useful metrics can be adapted from community ecology where measures of dissimilarity are used to compare species assemblages (e.g., the Bray-Curtis and Manhattan measures; see [66–69] for overviews). For instance, for each variant within a patient, the distance of the point given by the two pre-treatment frequency estimates of that variant to the expected 1:1 line can be calculated. We define d0 as the sum of the distances of all variants within a patient:
for a patient harboring n variants, where the pre-treatment frequency of the ith variant is estimated as p0,i (the superscript denotes the technical replicate). In Figure Ib we illustrate this approach for the two representative patients. Calculating d0 for each of the 100 patients in [39] gives rise to the distribution of d0 values in Figure Ic; this represents our null expectation against which we could compare the distance of the points in a pre- versus post-treatment frequency plot to the 1:1 line. If drug treatment changes the relative abundance of parasite variants due to the presence of resistant variants, then the points in this plot will lie farther from the 1:1 line. Specifically, if
where pT,i is the post-treatment frequency estimate of the ith variant, then we expect dT to lie outside of the distribution of d0.
Implicit in our selection differential approach is an assumption that infections are likely to be composed of a small number of drug-resistant parasites in a sea of sensitive ones. This may not be the case in regions of Southeast Asia where resistance to artemisinins is emerging and where the data suggest that the majority of infections harbor a single clone (e.g., [2]). In those cases, our approach is irrelevant because parasite clearance curves do an adequate job (recall Figure 1A). However, if and when resistance spreads to high transmission settings in Africa (where vigilance and early detection are especially important [49]), resistant parasites are likely to occur in mixed infections. Indeed, a number of studies looking for known resistance mutations (i.e., resistance to non-artemisinin drugs) have found parasites harboring those mutations commonly occurring in mixed infections with wild-type parasites (e.g., [34,50–52]). Recent work, however, shows that mixed genotype Plasmodium falciparum infections tend to be composed of closely related parasites [53], and this could mean that resistant parasites often share an infection with other resistant parasites. If so, similarly resistant parasite variants in an infection would be cleared at the same rate, so the relative abundance of those variants would not change. Our proposed approach would fail to identify infections with resistance at high frequency, but this is not what our approach aims to do – again, clearance curves do an adequate job in this case. And, because all de novo mutations for resistance necessarily begin in a mixed infection, if de novo resistance is a significant source of treatment failure then our approach provides a method to detect these resistant variants as soon as they appear.
Our approach assumes that parasites in drug-treated infections follow the log-linear clearance curves discussed earlier, but a number of biological processes could qualitatively alter these patterns of decline. For instance, what if there are multiple parasite cohorts with 48-hour cycles that are offset by a day? What happens if parasite variants within an infection vary in their cell cycle duration? In the first case, daily sampling to capture each cohort over a full replicative cycle should solve the multiple cohort problem. In the second case, it is not yet clear how variation in cell cycle duration would affect estimates of the relative abundance of variants over the course of drug treatment. Assuming it affects drug-sensitive and drug-resistant parasites equally, then this complexity would be captured in any null distribution (Box 3). If on the other hand drug resistance is a function of this complexity, e.g., resistance is mediated by changes to cycle length (as has been suggested, e.g., [54]) then the situation may be more complicated and further mechanistic modeling of within-host processes could shed light on how this would affect measures of change. Our selection differential approach could also be constrained if drug treatment results in parasite densities below the threshold required for sequencing before a post-treatment sample is taken. With a better understanding of the noise and limits of sequencing data, it will be possible to quantify the parameter space (level and frequency of resistance) over which our approach is robust.
Finally, selection pressures beyond those imposed by drug treatment may be acting in infections. This means that the relative abundance of different parasite clones will change for reasons other than differential sensitivity to drugs (e.g., differential susceptibility to antigen-specific immune responses) and may obscure the selective effects of drugs. Understanding the scale of the changes in response to these other pressures could be achieved with longitudinal samples of untreated asymptomatic infections or with pre- and post-treatment samples from patients in areas where resistance is currently thought to be absent. This additional source of noise could also be built into the null expectation (Box 3). It is our speculation that selection in response to drugs will overwhelm other evolutionary forces such as selection via biased parasite killing by the immune system. For instance, in experimental rodent malaria infections, which are more rapidly contained and cleared than human infections, all immune responses (specific and non-specific) were recently estimated to kill 85% of parasites per day at maximum efficiency and less than that throughout much of the infection [55]. It is unclear how much of that immune killing is strain-specific, but even the maximum of 85% equates to a parasite reduction ratio of about 10, two to four orders of magnitude lower than what has been estimated for the efficacy of artemisinins [25]. This suggests that drug selection has the potential to overwhelm strain-specific immune selection, but further data (or mechanistic modeling) is needed to understand the magnitude of selection differentials that can be generated through immunity alone (Box 1).
Concluding remarks and future perspectives
The introduction of NGS technologies brought with it the promise of allowing researchers to “follow the evolution of…resistance in real time” [56]. The data generated from these technologies should allow us to see the up-selection of drug resistant parasites within individual infections. Indeed, deep sequencing has been used, for example, to follow the dynamics of known resistance mutations in HIV infections [57]. Yet, as we have argued, these technologies have a much broader utility, allowing for the dynamics of resistance to be tracked even when genetic resistance mechanisms have yet to be discovered.
The selection differential approach will in principle permit the most rapid diagnosis of resistance in malaria infections, with the fewest possible blood samples, and the best possible accuracy (bypassing issues of reinfection and relapse). Further, by allowing previously undetectable resistant parasites to be identified, these tools could not only contribute to surveillance and monitoring programs, they could feed samples and data into studies seeking to identify genetic markers and pathways of resistance. Alternatively, with candidate mutations identified, the selection differential approach could be adapted to determine whether candidate resistance alleles are indeed being up-selected during drug treatment. Finally, should the costs and the turnaround time of the sequencing technology continue to decrease, it could in theory be possible to use this approach to identify individual patients who will not respond to treatment, giving clinicians an opportunity to change treatment regimens or partner drugs before clinical failure occurs. This would have the benefit of not only improving patient health, but also removing the drug-specific selection pressure on those parasites.
Figure I. Noise and the summed distance metric.
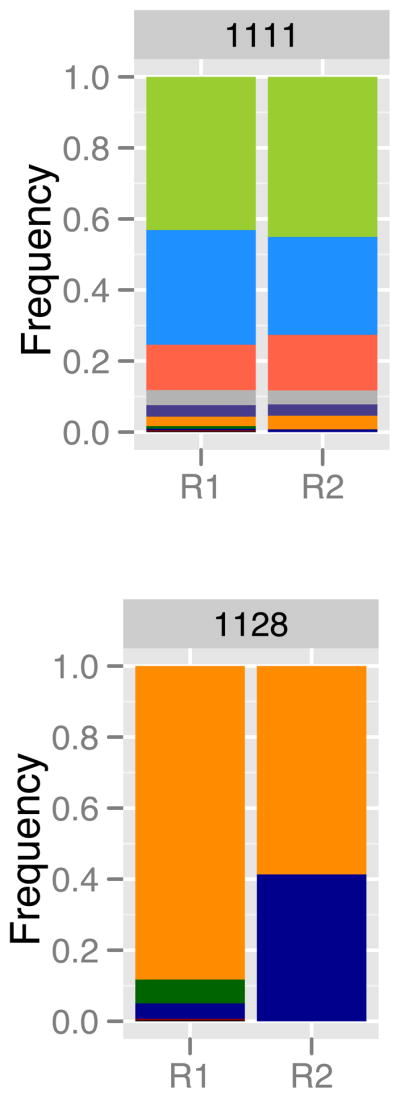


(A) Relative abundance of parasite variants, as determined by 454 sequencing of an approximately 250 bp region of the P. falciparum csp gene, from two representative patients [39]. For each patient, the relative abundances have been estimated twice (technical replicates, R1 and R2). Within patients, each colour represents a unique parasite variant. (B) Plotting these frequencies in a different way reveals a metric for quantifying noise. Here, each point represents the two estimates of frequency for an individual parasite variant. The dotted lines indicate the distance to the 1:1 line, and the d0 values are the sums of these distances for all variants within that patient. If technical replicates were perfectly repeatable, all points would lie along the 1:1 line and d0 would be 0. (C) The distribution of d0 values calculated from all 100 patients in [39], as well as a fitted exponential curve (red; λ=11.8). The dotted lines indicate the values of d0 below which 95, 99 or 99.9% of the fitted distribution lies (equivalently, dT values above these cutoffs are expected to occur less than 5, 1, or 0.1% of the time by chance alone).
Highlights.
Malaria infections (and many others) often consist of multiple parasite clones
Current tools cannot detect drug resistant clones at a low frequency in individual infections
Deep sequencing can reveal how individual parasite variants respond to drugs
These tools could provide rapid and robust diagnostics for drug resistance
Acknowledgments
We thank members of the Research and Policy in Infectious Disease Dynamics Program of the Science and Technology Directorate, Department of Homeland Security and the Fogarty International Center, National Institutes of Health (NIH) for discussion, and four anonymous reviewers for helping to substantially improve this manuscript. This study was funded by National Institute of Allergy and Infectious Diseases, NIH grants R01AI089819 to J.J.J. and U19AI089676 to J.M.C., and a Natural Sciences and Engineering Research Council of Canada Postdoctoral Fellowship to N.M. The content is solely the responsibility of the authors and does not necessarily represent the official views of the Fogarty International Center or the NIH.
Footnotes
Publisher's Disclaimer: This is a PDF file of an unedited manuscript that has been accepted for publication. As a service to our customers we are providing this early version of the manuscript. The manuscript will undergo copyediting, typesetting, and review of the resulting proof before it is published in its final citable form. Please note that during the production process errors may be discovered which could affect the content, and all legal disclaimers that apply to the journal pertain.
References
- 1.World Health Organization. Global report on antimalarial drug efficacy and drug resistance: 2000–2010. World Health Organization; 2010. [Google Scholar]
- 2.Phyo AP, et al. Emergence of artemisinin-resistant malaria on the western border of Thailand: a longitudinal study. Lancet. 2012;379:1960–1966. doi: 10.1016/S0140-6736(12)60484-X. [DOI] [PMC free article] [PubMed] [Google Scholar]
- 3.Dondorp AM, et al. Artemisinin resistance: current status and scenarios for containment. Nat Rev Microbiol. 2010;8:272–280. doi: 10.1038/nrmicro2331. [DOI] [PubMed] [Google Scholar]
- 4.Dondorp AM, et al. Artemisinin resistance in Plasmodium falciparum malaria. New Engl J Med. 2009;361:455–467. doi: 10.1056/NEJMoa0808859. [DOI] [PMC free article] [PubMed] [Google Scholar]
- 5.Noedl H, et al. Evidence of artemisinin-resistant malaria in western Cambodia. New Engl J Med. 2008;359:2619–2620. doi: 10.1056/NEJMc0805011. [DOI] [PubMed] [Google Scholar]
- 6.Amaratunga C, et al. Artemisinin-resistant Plasmodium falciparum in Pursat province, western Cambodia: a parasite clearance rate study. Lancet Infect Dis. 2012;12:851–858. doi: 10.1016/S1473-3099(12)70181-0. [DOI] [PMC free article] [PubMed] [Google Scholar]
- 7.Kyaw MP, et al. Reduced susceptibility of Plasmodium falciparum to artesunate in southern Myanmar. PLoS ONE. 2013;8:e57689. doi: 10.1371/journal.pone.0057689. [DOI] [PMC free article] [PubMed] [Google Scholar]
- 8.Sibley CH, Price RN. Monitoring antimalarial drug resistance: applying lessons learned from the past in a fast-moving present. Int J Parasitol Drugs Drug Resist. 2012;2:126–133. doi: 10.1016/j.ijpddr.2012.03.004. [DOI] [PMC free article] [PubMed] [Google Scholar]
- 9.Guerin PJ, et al. Global resistance surveillance: ensuring antimalarial efficacy in the future. Curr Opin Infect Dis. 2009;22:593–600. doi: 10.1097/QCO.0b013e328332c4a7. [DOI] [PubMed] [Google Scholar]
- 10.Plowe CV. The evolution of drug-resistant malaria. Trans R Soc Trop Med Hyg. 2009;103:S11–S14. doi: 10.1016/j.trstmh.2008.11.002. [DOI] [PMC free article] [PubMed] [Google Scholar]
- 11.Chretien J-P, et al. Improving surveillance for antimalarial drug resistance. JAMA: J Am Med Assoc. 2007;297:2278–2281. doi: 10.1001/jama.297.20.2278. [DOI] [PubMed] [Google Scholar]
- 12.Vestergaard LS, Ringwald P. Responding to the challenge of antimalarial drug resistance by routine monitoring to update national malaria treatment policies. Am J Trop Med Hyg. 2007;77:153–159. [PubMed] [Google Scholar]
- 13.Noedl H. Artemisinin resistance: how can we find it? Trends Parasitol. 2005;21:404–405. doi: 10.1016/j.pt.2005.06.012. [DOI] [PubMed] [Google Scholar]
- 14.Meshnick S. Perspective: Artemisinin-resistant malaria and the wolf. Am J Trop Med Hyg. 2012;87:783–784. doi: 10.4269/ajtmh.2012.12-0388. [DOI] [PMC free article] [PubMed] [Google Scholar]
- 15.White NJ. Counter Perspective: Artemisinin resistance: facts, fears, and fables. Am J Trop Med Hyg. 2012;87:785. doi: 10.4269/ajtmh.2012.12-0573. [DOI] [PMC free article] [PubMed] [Google Scholar]
- 16.Fairhurst RM, et al. Artemisinin-resistant malaria: research challenges, opportunities, and public health implications. Am J Trop Med Hyg. 2012;87:231–241. doi: 10.4269/ajtmh.2012.12-0025. [DOI] [PMC free article] [PubMed] [Google Scholar]
- 17.Talisuna AO, et al. History, dynamics, and public health importance of malaria parasite resistance. Clin Microbiol Rev. 2004;17:235–254. doi: 10.1128/CMR.17.1.235-254.2004. [DOI] [PMC free article] [PubMed] [Google Scholar]
- 18.Hyde JE. Drug-resistant malaria an insight. FEBS J. 2007;274:4688–4698. doi: 10.1111/j.1742-4658.2007.05999.x. [DOI] [PMC free article] [PubMed] [Google Scholar]
- 19.World Health Organization. Methods for surveillance of antimalarial drug efficacy. World Health Organization; 2009. [Google Scholar]
- 20.Francis D, et al. Geographic differences in antimalarial drug efficacy in Uganda are explained by differences in endemicity and not by known molecular markers of drug resistance. J Infect Dis. 2006;193:978–986. doi: 10.1086/500951. [DOI] [PubMed] [Google Scholar]
- 21.Wongsrichanalai C, et al. Epidemiology of drug-resistant malaria. Lancet Infect Dis. 2002;2:209–218. doi: 10.1016/s1473-3099(02)00239-6. [DOI] [PubMed] [Google Scholar]
- 22.Cheeseman IH, et al. A major genome region underlying artemisinin resistance in malaria. Science. 2012;336:79–82. doi: 10.1126/science.1215966. [DOI] [PMC free article] [PubMed] [Google Scholar]
- 23.Mayxay M, et al. No evidence for spread of Plasmodium falciparum artemisinin resistance to Savannakhet Province, Southern Laos. Am J Trop Med Hyg. 2012;86:403–408. doi: 10.4269/ajtmh.2012.11-0497. [DOI] [PMC free article] [PubMed] [Google Scholar]
- 24.White NJ. The parasite clearance curve. Malar J. 2011;10:278. doi: 10.1186/1475-2875-10-278. [DOI] [PMC free article] [PubMed] [Google Scholar]
- 25.White NJ. Assessment of the pharmacodynamic properties of antimalarial drugs in vivo. Antimicrob Agents Chemother. 1997;41:1413–1422. doi: 10.1128/aac.41.7.1413. [DOI] [PMC free article] [PubMed] [Google Scholar]
- 26.White NJ. Clinical pharmacokinetics and pharmacodynamics of artemisinin and derivatives. Trans R Soc Trop Med Hyg. 1994;88:S41–S43. doi: 10.1016/0035-9203(94)90471-5. [DOI] [PubMed] [Google Scholar]
- 27.Flegg JA, et al. Standardizing the measurement of parasite clearance in falciparum malaria: the parasite clearance estimator. Malar J. 2011;10:339. doi: 10.1186/1475-2875-10-339. [DOI] [PMC free article] [PubMed] [Google Scholar]
- 28.Beshir KB, et al. Measuring the efficacy of anti-malarial drugs in vivo: quantitative PCR measurement of parasite clearance. Malar J. 2010;9:312. doi: 10.1186/1475-2875-9-312. [DOI] [PMC free article] [PubMed] [Google Scholar]
- 29.Maiga AW, et al. No evidence of delayed parasite clearance after oral artesunate treatment of uncomplicated falciparum malaria in Mali. Am J Trop Med Hyg. 2012;87:23–28. doi: 10.4269/ajtmh.2012.12-0058. [DOI] [PMC free article] [PubMed] [Google Scholar]
- 30.Juliano JJ, et al. Exposing malaria in-host diversity and estimating population diversity by capture-recapture using massively parallel pyrosequencing. Proc Natl Acad Sci USA. 2010;107:20138–20143. doi: 10.1073/pnas.1007068107. [DOI] [PMC free article] [PubMed] [Google Scholar]
- 31.Baruah S, et al. Temporal and spatial variation in MSP1 clonal composition of Plasmodium falciparum in districts of Assam, Northeast India. Infect Genet Evol. 2009;9:853–859. doi: 10.1016/j.meegid.2009.05.006. [DOI] [PubMed] [Google Scholar]
- 32.Soulama I, et al. Plasmodium falciparum genotypes diversity in symptomatic malaria of children living in an urban and a rural setting in Burkina Faso. Malar J. 2009;8:135. doi: 10.1186/1475-2875-8-135. [DOI] [PMC free article] [PubMed] [Google Scholar]
- 33.Vafa M, et al. Multiplicity of Plasmodium falciparum infection in asymptomatic children in Senegal: relation to transmission, age and erythrocyte variants. Malar J. 2008;7:17. doi: 10.1186/1475-2875-7-17. [DOI] [PMC free article] [PubMed] [Google Scholar]
- 34.Jafari S, et al. Plasmodium falciparum clonal population dynamics during malaria treatment. J Infect Dis. 2004;189:195–203. doi: 10.1086/380910. [DOI] [PubMed] [Google Scholar]
- 35.Magesa SM, et al. Diversity of Plasmodium falciparum clones infecting children living in a holoendemic area in north-eastern Tanzania. Acta Trop. 2002;84:83–92. doi: 10.1016/s0001-706x(02)00179-1. [DOI] [PubMed] [Google Scholar]
- 36.Babiker HA, et al. The epidemiology of multiple Plasmodium falciparum infections. 3. Genetic structure and dynamics of Plasmodium falciparum infections in the Kilombero region of Tanzania. Trans R Soc Trop Med Hyg. 1999;93:S11–S14. doi: 10.1016/s0035-9203(99)90321-8. [DOI] [PubMed] [Google Scholar]
- 37.Konaté AT, et al. The epidemiology of multiple Plasmodium falciparum infections. Trans R Soc Trop Med Hyg. 1999;93:S21–S28. doi: 10.1016/s0035-9203(99)90319-x. [DOI] [PubMed] [Google Scholar]
- 38.Smith T, et al. Epidemiology of multiple Plasmodium falciparum infections 4. Age dependence of the multiplicity of Plasmodium falciparum infections and of other malariological indices in an area of high endemicity. Trans R Soc Trop Med Hyg. 1999;93:S15–S20. doi: 10.1016/s0035-9203(99)90322-x. [DOI] [PubMed] [Google Scholar]
- 39.Bailey JA, et al. Use of massively parallel pyrosequencing to evaluate the diversity of and selection on Plasmodium falciparum csp T-cell epitopes in Lilongwe, Malawi. J Infect Dis. 2012;206:580–587. doi: 10.1093/infdis/jis329. [DOI] [PMC free article] [PubMed] [Google Scholar]
- 40.Gandhi K, et al. Next generation sequencing to detect variation in the Plasmodium falciparum circumsporozoite protein. Am J Trop Med Hyg. 2012;86:775–781. doi: 10.4269/ajtmh.2012.11-0478. [DOI] [PMC free article] [PubMed] [Google Scholar]
- 41.Manske M, et al. Analysis of Plasmodium falciparum diversity in natural infections by deep sequencing. Nature. 2012;487:375–379. doi: 10.1038/nature11174. [DOI] [PMC free article] [PubMed] [Google Scholar]
- 42.Auburn S, et al. Characterization of within-host Plasmodium falciparum diversity using next-generation sequence data. PLoS ONE. 2012;7:e32891. doi: 10.1371/journal.pone.0032891. [DOI] [PMC free article] [PubMed] [Google Scholar]
- 43.Rozera G, et al. Massively parallel pyrosequencing highlights minority variants in the HIV-1 env quasispecies deriving from lymphomonocyte sub-populations. Retrovirology. 2009;6:15. doi: 10.1186/1742-4690-6-15. [DOI] [PMC free article] [PubMed] [Google Scholar]
- 44.Mitsuya Y, et al. Minority human immunodeficiency virus type 1 variants in antiretroviral-naive persons with reverse transcriptase codon 215 revertant mutations. J Virol. 2008;82:10747–10755. doi: 10.1128/JVI.01827-07. [DOI] [PMC free article] [PubMed] [Google Scholar]
- 45.Hoffmann C, et al. DNA bar coding and pyrosequencing to identify rare HIV drug resistance mutations. Nucleic Acids Res. 2007;35:e91. doi: 10.1093/nar/gkm435. [DOI] [PMC free article] [PubMed] [Google Scholar]
- 46.Wang C, et al. Characterization of mutation spectra with ultra-deep pyrosequencing: application to HIV-1 drug resistance. Genome Res. 2007;17:1195–1201. doi: 10.1101/gr.6468307. [DOI] [PMC free article] [PubMed] [Google Scholar]
- 47.Falconer DS, Mackay TFC. Introduction to Quantitative Genetics. 4. Longman; 1996. [Google Scholar]
- 48.Takala-Harrison S, et al. Genetic loci associated with delayed clearance of Plasmodium falciparum following artemisinin treatment in Southeast Asia. Proc Natl Acad Sci USA. 2013;110:240–245. doi: 10.1073/pnas.1211205110. [DOI] [PMC free article] [PubMed] [Google Scholar]
- 49.Talisuna AO, et al. Mitigating the threat of artemisinin resistance in Africa: improvement of drug-resistance surveillance and response systems. Lancet Infect Dis. 2012;12:888–896. doi: 10.1016/S1473-3099(12)70241-4. [DOI] [PMC free article] [PubMed] [Google Scholar]
- 50.Owusu-Agyei S, et al. Epidemiology of malaria in the forest-savanna transitional zone of Ghana. Malar J. 2009;8:220. doi: 10.1186/1475-2875-8-220. [DOI] [PMC free article] [PubMed] [Google Scholar]
- 51.Zhong D, et al. Molecular epidemiology of drug-resistant malaria in western Kenya highlands. BMC Infect Dis. 2008;8:105. doi: 10.1186/1471-2334-8-105. [DOI] [PMC free article] [PubMed] [Google Scholar]
- 52.Juliano JJ, et al. Minority-variant pfcrt K76T mutations and chloroquine resistance, Malawi. Emerg Infect Dis. 2007;13:872–877. doi: 10.3201/eid1306.061182. [DOI] [PubMed] [Google Scholar]
- 53.Nkhoma SC, et al. Close kinship within multiple-genotype malaria parasite infections. Proc R Soc Lond B. 2012;279:2589–2598. doi: 10.1098/rspb.2012.0113. [DOI] [PMC free article] [PubMed] [Google Scholar]
- 54.Dodd A, et al. Artemisinin-induced parasite dormancy: a plausible mechanism for treatment failure. Malaria J. 2011;10:56. doi: 10.1186/1475-2875-10-56. [DOI] [PMC free article] [PubMed] [Google Scholar]
- 55.Metcalf CJE, et al. Partitioning regulatory mechanisms of within-host malaria dynamics using the effective propagation number. Science. 2011;333:984–988. doi: 10.1126/science.1204588. [DOI] [PMC free article] [PubMed] [Google Scholar]
- 56.Kahvejian A, et al. What would you do if you could sequence everything? Nature Biotechnol. 2008;26:1125–1133. doi: 10.1038/nbt1494. [DOI] [PMC free article] [PubMed] [Google Scholar]
- 57.Hedskog C, et al. Dynamics of HIV-1 quasispecies during antiviral treatment dissected using ultra-deep pyrosequencing. PLoS ONE. 2010;5:e11345. doi: 10.1371/journal.pone.0011345. [DOI] [PMC free article] [PubMed] [Google Scholar]
- 58.Miotto O, et al. Multiple populations of artemisinin-resistant Plasmodium falciparum in Cambodia. Nature Genetics. 2013 doi: 10.1038/ng.2624. [DOI] [PMC free article] [PubMed] [Google Scholar]
- 59.Auburn S, et al. An effective method to purify Plasmodium falciparum DNA directly from clinical blood samples for whole genome high-throughput sequencing. PLoS ONE. 2011;6:e22213. doi: 10.1371/journal.pone.0022213. [DOI] [PMC free article] [PubMed] [Google Scholar]
- 60.Kozarewa I, et al. Amplification-free Illumina sequencing-library preparation facilitates improved mapping and assembly of (G+C)-biased genomes. Nature Methods. 2009;6:291–295. doi: 10.1038/nmeth.1311. [DOI] [PMC free article] [PubMed] [Google Scholar]
- 61.Alloueche A, et al. High-throughput sequence typing of T-cell epitope polymorphisms in Plasmodium falciparum circumsporozoite protein. Mol Biochem Parasitol. 2000;106:273–282. doi: 10.1016/s0166-6851(99)00221-2. [DOI] [PubMed] [Google Scholar]
- 62.Ashelford KE, et al. New screening software shows that most recent large 16S rRNA gene clone libraries contain chimeras. Appl & Environ Microbiol. 2006;72:5734–5741. doi: 10.1128/AEM.00556-06. [DOI] [PMC free article] [PubMed] [Google Scholar]
- 63.Quince C, et al. Removing noise from pyrosequenced amplicons. BMC Bioinformatics. 2011;12:38. doi: 10.1186/1471-2105-12-38. [DOI] [PMC free article] [PubMed] [Google Scholar]
- 64.Haas BJ, et al. Chimeric 16S rRNA sequence formation and detection in Sanger and 454-yrosequenced PCR amplicons. Genome Res. 2011;21:494–504. doi: 10.1101/gr.112730.110. [DOI] [PMC free article] [PubMed] [Google Scholar]
- 65.Edgar RC, et al. UCHIME improves sensitivity and speed of chimera detection. Bioinformatics. 2011;27:2194–2200. doi: 10.1093/bioinformatics/btr381. [DOI] [PMC free article] [PubMed] [Google Scholar]
- 66.Cha SH. Comprehensive survey on distance/similarity measures between probability density functions. Int J Math Mod Meth Appl Sci. 2007;1:300–307. [Google Scholar]
- 67.Clarke KR, et al. On resemblance measures for ecological studies, including taxonomic dissimilarities and a zero-adjusted Bray–Curtis coefficient for denuded assemblages. J Exp Mar Biol Ecol. 2006;330:55–80. [Google Scholar]
- 68.Magurran AE. Measuring Biological Diversity. Blackwell Science Ltd; 2004. [Google Scholar]
- 69.Faith DP, et al. Compositional dissimilarity as a robust measure of ecological distance. Vegetatio. 1987;69:57–68. [Google Scholar]