

Abstract
Background and Purpose
White Matter Hyperintensities (WMH) are areas of high signal detected by T2 and FLAIR sequences on brain Magnetic Resonance Imaging (MRI). Although associated with aging, cerebrovascular risk factors and cognitive impairment, the pathogenesis of WMH remains unclear. RNA expression was assessed in the blood of individuals with and without extensive WMH to search for evidence of oxidative stress, inflammation and other abnormalities described in WMH lesions in brain.
Methods
Subjects included 20 with extensive WMH (WMH+), 45% of whom had Alzheimer’s disease, and 18 with minimal WMH (WMH-), 44% of whom had Alzheimer’s disease. All subjects were clinically evaluated and had quantitative MRIs. Total RNA from whole blood was processed on human whole genome Affymetrix HU133 Plus 2.0 microarrays. RNA expression was analyzed using an analysis of covariance (ANCOVA).
Results
241 genes were differentially regulated at ±1.2 fold difference (p <0.005) in subjects with WMH+ as compared to WMH-, regardless of cognitive status, and 50 genes were differentially regulated with at least ±1.5 fold difference (p <0.005). Cluster and principal components analyses showed that the expression profiles for these genes distinguished WMH+ from WMH- subjects. Function analyses suggested that WMH-specific genes were associated with oxidative stress, inflammation, detoxification, and hormone signaling, and included genes associated with oligodendrocyte proliferation, axon repair, long term potentiation and neurotransmission.
Conclusions
The unique RNA expression profile in blood associated with WMH is consistent with roles of systemic oxidative stress and inflammation as well as other potential processes in the pathogenesis or consequences of WMH.
Keywords: White matter, MRI, gene expression profiling, blood, ischemia, inflammation, oxidative stress, Alzheimer’s disease
Introduction
White matter hyperintensities (WMH) are commonly found on brain magnetic resonance imaging (MRI) T2-weighted and fluid attenuated inversion recovery (FLAIR) images and are associated with advancing age, vascular risk factors and cognitive impairment. 1, 2 A vascular cause for WMH has been suggested and is supported by the fact that stroke-related vascular risk factors are also risk factors for WMH. 3 In addition, WMH occur in vascular border zones and are associated with increased risk for future stroke. 4 Pathologically, WMH can be due to dilatation of perivascular spaces, axonal loss, peri-vascular demyelination and gliosis.5 Despite these associations, the molecular mechanisms responsible for WMH are unclear. It is possible inflammation and oxidative stress may contribute to their development.6, 7
We previously reported RNA expression changes in the blood of animals and humans following stroke. 8-10 Based upon these results, we postulated that a whole genome assessment of RNAs in blood cells would be useful to search for evidence of possible systemic factors such as inflammation and oxidative stress responses that could influence the development of WMH.
Materials and Methods
Subjects were recruited from the Alzheimer’s Disease (AD) Center at University of California Davis. The institutional review board at the University of California at Davis approved this study. Cognitive evaluations included a Mini-Mental State Examination (MMSE) and the Clinical Dementia Rating Scale (CDR). Demographic variables included age, gender, race, and years of education, history of hypertension, hyperlipidemia, heart disease or AD. The diagnosis of AD was made according to the NINCDS and Communication Disorders and Stroke/AD and Related Disorders Association (NINDS-ADRDA) criteria. 11
Brain imaging was performed using a 1.5 T GE Signa Horizon LX Echospeed MRI scanner. A T1-weighted coronal three-dimensional spoiled gradient-recalled echo acquisition and a FLAIR sequence designed to enhance WMH segmentation were employed. WMH segmentation and WMH volume measurements were performed as previously described. 12 All the WMH+ cases had head size adjusted WMH volume above the 75th percentile of a normal population (n=20, 11 non-demented subjects and 9 dementia patients) and all the WMH- subjects had head size adjusted WMH volume below the 25th percentile of a normal population (n=18, 10 non-demented subjects and 8 dementia patients). Blood collection, RNA purification and microarray hybridization were performed as previously reported and can be found in supplementary methods. 10
Demographic data were analyzed with Student’s t-test or Fisher’s exact tests. Microarray probe-level data were summarized with Robust Multi-array Average (RMA) algorithm. Quality control analysis and Analysis of Covariance (ANCOVA) were conducted in Partek Genomics Suite (Partek Inc., St. Louis, MI, USA). A multivariate ANCOVA was performed to adjust for potential confounders, including sample batch, sex, age, heart disease, hyperlipidemia and Alzheimer’s disease. Since a significant number of unknown expressed sequence tags (ESTs) was included, the gene number reported in the results section referred to the number of probe sets which showed differential gene expression changes. Principal Component Analysis (PCA) and unsupervised cluster analysis were then performed in Partek Genomics Suite based on genes identified as differentially regulated to confirm the differential expression pattern between subjects with and without extensive WMH. Genes that were differentially regulated between subjects with and without extensive WMH were further analyzed using Ingenuity Pathways Analysis (IPA 8.0, Ingenuity® Systems). These analyses identified the most statistically significant biological functions or canonical pathways in the data set with p<0.1. Fischer’s exact test was used to calculate a p-value describing the probability that a given biological function was assigned to that data set due to chance alone. Additional pathways were considered to be regulated regardless of the p value if a regulated gene was a key member of an associated pathway. For example, changes in glutathione S-transferase mu 4 (GSTM4) gene expression in the blood of WMH+ subjects suggested involvement of the glutathione metabolism pathway.
Results
Demographic information for subjects with extensive WMH (WMH+) and low WMH (WMH-) is given in Table 1. Subjects with WMH+ were more likely to have a history of hypertension. However, we found that a history of hypertension had a negligible effect on the ANCOVA results (not shown). There were no significant differences in age, gender, race, years of education, history of hyperlipidemia, heart disease or AD between those with and without extensive WMH.
Table 1.
Characteristics of subjects with (WMH+) or without (WMH-) extensive WMH.
| WMH+ (n=20) | WMH- (n=18) | p value | ||
|---|---|---|---|---|
| Age | (Years) | 75.3±5.6 | 74.1+5.4 | 0.49 |
| Gender | Female:Male | 13:7 | 13:5 | 0.73 |
| Race | White:non-white | 11:9 | 12:8 | 0.52 |
| Education | (Years) | 13.3±3.1 | 15.3±3.7 | 0.08 |
| Medical History | Alzheimer’s Disease | 9 | 8 | 1.00 |
| Hypertension | 12 | 4 | 0.03 | |
| Heart Disease | 9 | 4 | 0.18 | |
| Hyperlipidemia | 8 | 7 | 1.00 | |
| Diabetes | 4 | 1 | 0.34 | |
| Stroke | 1 | 1 | 1.00 |
WMH+ indicates individuals with >75th percentile WMH volume and WMH- indicates individuals with <25th percentile volume based on a cognitively normal control population
To determine if there is a unique expression profile for WMH, the RNA expression of the blood from subjects with WMH+ was compared to that of WMH - subjects. A multivariate ANCOVA was performed to co-vary out expression changes accounted for by potential confounders, including batch, gender, age, heart disease, hyperlipidemia and AD. These factors were included either because they are known risk factors for developing WMH, and/or because they are known to produce gene expression changes in blood. A total of 50 genes showed a 1.5 fold difference between WMH+ and WMH -subjects and 241 genes showed a 1.2 fold difference between the groups (p<0.005)(Supplementary Table S2). The multiple comparison Q values adjusted with the Benjamini and Hochberg False Discovery (FDR) method are included in Supplementary Table S2 along with the original p values.
Principal Components Analysis (PCA) was performed to evaluate the relationships between WMH- and WMH+ subjects using the 241 gene list. The top three primary components accounted for 54.7% of the variance (Figure 1). The first principal component alone separated WMH+ from WMH- subjects (Figure 1). Cluster analysis using the 241 gene list also separated WMH- subjects from WMH+ subjects (Figure 2). A similar separation was also obtained following a PCA and cluster analysis using the more stringent 50 gene list (Supplementary Figure S1).
Figure 1. Principal Components Analysis (PCA).
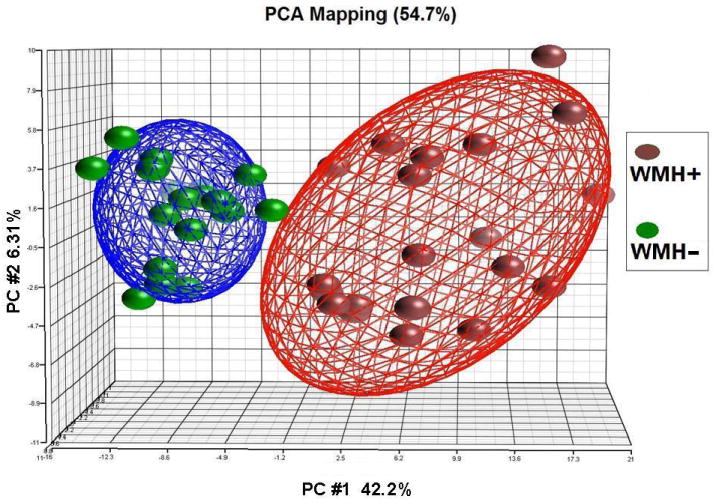
The 241 genes that were differentially expressed in extensive WMH subjects (WMH+) versus minimal WMH subjects (WMH-) (p<0.005 and fold change >1.2) were used for a PCA. The top three principal components were represented on the X, Y and Z axes. Each symbol represents one subject with red being subjects with extensive WMH+ (n=20) and green being subjects with WMH- (n=18). The distance between samples in the 3-D space shows their differences based on the expression pattern. Each of the two ellipsoids represents a two-standard deviation space from the mean of each group of samples.
Figure 2. Cluster Analysis of WMH-associated genes for all subjects.
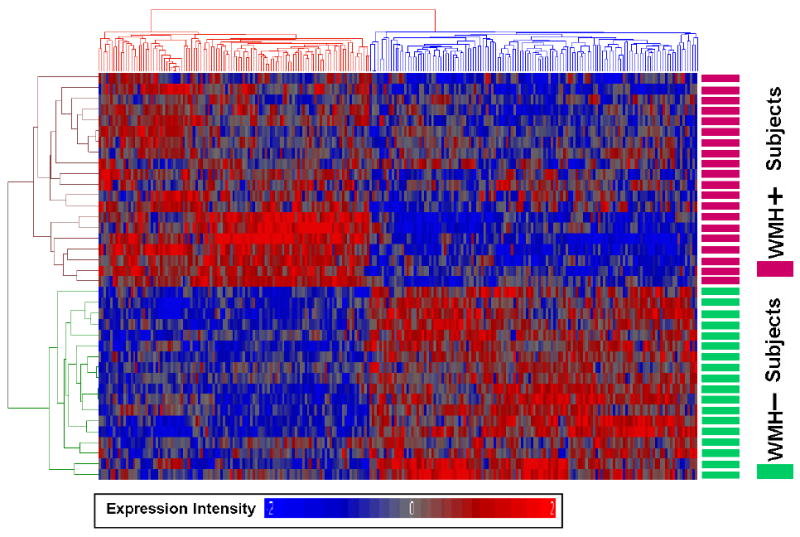
The 241 genes that were differentially expressed in extensive WMH subjects (WMH+) versus minimal WMH subjects (WMH-) (p<0.005 and fold change >1.2) were used for an unsupervised Pearson cluster analysis. Individual genes (n=241) are shown on the x-axis and individual subjects (n=38) are shown on the y-axis. Genes showing high expression are in red and genes with low expression are in blue. Note that all of the subjects with WMH+ are clustered separately from low WMH subjects (WMH-) and that there is a specific gene expression profile for each with little evidence for subgroups based upon these genes.
Only 5 of 241 WMH-associated genes with >1.2 fold difference and only 1 of 50 with a >1.5 fold difference were also found in the AD-associated gene list (Supplementary Table S3). Moreover, adding an interaction term for WMH-AD interaction did not change the expression differences for 92% of the originally identified genes. Finally, only 4 of the 241 WMH genes overlapped with our previously identified ischemic stroke-associated genes from similar work with peripheral blood cells (Supplementary Table S4). 9, 10
Canonical pathway analyses were performed on the 241 gene list. Inflammatory, oxidative, detoxification, hormone, lipid and carbohydrate metabolism pathways were represented (Table 2). WMH-specific gene expression changes also included brain-related genes involved in long term potentiation (LTP) and axon guidance (Table 2). Molecular function association analyses based on a search of the most recent literature yielded similar results (Supplementary Table S1).
Table 2.
Pathways associated with WMH+ specific genes using a Fisher’s exact test.
| Classification | Canonical Pathways | Molecules |
|---|---|---|
| Inflammatory Signaling | Regulation of Actin-based Motility by Rho | PIP5K1A, PAK3, PIP5K1B |
| Virus Entry via Endocytic Pathways | B2M, PRKCI, CLTCL1 | |
| Fc Epsilon RI Signaling | PRKCI, PDPK1, IL4 | |
| IL-12 Signaling and Production in Macrophages | PRKCI, MAF, IL4 | |
| CCR3 Signaling in Eosinophils | PRKCI, PAK3, CALM1 | |
| CCR5 Signaling in Macrophages | PRKCI, CALM1 | |
| Calcium-induced T Lymphocyte Apoptosis | PRKCI, CALM1 | |
| p70S6K Signaling | PRKCI, PDPK1, IL4 | |
| Role of Macrophages, Fibroblasts and Endothelial Cells in Rheumatoid Arthritis | ROR2, PRKCI, MAP3K7, PRSS3 (includes EG:5646), CALM1 | |
| IL-4 Signaling | B2M, IL4 | |
| Hormonal Signaling | Aldosterone Signaling in Epithelial Cells | PIP5K1A, PRKCI, PDPK1, PIP5K1B |
| Autoimmune Thyroid Disease Signaling | TSHR, IL4 | |
| Glucocorticoid Receptor Signaling | TAF1, PRL, SMARCA2, MAP3K7, IL4 | |
| GNRH Signaling | PRKCI, PAK3, MAP3K7 | |
| Growth Hormone Signaling | PRKCI, PDPK1 | |
| Erythropoietin Signaling | PRKCI, PDPK1 | |
| Prolactin Signaling | PRKCI, PRL | |
| Oxidative Stress Signaling | NRF2-mediated Oxidative Stress Response | PRKCI, MAP3K7, MAF, GSTM4 |
| Glutathione Metabolism | GSTM4 | |
| Rac Signaling | PIP5K1A, PRKCI, PAK3, PIP5K1B | |
| Metabolism Signaling | Xenobiotic Metabolism Signaling and Detoxification | ABCB1, PRKCI, MAP3K7, MAF, GSTM4, SLC15A2*, CYB5A* |
| Type II Diabetes Mellitus Signaling | PRKCI, MAP3K7, PDPK1 | |
| Hepatic Cholestasis | ABCB1, PRKCI, MAP3K7 | |
| Inositol Phosphate Metabolism | PIP5K1A, PAK3, PIP5K1B | |
| Central Nervous System Signaling | Synaptic Long Term Potentiation | GRM2, PRKCI, CALM1 |
| Glutamate Receptor Signaling | GRM2, CALM1 | |
| Neurotrophin/TRK Signaling | PDPK1, SORCS1 | |
| Huntington’s Disease Signaling | PRKCI, HDAC4, PDPK1, RPH3A | |
| Ephrin Receptor Signaling | PAK3, EPHB2 | |
| Axonal Guidance Signaling | PRKCI, PAK3, EPHB2 |
Annotated manually according to literature
Discussion
We found that subjects with extensive WMH had unique blood RNA expression profiles compared to subjects with minimal WMH. Further, the WMH-specific gene expression changes were associated with inflammation, oxidative stress, detoxification and hormonal responses, and included genes associated with brain repair, LTP and axon guidance.
Some studies suggest that the pathogenesis of WMH and AD are related. WMH are associated with impaired memory and executive function even in healthy older subjects, 13 and may contribute to the progression from normal aging to mild cognitive impairment (MCI) 14 and from MCI to AD. 15 AD patients are more likely to have extensive WMH than age-matched controls 16 and AD patients with WMH have greater cognitive impairments than subjects with a similar pathological AD burden, but without extensive WMH. 17 Other studies, however, have not found a relationship between WMH and cognition in AD patients. 18 Thus, it is unclear whether WMH and AD represent different disease processes, whether AD is a consequence of or is exacerbated by WMH, and/or whether WMH are a consequence of AD or are exacerbated by AD.
Our study partly addresses these questions by showing that WMH+ subjects with and without AD can have similar gene expression profiles. This suggests that WMH found in normal aging and WMH found in AD patients share a molecular pathology – at least in blood – that is not secondary to AD. The results support the hypothesis that WMH in the aging brain represents a distinct pathological process with a specific cause and is a separate molecular identity despite the fact that the white matter lesions seen on MRI are non-specific and could represent any number of conditions.
Inflammatory molecules previously shown to be increased in the blood of WMH subjects include lipoprotein-associated phospholipase A2 (Lp-PLA2), myeloperoxidase (MPO), C-reactive protein and interleukin-6 (IL-6). 7, 19 Whole genome studies of post mortem brain white matter in WMH subjects found that 10.6% of WMH-related genes were involved in immune regulation. 20 These inflammatory responses in blood and brain could be the cause of or the result of the endothelial dysfunction and blood brain barrier breakdown reported in WMH+ subjects. 21
The expression of several well-known oxidative stress and detoxification genes were also increased in the blood of WMH+ subjects. Glutathione S-transferase mu 4 (GSTM4), which was 1.7 fold higher in WMH+ subjects, is a key detoxification enzyme for environmental toxins and products of oxidative stress by conjugation with glutathione. Human microsomal cytochrome b5 (CYB5A), which was also higher in the WMH+ subjects, is an electron transfer component in a number of oxidative reactions and plays an important role in catabolism of xenobiotics and oxidative stress compounds that are relevant to WMH (e.g., oxidized lipids). The expression of SLC15A2, a member of solute carrier family 15 (H+/peptide transporter), was also higher in WMH+ subjects. It translocates small peptides, including drugs and endogenous peptidomimetics such as 5-aminolevulinic acid, across biological membranes. The increased expression of SLC15A2 can protect the brain from 5-aminolevulinic acid toxicity. This could be important because ALAS2 is also higher in WMH+ subjects and it is the rate-limiting enzyme for the biosynthesis of 5-aminolevulinic acid.
There are several possible causes for the oxidative stress and detoxification responses observed in WMH+ subjects. Hypoxia and hypoperfusion have been implicated in the pathogenesis of WMH which would increase oxidative stress and anti-oxidant responses. 22 Cardiovascular disease is associated with WMH and is known to increase systemic oxidative stress. ALAS2, which is the rate-limiting enzyme of heme production and was over-expressed in the WMH+ subjects, could contribute. The correlations of WMH with increased age and with AD may relate in part or entirely to the markedly increased oxidative stress associated with age and AD.
There is axonal loss and demyelination in the brains of patients with WMH. Correspondingly, genes involved in axon formation and synaptic plasticity, such as LTP and axon guidance signaling, were associated with WMH-related expression differences (Table 2 and Supplementary Table S1). For example, microtubule-associated protein 1B (MAP1B), expressed 1.9 fold higher in WMH+ subjects, is involved in axon bundle formation. Homozygous null mutations of MAP1B in mice cause selective absence of the corpus callosum associated with misguided cortical axons. 23 Thyroid hormone receptor and prolactin, both of which were increased in WMH+ subjects, play primary roles in promoting oligodendrocyte precursor proliferation for re-myelination in adult brain. 24, 25
It is not clear how gene expression changes in blood of WMH subjects relate to CNS-function-related gene expression changes. One possibility is that the gene expression changes in the blood mirror those in the brain. 26-28 Alternatively, these genes may be expressed in circulating precursor cells or surveillance inflammatory cells in the blood that directly interact with brain cells to promote inflammation-associated injury and/or promote oligodendrocyte, myelin and axon repair.
This study is limited by its small sample size. Up to 68% of the reported 241 genes could be false positives based on the current sample size. Future studies on larger cohorts will be needed to replicate the results of this study, search for WMH and AD interactions and search for gene interactions between WMH and other co-morbidities. Whether the changes of gene expression in the blood are the cause or the consequence of the WMH, they may aid in understanding the pathophysiology of WMH and searching for the cause, monitoring progression and assessing treatment.
Supplementary Material
Acknowledgments
Sources of Funding Supported by NIH P30 AG10129 (CD), R01 AG021028 (CD), RO1 NS056302 (FRS) and the American Heart Association Bugher Foundation Center for Stroke Prevention Research (FRS, JR, LBG, KLF), NIH/NCRR UCSF-CTSI Grant Number UL1 RR024131. HX, BA and YT were supported by fellowship awards from American Stroke Association-Bugher Foundation Center for Stroke Prevention Research.
Footnotes
Disclosure The authors report no conflicts of interest.
References
- 1.DeCarli C, Massaro J, Harvey D, Hald J, Tullberg M, Au R, Beiser A, D’Agostino R, Wolf PA. Measures of brain morphology and infarction in the framingham heart study: Establishing what is normal. Neurobiol Aging. 2005;26:491–510. doi: 10.1016/j.neurobiolaging.2004.05.004. [DOI] [PubMed] [Google Scholar]
- 2.Lee DY, Fletcher E, Martinez O, Ortega M, Zozulya N, Kim J, Tran J, Buonocore M, Carmichael O, DeCarli C. Regional pattern of white matter microstructural changes in normal aging, mci, and ad. Neurology. 2009;73:1722–1728. doi: 10.1212/WNL.0b013e3181c33afb. [DOI] [PMC free article] [PubMed] [Google Scholar]
- 3.Longstreth WT, Jr, Manolio TA, Arnold A, Burke GL, Bryan N, Jungreis CA, Enright PL, O’Leary D, Fried L. Clinical correlates of white matter findings on cranial magnetic resonance imaging of 3301 elderly people. The cardiovascular health study. Stroke. 1996;27:1274–1282. doi: 10.1161/01.str.27.8.1274. [DOI] [PubMed] [Google Scholar]
- 4.Gouw AA, van der Flier WM, Fazekas F, van Straaten EC, Pantoni L, Poggesi A, Inzitari D, Erkinjuntti T, Wahlund LO, Waldemar G, Schmidt R, Scheltens P, Barkhof F. Progression of white matter hyperintensities and incidence of new lacunes over a 3-year period: The leukoaraiosis and disability study. Stroke. 2008;39:1414–1420. doi: 10.1161/STROKEAHA.107.498535. [DOI] [PubMed] [Google Scholar]
- 5.Fernando MS, Simpson JE, Matthews F, Brayne C, Lewis CE, Barber R, Kalaria RN, Forster G, Esteves F, Wharton SB, Shaw PJ, O’Brien JT, Ince PG. White matter lesions in an unselected cohort of the elderly: Molecular pathology suggests origin from chronic hypoperfusion injury. Stroke. 2006;37:1391–1398. doi: 10.1161/01.STR.0000221308.94473.14. [DOI] [PubMed] [Google Scholar]
- 6.Romero JR, Vasan RS, Beiser AS, Au R, Benjamin EJ, Decarli C, Wolf PA, Seshadri S. Association of matrix metalloproteinases with mri indices of brain ischemia and aging. Neurobiol Aging. 2009 doi: 10.1016/j.neurobiolaging.2008.11.004. Epub ahead of print. [DOI] [PMC free article] [PubMed] [Google Scholar]
- 7.Wright CB, Moon Y, Paik MC, Brown TR, Rabbani L, Yoshita M, DeCarli C, Sacco R, Elkind MS. Inflammatory biomarkers of vascular risk as correlates of leukoariosis. Stroke. 2009;40:3466–3471. doi: 10.1161/STROKEAHA.109.559567. [DOI] [PMC free article] [PubMed] [Google Scholar]
- 8.Tang Y, Lu A, Aronow BJ, Sharp FR. Blood genomic responses differ after stroke, seizures, hypoglycemia, and hypoxia: Blood genomic fingerprints of disease. Ann Neurol. 2001;50:699–707. doi: 10.1002/ana.10042. [DOI] [PubMed] [Google Scholar]
- 9.Tang Y, Xu H, Du X, Lit L, Walker W, Lu A, Ran R, Gregg JP, Reilly M, Pancioli A, Khoury JC, Sauerbeck LR, Carrozzella JA, Spilker J, Clark J, Wagner KR, Jauch EC, Chang DJ, Verro P, Broderick JP, Sharp FR. Gene expression in blood changes rapidly in neutrophils and monocytes after ischemic stroke in humans: A microarray study. J Cereb Blood Flow Metab. 2006;26:1089–1102. doi: 10.1038/sj.jcbfm.9600264. [DOI] [PubMed] [Google Scholar]
- 10.Xu H, Tang Y, Liu DZ, Ran R, Ander BP, Apperson M, Liu XS, Khoury JC, Gregg JP, Pancioli A, Jauch EC, Wagner KR, Verro P, Broderick JP, Sharp FR. Gene expression in peripheral blood differs after cardioembolic compared with large-vessel atherosclerotic stroke: Biomarkers for the etiology of ischemic stroke. J Cereb Blood Flow Metab. 2008;28:1320–1328. doi: 10.1038/jcbfm.2008.22. [DOI] [PubMed] [Google Scholar]
- 11.McKhann G, Drachman D, Folstein M, Katzman R, Price D, Stadlan EM. Clinical diagnosis of alzheimer’s disease: Report of the nincds-adrda work group under the auspices of department of health and human services task force on alzheimer’s disease. Neurology. 1984;34:939–944. doi: 10.1212/wnl.34.7.939. [DOI] [PubMed] [Google Scholar]
- 12.Yoshita M, Fletcher E, Harvey D, Ortega M, Martinez O, Mungas DM, Reed BR, DeCarli CS. Extent and distribution of white matter hyperintensities in normal aging, MCI, and AD. Neurology. 2006;67:2192–2198. doi: 10.1212/01.wnl.0000249119.95747.1f. [DOI] [PMC free article] [PubMed] [Google Scholar]
- 13.Gunning-Dixon FM, Raz N. The cognitive correlates of white matter abnormalities in normal aging: A quantitative review. Neuropsychology. 2000;14:224–232. doi: 10.1037//0894-4105.14.2.224. [DOI] [PubMed] [Google Scholar]
- 14.Smith EE, Egorova S, Blacker D, Killiany RJ, Muzikansky A, Dickerson BC, Tanzi RE, Albert MS, Greenberg SM, Guttmann CR. Magnetic resonance imaging white matter hyperintensities and brain volume in the prediction of mild cognitive impairment and dementia. Arch Neurol. 2008;65:94–100. doi: 10.1001/archneurol.2007.23. [DOI] [PubMed] [Google Scholar]
- 15.Wolf H, Ecke GM, Bettin S, Dietrich J, Gertz HJ. Do white matter changes contribute to the subsequent development of dementia in patients with mild cognitive impairment? A longitudinal study. Int J Geriatr Psychiatry. 2000;15:803–812. doi: 10.1002/1099-1166(200009)15:9<803::aid-gps190>3.0.co;2-w. [DOI] [PubMed] [Google Scholar]
- 16.Scheltens P, Barkhof F, Valk J, Algra PR, van der Hoop RG, Nauta J, Wolters EC. White matter lesions on magnetic resonance imaging in clinically diagnosed alzheimer’s disease. Evidence for heterogeneity. Brain. 1992;115(Pt 3):735–748. doi: 10.1093/brain/115.3.735. [DOI] [PubMed] [Google Scholar]
- 17.van der Flier WM, Middelkoop HA, Weverling-Rijnsburger AW, Admiraal-Behloul F, Spilt A, Bollen EL, Westendorp RG, van Buchem MA. Interaction of medial temporal lobe atrophy and white matter hyperintensities in ad. Neurology. 2004;62:1862–1864. doi: 10.1212/01.wnl.0000125337.65553.8a. [DOI] [PubMed] [Google Scholar]
- 18.Erkinjuntti T, Gao F, Lee DH, Eliasziw M, Merskey H, Hachinski VC. Lack of difference in brain hyperintensities between patients with early alzheimer’s disease and control subjects. Arch Neurol. 1994;51:260–268. doi: 10.1001/archneur.1994.00540150054016. [DOI] [PubMed] [Google Scholar]
- 19.Fornage M, Chiang YA, O’Meara ES, Psaty BM, Reiner AP, Siscovick DS, Tracy RP, Longstreth WT., Jr Biomarkers of inflammation and mri-defined small vessel disease of the brain: The cardiovascular health study. Stroke. 2008;39:1952–1959. doi: 10.1161/STROKEAHA.107.508135. [DOI] [PMC free article] [PubMed] [Google Scholar]
- 20.Simpson JE, Hosny O, Wharton SB, Heath PR, Holden H, Fernando MS, Matthews F, Forster G, O’Brien JT, Barber R, Kalaria RN, Brayne C, Shaw PJ, Lewis CE, Ince PG. Microarray rna expression analysis of cerebral white matter lesions reveals changes in multiple functional pathways. Stroke. 2009;40:369–375. doi: 10.1161/STROKEAHA.108.529214. [DOI] [PubMed] [Google Scholar]
- 21.Kearney-Schwartz A, Rossignol P, Bracard S, Felblinger J, Fay R, Boivin JM, Lecompte T, Lacolley P, Benetos A, Zannad F. Vascular structure and function is correlated to cognitive performance and white matter hyperintensities in older hypertensive patients with subjective memory complaints. Stroke. 2009;40:1229–1236. doi: 10.1161/STROKEAHA.108.532853. [DOI] [PubMed] [Google Scholar]
- 22.Caroli A, Testa C, Geroldi C, Nobili F, Guerra UP, Bonetti M, Frisoni GB. Brain perfusion correlates of medial temporal lobe atrophy and white matter hyperintensities in mild cognitive impairment. J Neurol. 2007;254:1000–1008. doi: 10.1007/s00415-006-0498-z. [DOI] [PubMed] [Google Scholar]
- 23.Meixner A, Haverkamp S, Wassle H, Fuhrer S, Thalhammer J, Kropf N, Bittner RE, Lassmann H, Wiche G, Propst F. Map1b is required for axon guidance and is involved in the development of the central and peripheral nervous system. J Cell Biol. 2000;151:1169–1178. doi: 10.1083/jcb.151.6.1169. [DOI] [PMC free article] [PubMed] [Google Scholar]
- 24.Calza L, Fernandez M, Giuliani A, D’Intino G, Pirondi S, Sivilia S, Paradisi M, Desordi N, Giardino L. Thyroid hormone and remyelination in adult central nervous system: A lesson from an inflammatory-demyelinating disease. Brain Res Brain Res Rev. 2005;48:339–346. doi: 10.1016/j.brainresrev.2004.12.022. [DOI] [PubMed] [Google Scholar]
- 25.Gregg C. Pregnancy, prolactin and white matter regeneration. J Neurol Sci. 2009;285:22–27. doi: 10.1016/j.jns.2009.06.040. [DOI] [PubMed] [Google Scholar]
- 26.Glatt SJ, Everall IP, Kremen WS, Corbeil J, Sasik R, Khanlou N, Han M, Liew C-C, Tsuang MT. Comparative gene expression analysis of blood and brain provides concurrent validation of selenbp1 up-regulation in schizophrenia. PNAS. 2005;102:15533–15538. doi: 10.1073/pnas.0507666102. [DOI] [PMC free article] [PubMed] [Google Scholar]
- 27.Achiron A, Gurevich M. Peripheral blood gene expression signature mirrors central nervous system disease: The model of multiple sclerosis. Autoimmun Rev. 2006;5:517–522. doi: 10.1016/j.autrev.2006.02.009. [DOI] [PubMed] [Google Scholar]
- 28.Sullivan PF, Fan C, Perou CM. Evaluating the comparability of gene expression in blood and brain. Am J Med Genet B Neuropsychiatr Genet. 2006;141B:261–268. doi: 10.1002/ajmg.b.30272. [DOI] [PubMed] [Google Scholar]
Associated Data
This section collects any data citations, data availability statements, or supplementary materials included in this article.