

Abstract
Thrombospondin-1 (TSP-1) expression in human adipose positively correlates with body mass index and may contribute to adipose dysfunction by activating TGF-β and/or inhibiting angiogenesis. Our objective was to determine how TSP-1 is regulated in adipocytes and polarized macrophages using a coculture system and to determine whether fatty acids, including the ω-3 fatty acid DHA, regulate TSP-1 expression. Coculture of M1, M2a, or M2c macrophages with adipocytes induced TSP-1 gene expression in adipocytes (from 2.4 to 4.2-fold, P<0.05), and adipocyte coculture induced TSP-1 gene expression in M1 and M2c macrophages (M1:8.6-fold; M2c 26-fold, P<0.05). TSP-1 protein levels in the shared media of adipocytes and M2c cells was also strongly induced by coculture (>10 fold, P<0.05). DHA treatment during the coculture of adipocytes and M2c macrophages potently inhibited theM2c macrophage TSP-1 mRNA level (97% inhibition, P<0.05). Adipocyte coculture induced IL-10 expression in M2c macrophages (10.1-fold, P<0.05), and this increase in IL-10 mRNA expression was almost completely blocked with DHA treatment (96% inhibition, P<0.05); thus, IL-10 expression closely paralleled TSP-1 expression. Since IL-10 has been shown to regulate TSP-1 in other cell types, we reduced IL-10 expression with siRNA in the M2c cells and found that this caused TSP-1 to be reduced in response to adipocyte coculture by 60% (P<0.05), suggesting that IL-10 regulates TSP-1 expression in M2c macrophages. These results suggest that supplementation with dietary ω-3 fatty acids could potentially be beneficial to adipose tissue in obesity by reducing TSP-1 and fibrosis.
Keywords: docosahexaenoic acid, thrombospondin-1, adipocyte, macrophage, IL-10
1. Introduction
Adipose tissue becomes dysfunctional with obesity, resulting in increased free fatty acids (FFAs) and inflammation, which contribute to insulin resistance. Some of the features of dysfunctional adipose tissue are increased hypoxia, fibrosis, necrotic adipocytes, and macrophages. Macrophages are capable of differentiating into “classically activated” macrophages (M1), which are inflammatory and “alternatively activated” macrophages (M2), which are anti-inflammatory and profibrotic. M2 macrophages can be further characterized as M2a or M2c macrophages, which are activated by IL-4 and IL-10 respectively. Despite the fact that macrophages are implicated in adipose dysfunction, tissue-resident macrophages perform numerous activities to maintain tissue homeostasis, and many tissue macrophages are heterogeneous with respect to their expression of M1 and M2 markers reflecting these diverse functions. In humans, more adipose tissue macrophages are observed with obesity, including macrophages expressing M1 markers, M2 markers, and both types of markers. Thus, macrophages may contribute to both the chronic state of low-grade inflammation and increased fibrosis observed in obese adipose.
Fibrosis is the excess deposition of extracellular matrix (ECM) proteins, and the adverse consequence of increased fibrosis on adipose function has only recently begun to be investigated. In mice, obesity is correlated with increased expression of collagen VI, and collagen VI knockout mice in the ob/ob background display an improved metabolic profile. Another line of evidence suggesting that reducing ECM rigidity improves adipose function is that inhibiting the collagen cross-linking enzyme lysyl oxidase also improves glucose tolerance in mice. One proposed mechanism to explain the adverse effect of fibrosis on adipose function is that a rigid extracellular matrix restricts adipocyte expansion under conditions of increased caloric intake, causing cellular stress. In humans, increased collagen VI gene expression is also positively correlated with BMI and negatively correlated with insulin sensitivity. Adipocytes and macrophages are both capable of producing ECM proteins including collagen VI, and recent studies suggest that coculture of human M2 macrophages with adipocytes induces the expression of fibrotic proteins in both cell types.
In humans, thrombospondin (TSP-1) may contribute to adipose fibrosis in obesity since TSP-1 mRNA expression positively correlates with BMI and negatively correlates with insulin sensitivity; furthermore, the insulin sensitizer pioglitazone reduces TSP-1 expression. TSP-1 induces fibrosis by activating latent TGF-β and by a TGF-β independent mechanism, and levels of both TSP-1 mRNA and protein are induced by coculture in both adipoctyes and macrophages. In mice, TSP-1 protein expression is increased in subcutaneous and gonadal fat pads in a genetic model of obesity (ob/ob mice) and is transiently induced in gonadal fat pads in a diet-induced model of obesity. Furthermore, TSP-1 knockout mice display improved metabolic function when challenged with a high fat diet, which was attributed to the fact that TSP-1 increases macrophage chemotaxis. However, TSP-1 is a multifunctional protein that inhibits angiogenesis and induces fibrosis; these additional TSP-1 functions would also be predicted to contribute to adipose dysfunction.
In this study, we examined the regulation of TSP-1in adipocytes derived from lean subjects and different types of polarized macrophages using an adipocyte-macrophage coculture system. Furthermore, we evaluated the effect of free fatty acids (FFAs) on our adipocyte macrophage cocultures, focusing on the n-3 FFA docosahexaenoic acid (DHA) because it has anti-fibrotic effects in other cell types including cardiac fibroblasts and mesangial cell. DHA has also been demonstrated to improve metabolic function in rodents. We observed that adipocyte coculture augments the macrophage expression of markers associated with alternative activation and that coculture induces TSP-1 expression in macrophages as well as adipocytes via apparently different mechanisms.
2. Materials and methods
2.1. Cell culture and coculture
THP-1 cells were maintained and induced to differentiate into polarized macrophages as described. Briefly, Corning® CellBind® 6-well tissue culture plates (Corning, NY) were coated with 1 mL per well of phenyl-ethyl-enimine(PEI) solution (1mL/L PEI in 38.8 mM boric acid, 10 mM sodium borate) for 3-hours at room temperature, washed twice with 2 mL dH2O, dried overnight, and stored at −20°C until use. The THP-1 cells (1 × 10⁶ cells per well) were then differentiated as described on the PEI coated plates. Briefly, the treatments were as follows. For M1 macrophages, the THP-1 cells were washed with macrophage serum free medium (MSFM, Life Sciences, Grand Island, NY) and incubated overnight in MSFM containing 20 ng/ml LPS from Escherichia coli 0111:B4 (Sigma, St. Louis, MO) and 20 ng/ml IFN-γ (R&D Systems, Minneapolis, MN). For M2a macrophages, the THP-1 cells were incubated in MSFM containing 25 nM phorbalmyristate acetate (PMA) for 5-minuteswhile centrifuging at 100 × g. The medium was then replaced with MSFM containing 20 ng/mL IL-4 (R&D Systems) for overnight incubation. For M2c macrophages, the treatment was the same as for M2a macrophages except that 20 ng/mL IL-10 (R&D Systems) was used instead of IL-4. After the overnight differentiation, the macrophages were cocultured with differentiated ADHASC (adult-derived human adipose stem cells) adipocytes grown on coculture inserts, which were placed in the 6-well plates containing the macrophages. The coculture media was α-MEM with 1X penicillin-streptomycin and 2% fetal bovine serum. The ADHASC cells were plated in inserts and induced to differentiate for 10–14 days as described ; the ADHASC cells used in this study were greater than 90% differentiated at the time of coculture. The ADHASC cells used in this study were isolated from women with a BMI less than 25 in the laboratories of Dr. Kern and Dr. McGehee.
2.2. Analysis of gene expression
Total RNA was prepared using an Ambion RNA queous kit (Life Technologies)and was analyzed for RNA integrity and quantity with an Agilent Bioanalyzer (Palo Alto, CA, USA). Total RNA was converted to cDNA using qScript cDNA SuperMix (Quanta Biosciences, Gaithersburg, MD) and then subjected to real time polymerase chain reaction analysis with SYBR Green PCR Master Mix (Applied Biosystems) as described. A standard curve was prepared from a pool of the cDNA to determine relative changes in gene expression, and the data fell within the curve. Gene expression was normalized to 18S expression.
2.3.Treatment with TGF-β neutralizing antibody and TGF-β receptor inhibitor
M2cmacrophages and adipocytes were differentiated and cocultured as described above in the presence of 1D11 TGF-β neutralizing antibody or SB505124 TGF-β receptor inhibitor. In the TGF-β neutralizing antibody experiment, macrophages and adipocytes were cococultured in the presence of 10μg/ml 1D11 TGF-β neutralizing antibody(R&D Systems) or a control monoclonal antibody(R&D Systems) for 24hrs. In the TGF-β receptor inhibitor experiment, macrophages and adipocytes were cococultured in the presence of DMSO vehicle control or 1μM SB505124(Sigma) for 24hrs.
2.4 Analysis of TSP-1 protein levels
The level of TSP-1 protein in the media was analyzed with a Thrombospondin-1 ELISA (R&D Systems, Minneapolis MN) according to the manufacturer’s instructions.
2.5. Recombinant IL-10 and TGF-β treatment
M2c macrophages were prepared as described above. They were then subjected to serum starvation in macrophage serum-free medium for 12-hours and then were treated with either20 ng/ml IL-10 or 5ng/mL TGF-β (R&D Systems) for 6-hours. The cells were then harvested and analyzed for RNA expression.
2.6. siRNA-mediated knockdown of IL-10
M2c macrophages were prepared described above. The macrophages were then treated for 24 hours with control or IL-10siRNA (25 nMol) and 10 μL transit TKO transfection reagent (Mirus Bio LLC, Madison, WI) as indicated. The macrophages were then cultured alone or cocultured with ADHASC cells as indicated for 24 hours and harvested for analysis of RNA expression.
2.7. Free fatty acid treatment
DHA (Cayman Chemical, Ann Arbor, MI) and all other FFAs (Sigma, St. Louis, MO) were dissolved in ethanol and then were conjugated to fatty acid free BSA (Sigma) as described. M2c macrophages were prepared in 6-well plates and cultured alone or cocultured with ADHASC cells for 24 hours in the presence of 100 μM free fatty acid or ethanol (vehicle control) as indicated. IL-10 was added at a concentration of 20 ng/mL in the presence of DHA as indicated to reverse DHA inhibition.
2.8. Conditioned medium preparation and treatments
Conditioned medium was prepared from ADHASC cells by incubating differentiated ADHASC cells in 6-well plates with 2 mL alpha MEM with 2% FBS (coculture medium). The medium was then applied to M2c macrophages (prepared as described above) with the indicated free fatty acid for 24 hours. During the same experiment, M2c macrophages were cocultured with ADHASC cells and the indicated free fatty acid as described above.
2.9. Statistical Analysis
SAS v9.3 was used for all statistical tests and P-values of less than 0.05 were considered statistically significant. The data were treated as continuous variables and were described with means and standard errors by cell expression type and coculture type. Two-way ANOVAs were used to investigate the main effects of expression type, FFA treatment (as appropriate),coculture type, and the interaction of expression type, FFA treatment (as appropriate), and coculture type. In order to make further comparisons between means, least squared means post-hoc t-tests were used. When the data suggested potential interactions (P≤0.2), comparisons were made investigating the interaction between expression type and coculture type. One-way ANOVA was used to investigate the effects of recombinant IL-10 or TGF-β treatment or free fatty acid treatment on IL-10 and TSP-1 expression. In order to make further comparisons between means, least squared means post-hoc t-tests were used.
3. Results
3.1. Adipocyte coculture augments the expression of markers associated with alternative macrophage activation
THP-1 monocytes were specifically treated to differentiate into three different subtypes of macrophages: classically activated M1 macrophages and alternatively activated M2a and M2c macrophages, and these were then cultured alone or cocultured for 24 hours with primary human adipocytes as described previously. We then analyzed the media for TSP-1 protein expression and the RNA from the macrophages and adipocytes isolated separately for gene expression. First, we determined whether adipocyte coculture altered the phenotype of the macrophages since we had previously observed that adipocyte coculture enhances the alternatively activated phenotype. The mannose receptor is a marker of alternatively activated macrophages, and we found that the MR was expressed at higher levels in M2a and M2c alternatively activated macrophages than M1 macrophages (Fig. 1A, macrophages alone, P<0.05). Adipocyte coculture further induced mannose receptor mRNA expression in M2a cells (Fig. 1A,3.7-fold increase, P<0.05). IL-10 is an anti-inflammatory cytokine, and adipocyte coculture induced IL-10 mRNA expression in M2c macrophages (Fig. 1B, 10.1-fold increase, P<0.05), consistent with previous results; however, we also observed that adipocyte coculture decreased IL-10 in M2a cells (Fig. 1B).CD163 is a marker of M2c macrophages that is induced by IL-10.CD163 mRNA was expressed in M2c macrophages and was induced by adipocyte coculture (Fig. 1C, 2.9-fold increase, P<0.05). Thus, adipocyte coculture enhances the mRNA expression of markers of alternative activation in M2a and M2c macrophages. However, it should be noted that adipocyte coculture slightly increased IL-1 mRNA levels in M2a and M2c macrophages, consistent with our previous observations (data not shown). It is important to note that we do not know the extent to which the initial cytokine treatment polarizes the cells; therefore, it is possible that the adipocytes may provide a secondary stimulus for differentiation if significantly less than 100% of the cells are initially of the M2c phenotype.
Fig. 1. Effect of adipocyte coculture on the expression of differentiation markers in polarized macrophages.

Polarized macrophages (M1, M2a, or M2c) and differentiated adipocytes were prepared as described under “Methods” and cultured alone or with adipocytes as indicated. Total RNA was prepared from the macrophages and subjected to gene expression analysis by real-time RT PCR. The data are represented as means ± SE (n=3). A) Mannose receptor (MR) expression in macrophages. *: compare to M1macrophages cultured alone (P<0.05). †: compare M2a macrophages cocultured with adipocytes to M2a macrophages cultured alone (P<0.05). B) IL-10 expression in macrophages. *: compare to M1or M2c macrophages cultured alone (P<0.05). †: compare M2c macrophages cocultured with adipocytes to M2c macrophages cultured alone (P<0.05). C) CD163 expression in macrophages. *: compare to M1or M2a macrophages cultured alone (P<0.05). †: compare M2c macrophages cocultured with adipocytes to M2c macrophages cultured alone (P<0.05).
3.2. Adipocyte coculture augments the expression of TSP-1mRNA in M1 and M2c macrophages
TSP-1 expression is increased in PMA-activated macrophages by adipocyte coculture, but its regulation in cytokine-polarized macrophages is unknown. Adipocyte coculture strongly induced the mRNA expression of TSP-1 inM1 (Fig. 2A, 8.6-fold increase, P<0.05) and M2c (Fig. 2A, 26-fold increase, P<0.05) macrophages, but TSP-1 was not induced in M2a macrophages, indicating that this induction is specific to the polarization state of the macrophages. Since TSP-1 could potentially activate TGF-β, we examined the mRNA expression of connective tissue growth factor (CTGF) and collagen I, downstream targets of TGF-β signaling, and found that CTGF mRNA expression is induced in macrophages by coculture with adipocytes (Fig. 2B, effect of adipocyte coculture: P<0.05).Collagen I mRNA was also induced by adipocyte coculture in M1 (Fig. 2C,2.7-fold increase, P<0.05) and M2c macrophages (Fig. 2C, 2.4-fold increase, P<0.05). Thus, the mRNA expression patterns of CTGF and collagen I corresponded with macrophage TSP-1 expression.
Fig. 2. Effect of adipocyte coculture on the expression of TSP-1, CTGF, and Collagen I in macrophages.

Total RNA was prepared from the macrophages from the experiment in Fig. 1 and subjected to gene expression analysis by real-time RT PCR. The data are represented as means ± SE (n=3).A) TSP-1 mRNA expression in macrophages. *: compare M1 macrophages cocultured with adipocytes toM1 macrophages cultured alone (P<0.05). **: compare M2c macrophages cocultured with adipocytes to M2c macrophages cultured alone (P<0.05). B) CTGF expression. *: the effect of adipocyte coculture on macrophage TSP-1 expression (P<0.05). C) Collagen I mRNA expression in macrophages. *: compare M1 macrophages cocultured with adipocytes to M1 macrophages cultured alone (P<0.05). **: compare M2c macrophages cocultured with adipocytes to M2c macrophages cultured alone (P<0.05). D) TSP-1 mRNA expression in adipocytes.*: compare adipocytes cocultured with M1, or M2a, or M2c macrophages to adipocytes cultured alone (P<0.05).E) CTGF mRNA expression in adipocytes. *: compare adipocytes cocultured with M1or M2c macrophages to adipocytes cultured alone (P<0.05). F) Collagen I mRNA expression in adipocytes. G) Inhibition of CTGF induction by inhibiting TGF-β. *: compare 1D11 to control antibody (P< 0.05). **: compare SB505124 to DMSO control (P=0.056).
Adipocytes cultured alone expressed TSP-1 mRNA, and coculture with each of the three types of polarized macrophages induced TSP-1 mRNA in adipocytes (Fig. 2D, 2.4-fold by M1, 3.6-fold by M2a, and 4.2-fold by M2c macrophages, P<0.05). CTGF mRNA was expressed in adipocytes cultured alone and was also induced in adipocytes by coculture with M1 (Fig. 2E, 1.6-fold increase, P<0.05) and M2c (Fig. 2E, 2.4-fold increase, P<0.05) macrophages. The expression pattern of CTGF in adipocytes did not exactly match the adipocyte TSP-1 expression pattern as it did in macrophages (Fig. 1A and Fig. 1B); however, the cells share the same media, which may explain the increase of CTGF in adipocytes cocultured with M1 and M2c macrophages (see next section). Collagen I was not induced in adipocytes by macrophage coculture, suggesting that it may be regulated differently in macrophages and adipocytes (Fig. 2F)
The results of these studies suggest that TGF-β signaling is increased by the increased expression of TSP-1 during M2c macrophage coculture with adipocytes. To test this, we included control or TGF-β neutralizing monoclonal antibody 1D11 in aM2c macrophage-adipocyte coculture experiment; we also performed this experiment with vehicle control (DMSO) or the TGF-β receptor inhibitor SB505124. As shown in Fig. 2G, 1D11 inhibited CTGF expression by 48% (P<0.05), and SB505124 inhibited CTGF expression by 40% (P=0.056), suggesting that coculture induces TGF-β signaling, which then induces CTGF mRNA expression.
3.3. Effect of coculture on TSP-1 protein expression
Since TSP-1 was induced by coculture in both adipocytes and macrophages, we evaluated TSP-1 protein expression in the media shared by both of these cells in the coculture experiment. The TSP-1 protein level was low(128 ng/mL)in the media from adipocytes cultured alone and barely detectable in the media from macrophages cultured alone (Fig. 3).Coculture induced TSP-1 protein levels in the media from M1 (Fig. 3, P<0.05) and M2c (Fig. 3, P<0.05) macrophages cocultured with adipocytes. An interesting observation from this experiment is that the pattern of TSP-1protein expression in the media (Fig. 3) was more similar to the expression of TSP-1 mRNA in the macrophages (Fig. 2A) than the adipocytes (Fig. 2D), suggesting that more TSP-1 is secreted into the media when M1 or M2c macrophages are cocultured with adipocytes than when M2a macrophages are cocultured with adipocytes. This may explain the increased expression of the TGF-β regulated gene CTGF in adipocytes cocultured with M1 and M2c macrophages.
Fig. 3. Effect of adipocyte coculture on the expression of TSP-1 protein in the media.

The media from the coculture experiment in Fig. 1 was collected and analyzed for TSP-1protein expression by ELISA. The data are represented as means ± SE (n=3).†: compare M1 macrophages cocultured with adipocytes to M1 macrophages cultured alone (P<0.05). ††: compare M2c macrophages cocultured with adipocytes to M2c macrophages cultured alone (P<0.05). *: effect of coculture (P<0.05).
3.4. Mechanism of TSP-1induction in M2c macrophages by adipocyte coculture
Next, we wanted to begin to understand the mechanism of TSP-1induction by coculture. We did these experiments in M2c cells since there was such a strong correlation in the mRNA expression patterns between IL-10 and TSP-1 in M2c macrophages in response to coculture(Fig. 1B) and IL-10 has previously been shown to up regulate TSP-1 in dendritic cells. Therefore, it is possible that the strong induction of TSP-1 expression in M2c macrophages by adipocyte coculture(Fig. 1B and Fig. 2A) may be due to IL-10.To begin to assess this, we treated M2c macrophages with either recombinant IL-10 or TGF-β, which also induces TSP-1in dendritic cells as a control. As expected, IL-10 gene expression was induced by IL-10 treatment (Fig. 4A, P<0.05) but not by TGF-β. TSP-1 gene expression was induced by IL-10 in M2c macrophages (Fig. 4B, P<0.05) and tended to be induced by TGF-β(Fig. 4B, P=.07). We then determined whether IL-10 induction of TSP-1 by adipocyte coculture was physiologically relevant by treating M2c macrophages with control or IL-10 siRNA and then coculturing these cells with adipocytes to induce IL-10 and TSP-1 gene expression. M2c macrophages transfected with IL-10 siRNA expressed less IL-10 mRNA than macrophages transfected with a control siRNA in response to adipocyte coculture as expected (Fig. 5A, P<0.05). IL-10 siRNA transfected M2c macrophages also expressed less TSP-1 mRNA than control cells (Fig. 5B, P<0.05) in response to adipocyte coculture, suggesting that IL-10 induction is necessary for TSP-1 induction in M2c macrophages in response to adipocyte coculture. Of note, IL-10 was not induced in adipocytes by M2c macrophage coculture (data not shown).
Fig. 4. Effect of treatment with recombinant IL-10 or TGF-β on IL-10 and TSP-1 in M2c macrophages.
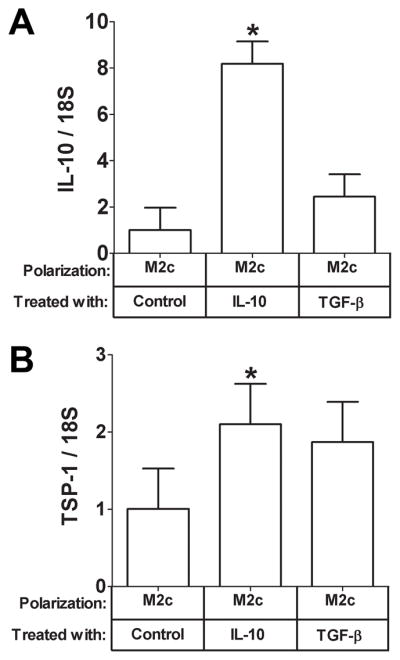
M2c macrophages were serum starved for 12 hours and then were treated for 6 hours with vehicle control, or IL-10 (20 ng/mL), or TGF-β(5 ng/mL) as indicated. Total RNA was prepared and subjected to gene expression analysis by real-time RT PCR. The data are represented as means ± SE (n=3) A) IL-10 expression. *: compare IL-10 expression in cells treated with recombinant IL-10 to control treated M2c macrophages. B) TSP-1expression. *: compare TSP-1 expression in cells treated with recombinant IL-10 to control treated M2c macrophages (P<0.05).
Fig. 5. Effect of siRNA-mediated reduction of IL-10 on IL-10 and TSP-1 in M2c macrophages cocultured with adipocytes.

M2c macrophages were treated with the indicated siRNA and then cocultured with adipocytes as indicated. Total RNA was prepared and subjected to gene expression analysis by real-time RT PCR. The data are represented as means ± SE (n=3) A) IL-10 expression. *: compare IL-10 expression in M2c macrophages cocultured with adipocytes and treated with IL-10 siRNA to control siRNA treated M2c macrophages (P<0.05). B) TSP-1 expression. *: compare TSP-1 expression in M2c macrophages cocultured with adipocytes and treated with IL-10 siRNA to control siRNA treated M2c macrophages (P<0.05).
3.5. Effect of FFAs on the induction of TSP-1 and IL-10 in M2c macrophages by adipocyte coculture
We next tested the effect of different FFAs on the adipocyte-macrophage cocultures. IL-10 and TSP-1 gene expression was induced in M2c macrophages by adipocyte coculture as expected (Fig. 6A: TSP-1, P<0.05; Fig 6B: IL-10, P<.0001). Interestingly, in contrast to linoleic, oleic, and palmitic acid, the omega-3 fatty acids, DHA and EPA significantly inhibited the coculture-induced increases in TSP-1 and IL-10 mRNA. DHA potently inhibited both TSP-1 (Fig. 6A, 97 % inhibition, P<0.05) and IL-10 (Fig. 6B, 96 % inhibition, P<0.05) mRNA induction by adipocyte coculture in M2c macrophages. EPA was also effective but not as potent as DHA(Fig. 6A and B, P<0.05),suggesting that the inhibition is specific to omega-3 fatty acids. When we performed the coculture experiment described in Fig. 3, we also treated an identical set of cells with 100 μM DHA. As shown in Fig. 6C, DHA inhibited the protein level of TSP-1 in the shared coculture media of M2c macrophages and adipocytes (P<0.05), consistent with its inhibition of TSP-1 mRNA in M2c macrophages as described above (Fig 6A). DHA treatment of adipocytes alone did not alter the level of TSP-1 protein secreted into the media (Fig. 6C).TSP-1 and IL-10 displayed remarkably similar patterns of expression in response to the different fatty acids tested (compare Fig. 6A and B), which would be consistent with IL-10 regulating TSP-1 expression (see above). We further evaluated this by adding exogenous IL-10 to the coculture experiement in the presence of DHA to determine whether this would reverse the inhibition of DHA on TSP-1 and IL-10. As shown in Fig. 6D, the addition of IL-10 completely reversed the inhibition of DHA on both IL-10 and TSP-1 (P<0.05), consistent with IL-10 regulating TSP-1 expression in M2c macrophages (Figs. 4 and 5).
Fig. 6. Effect of Free Fatty Acids on IL-10 and TSP-1 in M2c macrophages cocultured with adipocytes.

M2c macrophages were cultured alone or cocultured with adipocytes in the presence of the indicated free fatty acids (C, Control; DHA, docosahexaenoic acid; EPA, eicosapentanoic acid; Lin, Linoleic acid; O, Oleic acid; P, palmitic acid) at a concentration of 100 μM. Total RNA was prepared and subjected to gene expression analysis by real-time RT PCR. The data are represented as means ± SE (n=3) A) TSP-1 expression. *, **: compare TSP-1 expression in cells treated with the indicated free fatty acid to control treated M2c macrophages (P<0.05). B) *, **: compare IL-10 expression in cells treated with the indicated free fatty acid to control treated M2c macrophages (P<0.05). C)The media from the coculture experiment done in the absence and presence of 100 μM DHA was collected and analyzed for TSP-1 protein expression by ELISA. The data are represented as means ± SE (n=3). *: effect of DHA treatment on TSP-1 in adipocyte-M2c macrophage cocultures (P<0.05). D) The coculture experiment was repeated in the presence of 20 ng/mL IL-10 as indicated; open columns indicate TSP-1 expression; shaded columns indicate IL-10 expression. The data are represented as means ± SE (n=3).*: compare TSP-1 expression to control cells; **: compare TSP-1 expression to DHA-treated cells (P< 0.05). #: compare IL-10 expression to control cells; ##: compare IL-10 expression to DHA-treated cells (P< 0.05).
These data suggest that adipocytes secrete a factor that can up-regulate TSP-1 expression in M2c macrophages and that this up-regulation is potently inhibited by DHA. In order to determine whether DHA acts on adipocytes, or on M2c macrophages, or on both, we compared adipocyte conditioned media to adipocyte coculture for their ability to induce TSP-1 in M2c macrophages in the presence of different FFAs. Coculture of adipocytes induced TSP-1 gene expression approximately 4-fold higher than adipocyte conditioned media (Fig. 7, compare controls from conditioned media and coculture, P<0.05), suggesting that the factor that induces TSP-1 is labile. Of more interest, DHA only inhibited TSP-1 expression in the coculture conditions (Fig. 7, P<0.05), suggesting that DHA might act on the adipocyte to regulate the factor that induces TSP-1 in M2c cells. Alternatively, the effect of DHA may be mediated by one of its many known biologically active metabolites. To test this, medium from adipocytes conditioned in the presence of DHA was evaluated. This media also failed to inhibit the induction of TSP-1 (data not shown).Thus, the effect of DHA is complex and requires the presence of both cells to be effective at inhibiting the induction of TSP-1 gene expression in M2c macrophages by adipocytes.
Fig. 7. Effect of using adipocyte conditioned medium versus coculture on the ability of FFAs to inhibit TSP-1 expression.

M2c macrophages were treated with adipocyte conditioned media in the presence of the indicated FFA or cocultured with adipocytes in the presence of the indicated FFA as indicated (C, Control; DHA, docosahexaenoic acid; EPA, eicosapentanoic acid; Lin, Linoleic acid; O, Oleic acid). Total RNA was prepared and subjected to gene expression analysis by real-time RT PCR. The data are represented as means ± SE (n=3) TSP-1 expression.#: compare TSP-1 expression in cells treated with conditioned media or cocultured with adipocytes (P<0.05). *: compare TSP-1 expression in M2c macrophages treated with the indicated free fatty acid to control treated M2c macrophages (P<0.05).
4. Discussion
Thrombospondin-1 is increased in the adipose of obese human subjects and, therefore, may contribute to the increased fibrosis and decreased angiogenesis that is also observed. This study demonstrates that TSP-1 is increased in adipocytes by coculture with macrophages and that the magnitude of the increase is dependent on the polarity of the cocultured macrophage. TSP-1 is also induced in M1 and M2c macrophages but not M2a macrophages by adipocyte coculture. The induction of TSP-1 by adipocyte coculture in M2c macrophages likely is due to the induction of IL-10 since siRNA-mediated knockdown of IL-10 inhibits induction of TSP-1in M2c macrophages by adipocytes. Interestingly, this induction is inhibited by n-3 FFAs, especially DHA, but not other FFAs. DHA potently inhibits both TSP-1 induction and IL-10 induction, and the addition of exogenous IL-10 reverses this inhibition, further suggesting that IL-10 regulates TSP-1 expression in M2c macrophages. The factor that is secreted by adipocytes to cause IL-10 and TSP-1 induction is unknown, but is likely labile since adipocyte co-culture induces TSP-1 in M2c macrophages more effectively than conditioned medium. Finally, the mechanism of inhibition by DHA is complex since it requires coculture; adding DHA to adipocyte conditioned medium is not effective at inhibiting TSP-1 induction.
When we characterized the phenotype of the differentiated macrophages used in this study, we found that adipocyte coculture augmented the expression of the mannose receptor in M2c macrophages and augmented the expression of IL-10 and CD163 in M2c cells. This suggests that human adipocytes promote the M2 phenotype, and the expression of M2 markers is a prominent feature of human adipose tissue macrophages under both lean and obese conditions. These M2 markers are important to the anti-inflammatory functions of M2 macrophages since IL-10 is well known to be anti-inflammatory, and engaging the mannose receptor induces IL-10 production. These results suggest that adipocytes may program adipose resident macrophages to be less inflammatory although it should be noted that IL-1 levels increased slightly in response to coculture, which is consistent with previous results. In another study using mouse adipocytes and macrophages, a strong inflammatory response was induced by coculture. It will be interesting to determine whether coculture of human macrophages with adipocytes reduces their inflammatory response to toll like receptor (TLR) agonists such as LPS. It will also be important to identify the adipocyte factors that enhance the expression of M2 markers in macrophages and why this occurs since macrophages that express M2 markers in adipose are associated with obesity in humans. Finally, the adipocytes used in this study were derived from adipose stem cells of lean subjects. It would therefore be of interest to determine whether adipocytes derived from obese subjects display the same properties or are less effective at inducing Il-10 and TSP-1.
One of the important functions of alternatively activated macrophages, especially M2c macrophages, is the resolution of inflammation and wound healing, and TSP-1 is important in both of these processes. However, aberrant TSP-1 expression may lead to increased TGF-β signaling, fibrosis, and reduced angiogenesis, and increased TSP-1 expression is associated with obesity. Since adipocyte coculture enhances the expression of IL-10 in M2c macrophages and coculture increases TSP-1 in phorbalmyristate acetate-activated macrophages, we decided to evaluate TSP-1 expression in this coculture study using macrophages activated to three specific polarizations by cytokine treatment. TSP-1 was induced in both adipocytes and macrophages by coculture, and coculture with M2c macrophages resulted in the highest TSP-1 expression in both adipocytes and M2c macrophages. Furthermore, the highest TSP-1 protein levels were observed in the M2c macrophage-adipocyte cocultures. This may explain the strong association of M2c macrophages with fibrosis in adipose with obesity.
We found that IL-10 and TSP-1 displayed similar patterns of expression in M2c macrophages and that IL-10 could regulate TSP-1 expression. IL-10 and TSP-1 have been demonstrated to have similar expression patterns in other cell types as well. This would make sense given that both of these proteins are involved in the resolution of wound healing. Interestingly, TSP-1 was also induced inM1 macrophages, which did not express IL-10, suggesting that another mechanism regulates TSP-1induction in M1 macrophages. Also, TSP-1 was induced in adipocytes by all three macrophage subtypes, again suggesting IL-10-independent mechanisms of induction in adipocytes by M1 and M2a macrophage coculture. Finally, the profile of TSP-1 protein expression resembled the macrophage mRNA expression profile more than the adipocyte mRNA expression profile, suggesting that TSP-1 secretion is strongly influenced by the macrophage subtype.
Free fatty acids are an important component of the adipose environment, and n-3 FFAs may be a beneficial nutritional supplement. DHA potently inhibited both IL-10 and TSP-1 induction in M2c macrophages by adipocyte coculture. DHA is considered to be anti-inflammatory so the inhibition of IL-10 was somewhat surprising; however, it is consistent with previous reports. Inhibition of IL-10 would be predicted to have detrimental effects on adipose by increasing inflammation; whereas, inhibition of TSP-1would be predicted to have beneficial effects by reducing fibrosis and increasing angiogenesis. Indeed, TSP-1 knockout mice have improved glucose tolerance in response to high fat feeding. Finally, the mechanism of inhibition of TSP-1 expression by DHA is complex since it requires coculture. This suggests that DHA interferes with macrophage–adipocyte cross talk during coculture to reduce the factor that induces IL-10 and TSP-1. This cross talk may involve TLR signaling, which is induced in mouse adipocyte macrophage coculture systems and is inhibited by DHA at multiple levels. TLR receptor signaling initiates IL-10 induction in macrophages, and in addition to their well-known role in innate immunity, TLRs can recognize endogenous ligands including saturated fatty acids and proteins, which could be generated by adipocytes. Alternatively, the inhibition of IL-10 by DHA may be by one of its proresolving metabolites.
Previous studies in humans have demonstrated a variety of anti-inflammatory effects of fish oil supplementation ; however, fish oil supplementation does not reduce plasma inflammatory markers or improve insulin sensitivity in humans. This study suggests that fish oil supplementation may have complex effects and may depend on the state of activation of resident macrophages.
Acknowledgments
We would like to acknowledge Greg Nolen and Catherine Gurley for technical assistance with isolation of the ADHASC cells and Heather Bush, Ph.D. for help with the statistical analysis of the data.
This and work was supported by the following grants: DK 80327 and UL1RR033173 (P.A.K.); DK 71349 (C.A.P. and P.A.K.);AG20941 (C.A.P); UL1RR029884 (R.E.M.)
Abbreviations
- TSP-1
thrombospondin-1
- DHA
docosahexaenoic acid
- EPA
eicosapentaenoic acid
- FFA
free fatty acid
- ECM
extracellular matrix
- ADHASC
adult-derived human adipose stem cells
- CTGF
connective tissue growth factor
- PMA
phorbalmyristate acetate
- TLR
Toll like receptor
Footnotes
Publisher's Disclaimer: This is a PDF file of an unedited manuscript that has been accepted for publication. As a service to our customers we are providing this early version of the manuscript. The manuscript will undergo copyediting, typesetting, and review of the resulting proof before it is published in its final citable form. Please note that during the production process errors may be discovered which could affect the content, and all legal disclaimers that apply to the journal pertain.
References
- 1.Boden G. Obesity, insulin resistance and free fatty acids. Curr Opin Endocrinol Diabetes Obes. 2011;18:139–43. doi: 10.1097/MED.0b013e3283444b09. [DOI] [PMC free article] [PubMed] [Google Scholar]
- 2.Di Gregorio GB, Yao-Borengasser A, Rasouli N, Varma V, Lu T, Miles LM, et al. Expression of CD68 and macrophage chemoattractant protein-1 genes in human adipose and muscle tissues: association with cytokine expression, insulin resistance, and reduction by pioglitazone. Diabetes. 2005;54:2305–13. doi: 10.2337/diabetes.54.8.2305. [DOI] [PubMed] [Google Scholar]
- 3.Weisberg SP, McCann D, Desai M, Rosenbaum M, Leibel RL, Ferrante AW., Jr Obesity is associated with macrophage accumulation in adipose tissue. J Clin Invest. 2003;112:1796–808. doi: 10.1172/JCI19246. [DOI] [PMC free article] [PubMed] [Google Scholar]
- 4.Xu H, Barnes GT, Yang Q, Tan G, Yang D, Chou CJ, et al. Chronic inflammation in fat plays a crucial role in the development of obesity-related insulin resistance. J Clin Invest. 2003;112:1821–30. doi: 10.1172/JCI19451. [DOI] [PMC free article] [PubMed] [Google Scholar]
- 5.Sun K, Kusminski CM, Scherer PE. Adipose tissue remodeling and obesity. J Clin Invest. 2011;121:2094–101. doi: 10.1172/JCI45887. [DOI] [PMC free article] [PubMed] [Google Scholar]
- 6.Olefsky JM, Glass CK. Macrophages, inflammation, and insulin resistance. Annu Rev Physiol. 2010;72:219–46. doi: 10.1146/annurev-physiol-021909-135846. [DOI] [PubMed] [Google Scholar]
- 7.Mantovani A, Sica A, Sozzani S, Allavena P, Vecchi A, Locati M. The chemokine system in diverse forms of macrophage activation and polarization. Trends Immunol. 2004;25:677–86. doi: 10.1016/j.it.2004.09.015. [DOI] [PubMed] [Google Scholar]
- 8.Stout RD, Suttles J. Functional plasticity of macrophages: reversible adaptation to changing microenvironments. J Leukoc Biol. 2004;76:509–13. doi: 10.1189/jlb.0504272. [DOI] [PMC free article] [PubMed] [Google Scholar]
- 9.Wentworth JM, Naselli G, Brown WA, Doyle L, Phipson B, Smyth GK, et al. Pro-inflammatory CD11c+CD206+ adipose tissue macrophages are associated with insulin resistance in human obesity. Diabetes. 2010;59:1648–56. doi: 10.2337/db09-0287. [DOI] [PMC free article] [PubMed] [Google Scholar]
- 10.Spencer M, Yao-Borengasser A, Unal R, Rasouli N, Gurley CM, Zhu B, et al. Adipose tissue macrophages in insulin-resistant subjects are associated with collagen VI and fibrosis and demonstrate alternative activation. Am J Physiol Endocrinol Metab. 2010;299:E1016–27. doi: 10.1152/ajpendo.00329.2010. [DOI] [PMC free article] [PubMed] [Google Scholar]
- 11.Zeyda M, Farmer D, Todoric J, Aszmann O, Speiser M, Gyori G, et al. Human adipose tissue macrophages are of an anti-inflammatory phenotype but capable of excessive pro-inflammatory mediator production. Int J Obes (Lond) 2007;31:1420–8. doi: 10.1038/sj.ijo.0803632. [DOI] [PubMed] [Google Scholar]
- 12.Bourlier V, Zakaroff-Girard A, Miranville A, De Barros S, Maumus M, Sengenes C, et al. Remodeling phenotype of human subcutaneous adipose tissue macrophages. Circulation. 2008;117:806–15. doi: 10.1161/CIRCULATIONAHA.107.724096. [DOI] [PubMed] [Google Scholar]
- 13.Khan T, Muise ES, Iyengar P, Wang ZV, Chandalia M, Abate N, et al. Metabolic dysregulation and adipose tissue fibrosis: role of collagen VI. Mol Cell Biol. 2009;29:1575–91. doi: 10.1128/MCB.01300-08. [DOI] [PMC free article] [PubMed] [Google Scholar]
- 14.Halberg N, Khan T, Trujillo ME, Wernstedt-Asterholm I, Attie AD, Sherwani S, et al. Hypoxia-inducible factor 1alpha induces fibrosis and insulin resistance in white adipose tissue. Mol Cell Biol. 2009;29:4467–83. doi: 10.1128/MCB.00192-09. [DOI] [PMC free article] [PubMed] [Google Scholar]
- 15.Pasarica M, Sereda OR, Redman LM, Albarado DC, Hymel DT, Roan LE, et al. Reduced adipose tissue oxygenation in human obesity: evidence for rarefaction, macrophage chemotaxis, and inflammation without an angiogenic response. Diabetes. 2009;58:718–25. doi: 10.2337/db08-1098. [DOI] [PMC free article] [PubMed] [Google Scholar]
- 16.Varma V, Yao-Borengasser A, Bodles AM, Rasouli N, Phanavanh B, Nolen GT, et al. Thrombospondin-1 is an adipokine associated with obesity, adipose inflammation, and insulin resistance. Diabetes. 2008;57:432–9. doi: 10.2337/db07-0840. [DOI] [PMC free article] [PubMed] [Google Scholar]
- 17.Schultz-Cherry S, Murphy-Ullrich JE. Thrombospondin causes activation of latent transforming growth factor-beta secreted by endothelial cells by a novel mechanism. J Cell Biol. 1993;122:923–32. doi: 10.1083/jcb.122.4.923. [DOI] [PMC free article] [PubMed] [Google Scholar]
- 18.Sweetwyne MT, Pallero MA, Lu A, Van Duyn Graham L, Murphy-Ullrich JE. The calreticulin-binding sequence of thrombospondin 1 regulates collagen expression and organization during tissue remodeling. Am J Pathol. 2010;177:1710–24. doi: 10.2353/ajpath.2010.090903. [DOI] [PMC free article] [PubMed] [Google Scholar]
- 19.Voros G, Maquoi E, Demeulemeester D, Clerx N, Collen D, Lijnen HR. Modulation of angiogenesis during adipose tissue development in murine models of obesity. Endocrinology. 2005;146:4545–54. doi: 10.1210/en.2005-0532. [DOI] [PubMed] [Google Scholar]
- 20.Li Y, Tong X, Rumala C, Clemons K, Wang S. Thrombospondin 1 deficiency reduces obesity-associated inflammation and improves insulin sensitivity in a diet-induced obese mouse model. PLoS One. 2011;6:e26656. doi: 10.1371/journal.pone.0026656. [DOI] [PMC free article] [PubMed] [Google Scholar]
- 21.Bornstein P. Thrombospondins function as regulators of angiogenesis. J Cell Commun Signal. 2009;3:189–200. doi: 10.1007/s12079-009-0060-8. [DOI] [PMC free article] [PubMed] [Google Scholar]
- 22.Sweetwyne MT, Murphy-Ullrich JE. Thrombospondin 1 in tissue repair and fibrosis: TGF-beta-dependent and independent mechanisms. Matrix Biol. 2012;31:178–86. doi: 10.1016/j.matbio.2012.01.006. [DOI] [PMC free article] [PubMed] [Google Scholar]
- 23.Rutkowski JM, Davis KE, Scherer PE. Mechanisms of obesity and related pathologies: the macro- and microcirculation of adipose tissue. FEBS J. 2009;276:5738–46. doi: 10.1111/j.1742-4658.2009.07303.x. [DOI] [PMC free article] [PubMed] [Google Scholar]
- 24.Priante G, Musacchio E, Valvason C, Baggio B. EPA and DHA suppress AngII- and arachidonic acid-induced expression of profibrotic genes in human mesangial cells. J Nephrol. 2009;22:137–43. [PubMed] [Google Scholar]
- 25.Chen J, Shearer GC, Chen Q, Healy CL, Beyer AJ, Nareddy VB, et al. Omega-3 fatty acids prevent pressure overload-induced cardiac fibrosis through activation of cyclic GMP/protein kinase G signaling in cardiac fibroblasts. Circulation. 2011;123:584–93. doi: 10.1161/CIRCULATIONAHA.110.971853. [DOI] [PMC free article] [PubMed] [Google Scholar]
- 26.Oh DY, Talukdar S, Bae EJ, Imamura T, Morinaga H, Fan W, et al. GPR120 is an omega-3 fatty acid receptor mediating potent anti-inflammatory and insulin-sensitizing effects. Cell. 2010;142:687–98. doi: 10.1016/j.cell.2010.07.041. [DOI] [PMC free article] [PubMed] [Google Scholar]
- 27.Storlien LH, Kraegen EW, Chisholm DJ, Ford GL, Bruce DG, Pascoe WS. Fish oil prevents insulin resistance induced by high-fat feeding in rats. Science. 1987;237:885–8. doi: 10.1126/science.3303333. [DOI] [PubMed] [Google Scholar]
- 28.Finlin BS, Varma V, Nolen GT, Dube J, Starnes CP, Rasouli N, et al. DHA reduces the atrophy-associated Fn14 protein in differentiated myotubes during coculture with macrophages. J Nutr Biochem. 2012;23:885–91. doi: 10.1016/j.jnutbio.2011.04.013. [DOI] [PMC free article] [PubMed] [Google Scholar]
- 29.Igarashi A, Okochi H, Bradham DM, Grotendorst GR. Regulation of connective tissue growth factor gene expression in human skin fibroblasts and during wound repair. Mol Biol Cell. 1993;4:637–45. doi: 10.1091/mbc.4.6.637. [DOI] [PMC free article] [PubMed] [Google Scholar]
- 30.Jung H, Kim HH, Lee DH, Hwang YS, Yang HC, Park JC. Transforming growth factor-beta 1 in adipose derived stem cells conditioned medium is a dominant paracrine mediator determines hyaluronic acid and collagen expression profile. Cytotechnology. 2011;63:57–66. doi: 10.1007/s10616-010-9327-4. [DOI] [PMC free article] [PubMed] [Google Scholar]
- 31.Doyen V, Rubio M, Braun D, Nakajima T, Abe J, Saito H, et al. Thrombospondin 1 is an autocrine negative regulator of human dendritic cell activation. J Exp Med. 2003;198:1277–83. doi: 10.1084/jem.20030705. [DOI] [PMC free article] [PubMed] [Google Scholar]
- 32.Torres-Aguilar H, Aguilar-Ruiz SR, Gonzalez-Perez G, Munguia R, Bajana S, Meraz-Rios MA, et al. Tolerogenic dendritic cells generated with different immunosuppressive cytokines induce antigen-specific anergy and regulatory properties in memory CD4+ T cells. J Immunol. 2010;184:1765–75. doi: 10.4049/jimmunol.0902133. [DOI] [PubMed] [Google Scholar]
- 33.Spencer M, Unal R, Zhu B, Rasouli N, McGehee RE, Jr, Peterson CA, et al. Adipose tissue extracellular matrix and vascular abnormalities in obesity and insulin resistance. J Clin Endocrinol Metab. 2011;96:E1990–8. doi: 10.1210/jc.2011-1567. [DOI] [PMC free article] [PubMed] [Google Scholar]
- 34.Pasarica M, Rood J, Ravussin E, Schwarz JM, Smith SR, Redman LM. Reduced oxygenation in human obese adipose tissue is associated with impaired insulin suppression of lipolysis. J Clin Endocrinol Metab. 2010;95:4052–5. doi: 10.1210/jc.2009-2377. [DOI] [PMC free article] [PubMed] [Google Scholar]
- 35.Pasarica M, Gowronska-Kozak B, Burk D, Remedios I, Hymel D, Gimble J, et al. Adipose tissue collagen VI in obesity. J Clin Endocrinol Metab. 2009;94:5155–62. doi: 10.1210/jc.2009-0947. [DOI] [PMC free article] [PubMed] [Google Scholar]
- 36.Moore KW, de Waal Malefyt R, Coffman RL, O’Garra A. Interleukin-10 and the interleukin-10 receptor. Annu Rev Immunol. 2001;19:683–765. doi: 10.1146/annurev.immunol.19.1.683. [DOI] [PubMed] [Google Scholar]
- 37.Suganami T, Tanimoto-Koyama K, Nishida J, Itoh M, Yuan X, Mizuarai S, et al. Role of the Toll-like receptor 4/NF-kappaB pathway in saturated fatty acid-induced inflammatory changes in the interaction between adipocytes and macrophages. Arterioscler Thromb Vasc Biol. 2007;27:84–91. doi: 10.1161/01.ATV.0000251608.09329.9a. [DOI] [PubMed] [Google Scholar]
- 38.Kawakami T, Tokunaga T, Hatanaka H, Tsuchida T, Tomii Y, Osada H, et al. Interleukin 10 expression is correlated with thrombospondin expression and decreased vascular involvement in colon cancer. Int J Oncol. 2001;18:487–91. doi: 10.3892/ijo.18.3.487. [DOI] [PubMed] [Google Scholar]
- 39.Petursdottir DH, Olafsdottir I, Hardardottir I. Dietary fish oil increases tumor necrosis factor secretion but decreases interleukin-10 secretion by murine peritoneal macrophages. J Nutr. 2002;132:3740–3. doi: 10.1093/jn/132.12.3740. [DOI] [PubMed] [Google Scholar]
- 40.Wong SW, Kwon MJ, Choi AM, Kim HP, Nakahira K, Hwang DH. Fatty acids modulate Toll-like receptor 4 activation through regulation of receptor dimerization and recruitment into lipid rafts in a reactive oxygen species-dependent manner. J Biol Chem. 2009;284:27384–92. doi: 10.1074/jbc.M109.044065. [DOI] [PMC free article] [PubMed] [Google Scholar]
- 41.Singer P, Shapiro H, Theilla M, Anbar R, Singer J, Cohen J. Anti-inflammatory properties of omega-3 fatty acids in critical illness: novel mechanisms and an integrative perspective. Intensive care medicine. 2008;34:1580–92. doi: 10.1007/s00134-008-1142-4. [DOI] [PubMed] [Google Scholar]
- 42.Saraiva M, O’Garra A. The regulation of IL-10 production by immune cells. Nat Rev Immunol. 2010;10:170–81. doi: 10.1038/nri2711. [DOI] [PubMed] [Google Scholar]
- 43.Shi H, Kokoeva MV, Inouye K, Tzameli I, Yin H, Flier JS. TLR4 links innate immunity and fatty acid-induced insulin resistance. J Clin Invest. 2006;116:3015–25. doi: 10.1172/JCI28898. [DOI] [PMC free article] [PubMed] [Google Scholar]
- 44.Chang ZL. Important aspects of Toll-like receptors, ligands and their signaling pathways. Inflamm Res. 2010;59:791–808. doi: 10.1007/s00011-010-0208-2. [DOI] [PubMed] [Google Scholar]
- 45.Erridge C. Endogenous ligands of TLR2 and TLR4: agonists or assistants? J Leukoc Biol. 2010;87:989–99. doi: 10.1189/jlb.1209775. [DOI] [PubMed] [Google Scholar]
- 46.He RL, Zhou J, Hanson CZ, Chen J, Cheng N, Ye RD. Serum amyloid A induces G-CSF expression and neutrophilia via Toll-like receptor 2. Blood. 2009;113:429–37. doi: 10.1182/blood-2008-03-139923. [DOI] [PMC free article] [PubMed] [Google Scholar]
- 47.Norseen J, Hosooka T, Hammarstedt A, Yore MM, Kant S, Aryal P, et al. Retinol-binding protein 4 inhibits insulin signaling in adipocytes by inducing proinflammatory cytokines in macrophages through a c-Jun N-terminal kinase- and toll-like receptor 4-dependent and retinol-independent mechanism. Mol Cell Biol. 2012;32:2010–9. doi: 10.1128/MCB.06193-11. [DOI] [PMC free article] [PubMed] [Google Scholar]
- 48.Serhan CN, Petasis NA. Resolvins and protectins in inflammation resolution. Chem Rev. 2011;111:5922–43. doi: 10.1021/cr100396c. [DOI] [PMC free article] [PubMed] [Google Scholar]
- 49.Calder PC. Mechanisms of action of (n-3) fatty acids. J Nutr. 2012;142:592S–9S. doi: 10.3945/jn.111.155259. [DOI] [PubMed] [Google Scholar]
- 50.Dewell A, Marvasti FF, Harris WS, Tsao P, Gardner CD. Low- and high-dose plant and marine (n-3) fatty acids do not affect plasma inflammatory markers in adults with metabolic syndrome. J Nutr. 2011;141:2166–71. doi: 10.3945/jn.111.142240. [DOI] [PMC free article] [PubMed] [Google Scholar]
- 51.Tierney AC, McMonagle J, Shaw DI, Gulseth HL, Helal O, Saris WH, et al. Effects of dietary fat modification on insulin sensitivity and on other risk factors of the metabolic syndrome--LIPGENE: a European randomized dietary intervention study. Int J Obes (Lond) 2011;35:800–9. doi: 10.1038/ijo.2010.209. [DOI] [PubMed] [Google Scholar]
- 52.Griffin MD, Sanders TA, Davies IG, Morgan LM, Millward DJ, Lewis F, et al. Effects of altering the ratio of dietary n-6 to n-3 fatty acids on insulin sensitivity, lipoprotein size, and postprandial lipemia in men and postmenopausal women aged 45–70 y: the OPTILIP Study. Am J Clin Nutr. 2006;84:1290–8. doi: 10.1093/ajcn/84.6.1290. [DOI] [PubMed] [Google Scholar]
- 53.Kabir M, Skurnik G, Naour N, Pechtner V, Meugnier E, Rome S, et al. Treatment for 2 mo with n 3 polyunsaturated fatty acids reduces adiposity and some atherogenic factors but does not improve insulin sensitivity in women with type 2 diabetes: a randomized controlled study. Am J Clin Nutr. 2007;86:1670–9. doi: 10.1093/ajcn/86.5.1670. [DOI] [PubMed] [Google Scholar]