Abstract
Purpose
To explore whether diffusion weighted imaging (DWI) can localize specific segments of primary motor areas in children with Sturge-Weber syndrome (SWS), this study investigated the cortico-spinal tract (CST) between precentral gyrus (PCG) and posterior limb of internal capsule (PIC).
Materials and Methods
DWI was performed in 32 healthy children and 7 children with unilateral SWS affecting the sensori-motor area variably. A hierarchical dendrogram was applied to find PCG-segments uniquely connected to PIC-segments. The resulting PCG-clusters were utilized to image primary motor pathways in DWI and find metabolic abnormalities of primary motor areas in PET scans.
Results
In healthy children, five PCG-clusters were found to have unique CST courses, corresponding to CST segments of mouth/lip, fingers, and leg/ankle primary motor areas determined by functional MRI. In children with SWS, reduced streamlines in these PCG clusters were highly correlated with glucose-hypometabolism on PET (R2=0.2312, p-value=0.0032). Impaired CST segment corresponding to finger movements correlated with severity of hand motor deficit.
Conclusion
The presented method can detect impaired CST segments corresponding to specific motor functions in young children, who cannot cooperate for functional MRI. This approach can be clinically useful for a non-invasive presurgical evaluation of cortical motor areas in such children.
Keywords: Diffusion weighted imaging tractography, Cortico-spinal tract, Primary motor areas, Sturge-Weber syndrome, Multimodal analysis
INTRODUCTION
Sturge-Weber syndrome (SWS) is a rare disorder associated with a facial port-wine birthmark and leptomeningeal vascular malformation (1). Children with SWS have a variety of nervous system problems, including motor deficit, visual field impairment, cognitive decline and seizures, which most often start during the first year of life and show a highly variable clinical course (2). Since cerebral abnormalities affect only one hemisphere in 85% of the cases, SWS is also a unique clinical model to study neurocognitive effects of an early, progressive, unilateral brain damage for which there is currently no specific treatment (3–5).
Neuroimaging studies have reported a variety of vascular and brain tissue abnormalities in SWS, (4–10). Previous studies have suggested that both grey matter and white matter injury may contribute to SWS-related neurocognitive deficits (4,6,9,10). Early onset white matter damage may lead to disruptions of the corticospinal tract (CST), thus leading to abnormalities that impact the development of primary motor function. Integrity of CST and related motor functions is a critical issue in SWS children who undergo presurgical evaluation (for hemispherectomy or partial resection) due to intractable seizures. Many of them show cerebral abnormalities confined to the posterior quadrant (parieto-tempor-occipital regions, a typical distribution of the SWS vascular malformation), and the degree of motor cortex and CST involvement is often difficult to determine by conventional MRI. Epilepsy surgery is often considered at a young age, in children who are unable to cooperate with functional MRI (fMRI).
Diffusion weighted imaging (DWI) tractography allows reconstruction of white matter pathways connecting cortical/subcortical regions in-vivo (11–14). This is carried out by line propagation or streamline techniques connecting the principal eigenvector of voxel-wise diffusion tensors based on a Gaussian tensor model for directional property of local water diffusion in axonal bundles (11–13). This single Gaussian tensor model is clinically attractive, because it does not require a complex diffusion model exceeding 100 diffusion acquisitions and high b-values like in Q-space imaging (15–17) and diffusion spectrum imaging (18). However, DWI tractography using single Gaussian model is known to be inaccurate in voxels where fiber bundles intersect (18–21). Due to the orientation heterogeneity in such voxels, the primary eigenvector likely points to an erroneous direction, biased toward the highest density fibers. For instance, the voxels between the precentral gyrus (PCG) and posterior limb of internal capsule (PIC) contain two fiber bundles (lateral projection of CST curving to motor cortex and superior longitudinal fasciculus (SLF) tracing antero-posteriorly through the corona radiata). Here, DWI tractography fails to estimate the correct orientations of lateral CST streamlines (22,23). To overcome this problem, a previous study recently developed a new tractography method combining an independent component analysis (ICA) with Ball-Stick Model (BSM), called “ICA+BSM”, that can successfully isolate individual tensors of CST and SLF streamlines (24). This ICA+BSM method achieved high correspondence to anatomical pathology (up to 92.2% voxel overlap for the entire CST).
The present study investigated the applicability of ICA+BSM tractography to localize primary motor areas connected to lateral-to-medial CST pathways without additional acquisition such as fMRI. We hypothesized that the tractography driven CST pathways, related to specific motor functions (or areas), connect unique segments of PCG and PIC according to the traditional homunculus representation resulting in multiple clusters of PCG and PIC corresponding to individual CST pathways associated with unique motor functions (25–27).
To investigate an objective methodology that provides functionally specific segments of the primary motor area only by using the tractography information, in the present study first we have analyzed normally developing children where fMRI activation maps of mouth/lip, fingers, and leg/ankle areas were available as gold standards to eastimate the accuracy of the proposed methodology. Subsequently, we demonstrated the clinical feasibility and relevance of this approach by performing a multi-modal correlation between 2-deoxy-2[18F] fluoro-D-glucose [FDG] PET abnormalities of the sensorimotor regions and DWI tractography of CST localization in children with unilateral SWS, where cortical damage and white matter disruption around the sensorimotor area often lead to motor deficits (28,29).
MATERIALS AND METHODS
Study Subjects
Thirty-two normally developing right-handed children (ND, 20 training samples: 9.8±3.5 years/13 boys and test samples: 10.1±3.2 years/8 boys) and seven children with unilateral SWS and seizures (SWS, 3.0±2.8 years/6 boys) were investigated by DWI. Manual dexterity was tested by neurological examination and the Purdue Pegboard task (children 30 months – 5 years of age) or the Grooved Pegboard task (children older than 5 years of age). All studies were performed in accordance with policies of the Institution Review Board with written informed consent.
Data Acquisition
For normally developing chilren, MRI scans were performed on a 3T GE-Signa scanner (GE Healthcare, Milwaukee, WI) equipped with an 8-channel head coil and ASSET. DWI was acquired with a multi-slice single shot diffusion weighted echo-planar-imaging (EPI) sequence at repetition time (TR) = 12,500ms, echo time (TE) = 88.7ms, field of view (FOV) = 24cm, 128×128 acquisition matrix (nominal resolution = 1.89mm), contiguous 3mm thickness in order to cover entire axial slices of whole brain using 55 isotropic gradient directions with b= 1000s/mm2, one b=0 acquisition, and number of excitations (NEX)=1. Approximate scanning time for the this acquisition was about 12 minutes using double refocusing pulse sequence to reduce eddy current artifacts. Also, whole brain fMRI images were acquired using T2*-weighted EPI sequence at TR=2000ms, TE=30ms, matrix size=64×64, FOV=24cm, and thickness=4mm. Event-related fMRI paradigm was applied to map primary motor areas where a visual/auditory instruction was given to the subject every five seconds in order to trigger onetime movement of a body part (lip/mouth muscle, fingers, or ankle/leg) of each side (left or right) approximately lasting a second. We repeated a total of ten sequential movements of lip/mouth, fingers, and ankle/leg at each side, thus completing a 5-minute session to localize primary motor areas of lip/mouth, fingers, and ankel/leg in both hemispheres.
For children with SWS, a Siemens MAGNETOM Trio 3T scanner (Siemens Medical Solutions, Erlangen) with a standard head array coil was used to acquire diffusion weighted images at TR = 6600 ms, TE = 97 ms, FOV = 256 mm, matrix size = 128×128, slice thickness = 2 mm, and zero gap covering the whole brain using 64 isotropic gradient directions with b= 1000s/mm2, one b=0 acquisition, and NEX=2. Also, interictal FDG-PET scans were acquired using an EXACT/HR PET scanner (CTI/Siemens, Hoffman Estates, Ill), which provides simultaneous acquisition of 47 contiguous trans-axial images with slice thickness of 3.125mm (28). 5.29 MBq/kg of FDG was injected intravenously followed by a 30-minute uptake period. Forty minutes post-injection, a static 20-minute emission scan was acquired parallel to the canthomeatal plane. Sedation was performed with pentobarbital (3 mg/kg) followed by fentanyl (1μg/kg), applied only during the scanning (but not tracer uptake) period at PET scanning.
ICA+BSM whole brain tractography
To identify crossing fiber components in voxels of small cluster, the present study utilized “ICA+BSM” tractography (24) where dimensionality reduction and BSM fitting are sequentially applied to image multiple diffusion components independently attenuated in each direction of diffusion sensitizing gradients. At each voxel of the white matter, an eleven-neighborhood window was applied to define a diffusion data matrix whose row vectors indicate diffusion weighted signals at every voxel of the window. Total Kopt tensors (1≤ Kopt ≤ 3) were then estimated in framework of Bayesian Information Criterion (29) by iterating two complementary steps, hidden source decomposition using fast ICA (30) and multi-compartment ball-stick model (31). Finally, the first eigenvectors of the resulting Kopt-tensors were utilized for the streamline tractography (13,14) to accommodate multiple orientations in voxels. At the center of each voxel, tracking was started in the orientation of one fiber randomly selected among Kopt-streamlines. Step size and turning angle threshold were set to 0.2 voxel width and 60°, respectively. Propagation direction was calculated by applying trilinear interpolation on the fiber orientations provided from 26 nearby voxels of current point. For each nearby voxel, only the fiber orientation that had the smallest turning angle was considered for interpolation. In order to smoothen tracts, each subsequent direction was determined by equal weighting of the previous moving direction and incoming direction. The ICA+BSM is computationally intensive, generally taking up to 2 hours to isolate multiple streamlines from one set of data on an Intel Core i5 CPU dual 2.67 GHz workstation for ~120.000–140.000 voxels acquired in a human brain study.
To ensure the reliability to isolate crossing streamlines, the ICA+BSM tractography was compared with different tractography methods: the original ICA method (21), spherical deconvolution method (MRtrix package available at www.nitrc.org) (32), and in-house implementation of the conventional single Gaussian tensor method (11,13).
Segmentwise-clustering to identify unique connectivity pattern of CST
As an objective methodology that estimate a functional localization of primary motor area only using the connectivity information of ICA+BSM tractography, a segmentwise-clustering approach was applied to sort lateral and medial projections of the CST in twenty normal subjects (training samples). The binary MNI space atlases of both PCG and PIC (WFU PickAtlas, www.fmri.wfubmc.edu/software) were divided into 10 equi-length segments, PCG(i) and PIC(j) for i = 1,2,…10 and j=1,2,..,10 (Fig. 1, the center lines of PCG and PIC were approximated by the shortest path connecting two end-points. The center line was broken into 10 equidistant points to assign neighboring voxels into one of 10 segments in framework of nearest neighborhood). Subsequently, we placed PCG(i) and PIC(j) into native space by applying the inverse of spatial deformation obtained between the subject’s b0 image and MNI b0 template (33). For each PCG(i), we measured the number of streamlines [n(i,j)] connected to each of 10 PIC(j), j=1,2,…,10, which approximates the probabilistic fiber distribution between PIC(i): seed region and PCG(i): target region. According to the traditional homunculus representation (25–27), we presumed lateral CST projections to be characterized by unique patterns or pathways of n(i,j) that are different from those of medial CST projections (25–27, i.e., lateral CST projections are connected to the anterior PIC while medial CST projections are connected to the posterior PIC).
Figure 1.
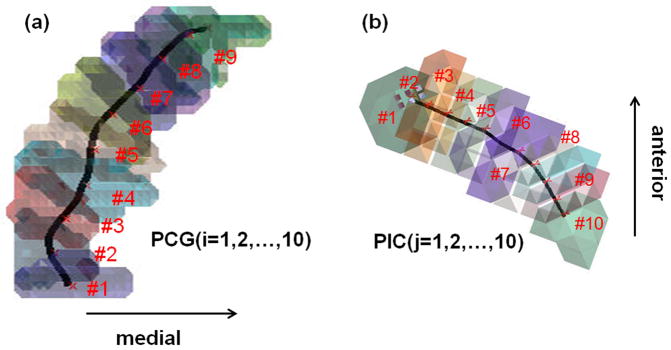
Ten equi-length segments utilized for segmentwise connectivity analysis. (a) segments of precentral gyrus, PCG(i), i=1,2,…,10. (b) segments of posterior limb of internal capsule, PIG(j), j=1,2,…,10.
To cluster the segments of PCG(i) showing similar patterns of n(i,j), the present study utilized conventional dendrogram analysis based on the agglomerative hierarchical cluster tree (34). In each segment of PCG(i=1,2,…,10), an average profile vector, pi, was obtained by averaging n(i,j=1,2,…,10) in 20 training samples. Euclidean distance between the elements of neighboring pi was used to determine their merge into the same cluster in the hierarchical dedrogram. This analysis included a series of iterative merge operations, eventually forcing 10 n(i,j=1,2,…,10) into multiple clusters, ck that minimize total cluster-wise Euclidean distance existing in n(i=1,2,…,10, j=1,2,…,10). The present study assumes that the resulting cluster, ck, corresponds to individual CST pathways, involved in unique motor functions. Thus, the PCG segments belonging to cortical terminals of individual fiber cluster, ck, are considered to indicate unique motor areas.
Localization of primary motor areas using fMRI
fMRI analyses were carried out using Statistical Parametric Mapping (SPM 8, available from www.fil.ion.ucl.ac.uk/spm/software/spm8). Each EPI scan was corrected for within-scan acquisition time differences between slices, realigned to the first EPI volume to correct for inter-scan movements, and spatially normalized to MNI space. For each scan, the general linear model with hemodynamic response function was used to identify the voxels corresponding to the activations of lip/mouth, fingers, and ankle/leg movement. One sample t-test was utilized to obtain group average activations at family wise error (FWE) p-value < 0.05 adjusted for small volume correction and extent threshold > 10. The resulting activations in “mouth/lip”, “fingers”, and “leg/ankle” areas were subsequently used as gold standards for DWI segmentwise clusters.
Comparison of DWI segmentwise clusters with fMRI
To assess how accurately DWI segmentwise clusters (ck) localize primary motor areas determined by fMRI, a percentage overlap approach was utilized (35). For each of twelve normal subjects (test sample that was not included in a twenty-subject training sample), the CST pathway of individual cluster ck was sorted from ICA+BSM whole brain tractography by applying a two-ROI approach, with one seed ROI placed in the PCG segments of ck and another ROI to select for the streamlines in the PIC segments of ck. A fiber visitation map of ck was then created by counting the number of streamlines intersected per voxel of the PCG (36). Finally, the resulting map was normalized to MNI space using the spatial deformation derived from the process of normalization of the b0 image, averaged across all subjects, and scaled by a value of maximum visitation in the map, which defined a percentage overlap map. The percentage overlap map of each ck was compared with primary motor areas determined by fMRI. Receiver operating characteristic (ROC) curve analysis was utilized to evaluate the accuracy of DWI segmentwise clusters against the gold-standard fMRI.
| [1] |
where Vol represents the volume of a set; H and P denote binary masks that are obtained by thresholding the p-value map of fMRI and the percentage overlap map of DWI segmentwise cluster, respectively; c indicates the complementary set. TP, TN, FP, and FN indicate the ratio of true positive, true negative, false positive, and false negative, respectively.
FDG-PET data analysis for patients with SWS
To investigate whether DWI segmentwise clusters (ck) can detect abnormalities of CST pathway segments originating from metabolically impaired cortical regions in children with SWS, we correlated the CST fiber number of individual ck with glucose metabolism asymmetries measured by FDG-PET. To evaluate average glucose uptakes in PCG segments of ck, we mapped the voxels of PCG segments of the clusters, ck, into FDG image by applying a diffeomorphic transformation between the b0 image and FDG image (33). Lateralization index (LI) of total fiber number and glucose uptake was calculated per ck, using the ratio of (left−right) and (left+right). Finally, we correlated these two values of LI in order to investigate the multimodal correspondence for hemispheric lateralization of primary motor abnormalities in patients with SWS.
RESULTS
Segment-wise clusters of CST projections
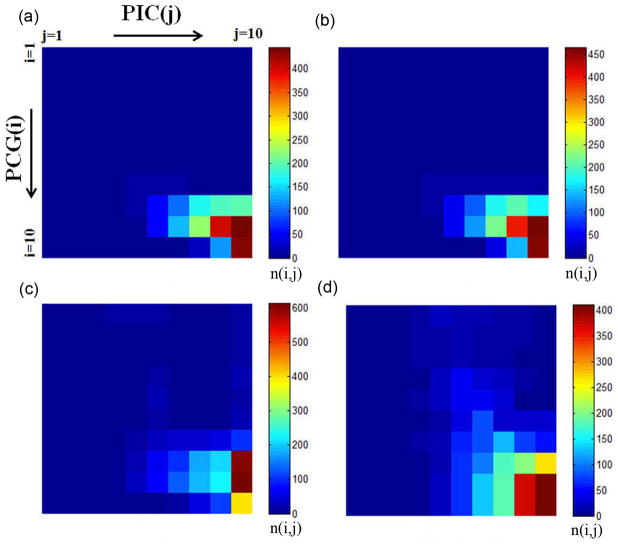
The connectivity between PCG(i) and PIC(j), n(i,j) in twenty normal subjects (training sample) was evaluated using four different tractography methods including ICA+BSM, ICA, spherical deconvolution, and single Gaussian tensor model. The resulting group average of n(i, j), pi, are shown in individual panels of Fig. 2. Compared to other tractography methods, the ICA+BSM tractography provided much higher n(i,j) for i=1,2,…,5 and j=5,6,7, which connect the inferior part of PCG and anterior part of PIC. Also, the ICA+BSM tractography could reconstruct medial projections connecting the superior part of PCG (i=6,7,8,9,10) and posterior part of PIC (j=8,9,10). Note the shift of peak in n(i,j) for i=1,2,…,10, suggesting that lateral CST pathways are more likely to be connected to anterior PIC while medial pathways are more likely to be connected to posterior PIC.
Figure 2.
Segmentwise clusters of PCG and PIC to identify primary motor areas in 20 normal subjects (training samples). Group average of connectivity n(i,j), the number of streamlines connecting PCG (i=1,2, …,10) to PIC(j=1,2,…,10), obtained from (a) single Gaussian tensor model, (b) spherical deconvolution, (c) ICA, and (d) ICA+BSM.
A hierarchical dendrogram to cluster 10 segments of PCG(i) based on the group average distance (height) of n(i,j) revealed a total of five clusters, ck=1,2,…,5 at the height threshold of 1.5 (Fig. 3), resulting in five CST pathways connecting specific segments of PCG(i) and PIC(j) as listed in Table 1. For each pathway, the indices of PIC segments were selected at two peak indices, (j) of n(i,j=1,2,…,10).
Figure 3.
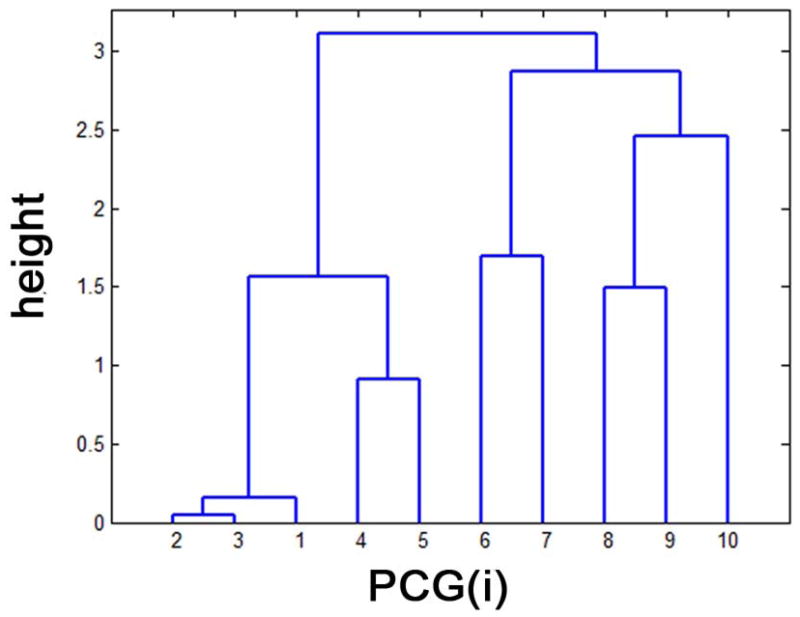
Hierarchical dendrogram analysis to cluster PCG segments based on the similarity of their group average profiles of n(i,j), pi. “height” indicates the scaled Euclidean distance between a given pair of pi, i =1,2,…,10 at the hierarchical level. At the height threshold of 1.5, two clusters exist; c1 merging n(i=1,2,3, j=1,2,…,10) and c2 merging n(i=4,5, j=1,2,…,10). Also, we have other three clusters, c3 merging n(i=6,7, j=1,2,…,10), c4 merging n(i=8,9, j=1,2,…,10), and c5 merging n(i=10, j=1,2,…,10).
Table 1.
List of five CST pathways connecting specific segments of PCG(i) and PIC(j).
| pathway | index (i) of PCG segment | index (j) of PIC segment |
|---|---|---|
| c1 | 1,2,3 | 5,6 |
| c2 | 4,5 | 6,7 |
| c3 | 6,7 | 7,8 |
| c4 | 8,9 | 8,9 |
| c5 | 10 | 10 |
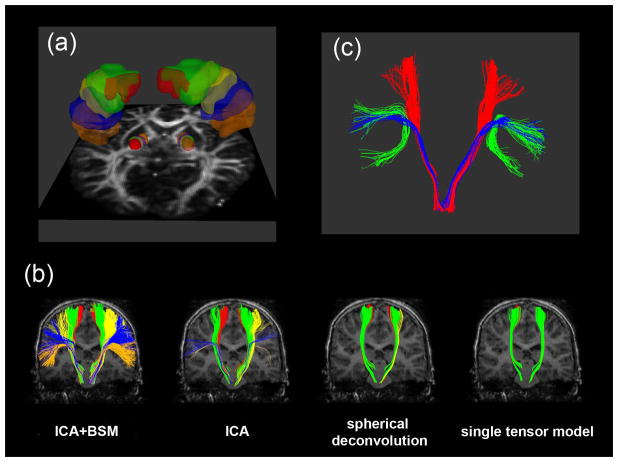
Spatial mapping of the five MNI PCG-PIC clusters, ck=1,2,…,5 into individual subjects’ head space provided an objective way to image multiple CST pathways involved in distinct motor functions. Figure 4 presents an example of five clusters, ck=1,2,…,5 in subject’s native space. The PCG(i) and PIC(j) segments of five MNI ck=1,2,…,5 were transformed into the subject’s space via direct voxel-to-voxel mapping between the subject and MNI head spaces (Fig. 4(a)). These PCG(i) and PIC(j) were then applied to four whole brain tractography methods in order to sort out the CST pathways of ck=1,2,…,5 (Fig. 4(b)). It is clear that ICA+BSM tractography visualized the most prominent pathways compared to other methods. More importantly, DWI segmentwise clusters were able to isolate two separate tracts, a lateral CST projection and arcuate fasciculus from Broca’s area, which is associated with language function (Fig. 4(c)).
Figure 4.
Representative example of PCG and PIC segments belong five clusters ck=1,2,…,5 to sort out lateral-to-medial CST pathways. (a) five clusters, ck=1,2,…,5 in PCG and PIC, c1 colored orange, c2 colored blue, c3 colored yellow, c4 colored green, and c5 colored red. (b) CST pathway belong to each ck that was obtained from ICA+BSM, ICA, spherical deconvolution, and single Gaussian tensor model. Orange, blue, yellow, green, and red colors were used to denote the CST pathways connecting PCG and PIC of c1, c2, c3, c4, and c5, respectively. (c) comparison of arcuate fasciculus (green) to CST pathway of c1 (lateral projection, blue) and c5 (medial projection, red).
Accuracy of segmentwise clusters to localize primary motor areas determined by fMRI
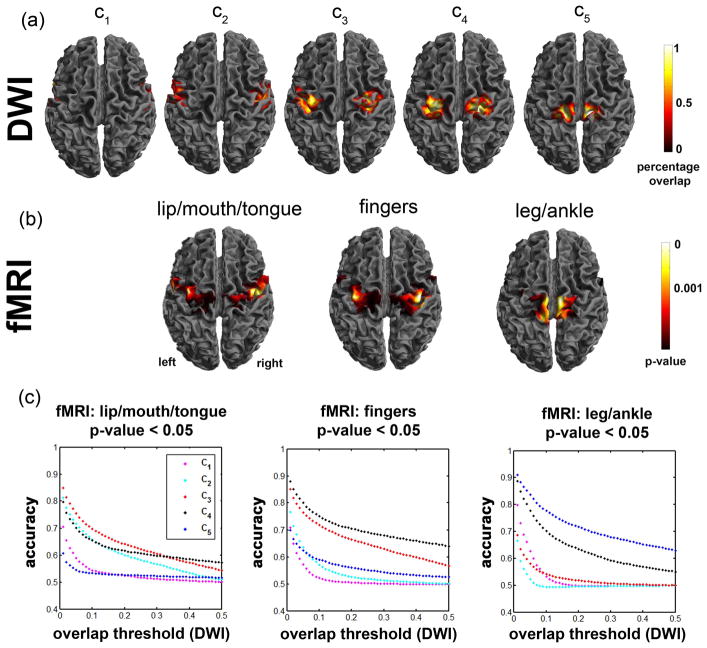
From the twelve-subject test sample, the percentage overlap maps of ck=1,2,…,5 were obtained in MNI space (top panel of Fig. 5) and then compared with group fMRI activation maps of “mouth/lip”, “finger”, and “leg” in MNI space (middle panel of Fig. 5). The plots on the bottom panel of Fig. 5 show the accuracy measure of individual ck to detect fMRI activations responding to “mouth/lip”, “finger”, and “leg/ankle” movements at p-value= 0.05. The ROC curve analysis suggested that the DWI segmentwise clusters achieve the highest accuracies of 0.84 (DWI c3 vs. fMRI mouth/lip), 0.88 (DWI c4 vs. fMRI fingers), and 0.91 (DWI c5 vs. fMRI leg) at the overlap threshold of 0.05, implying that c3, c4, and c5 are most likely involved in lip/mouth, fingers, and legs, respectively..
Figure 5.
Comparison of DWI segmentwise clustering localization and fMRI group analysis obtained from 12 normal subjects (test samples). (a) percentage overlap maps of five pathways, ck=1,2,..,5. (b) lip/mouth/tongue, fingers, and leg/ankle areas determined by fMRI. (c). accuracy measures between DWI and fMRI. In order to assess the accuracy of individual DWI segmentwise clusters compared with fMRI maps of “mouth/lip”, “fingers”, and “leg/ankle” at p-value <0.05, receiver operating characteristic curves were plotted at varying overlap thresholds.
Abnormalities in motor cortex and CST assessed by FDG-PET and DWI segmentwise clusters in children with SWS
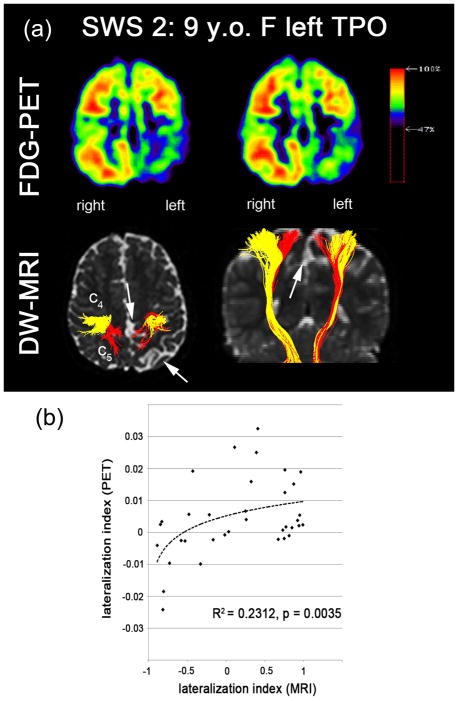
Of the seven children with SWS, 5 showed some degree of hand motor deficit, but none of them had severe paresis. One child (patient 7) had moderate gross motor deficit (paresis), and 4 had a variable degrees of fine motor deficit (as evaluated by the Vineland Adaptive Behavior Scales and/or Purdue Pegboard). Overall, more severe motor deficit correlated with a higher absolute LI (more lateralized abnormality) in c4 (finger cluster, Kendall’s tau=1.00, p-value<0.001, Fig. 6) and also with the average c values (Kendall’s tau = 0.72, p-value=0.029). Table 2 summarizes the LI values of five PCG segments, ck=1,2,…,5 obtained from seven children with SWS and corresponding motor deficits. Compared with healthy children, the children with SWS showed highly lateralized CST, pointing to impairment in at least one CST segment in the affected hemisphere in all 7 of them. Average values of the 5 segments were within the normal range in 3 of the 7, including both children (#1 and #6) with no hand motor deficit, who had the lowest LI values. The only child (#1) with normal LI in both segments belonging to finger movements had no fine motor impairment. The other child with no fine motor deficit (#6) showed LI in the normal change in c4 but abnormal LI in c3; interestingly, this child showed impaired manual dexterity when tested 1 year earlier (at age 3.4 years), but not at the time of the MRI (at age 4.4). Reduced fiber density was apparent in the specific segments of CST pathways corresponding to cortical regions showing significantly reduced glucose uptake (Fig. 7(a)). In the SWS group, a significant cross-modal (DW-MRI/FDG-PET) correlation was observed in the LI values of five clusters, ck=1,2,..,5 (Fig. 7(b), R2 = 0.23, p-value=0.0032 where Pearson’s correlation analysis was performed on the pooled LI values of all five clusters instead of individual cluster in order to improve statistical power due to small sample size, n=7).
Figure 6.
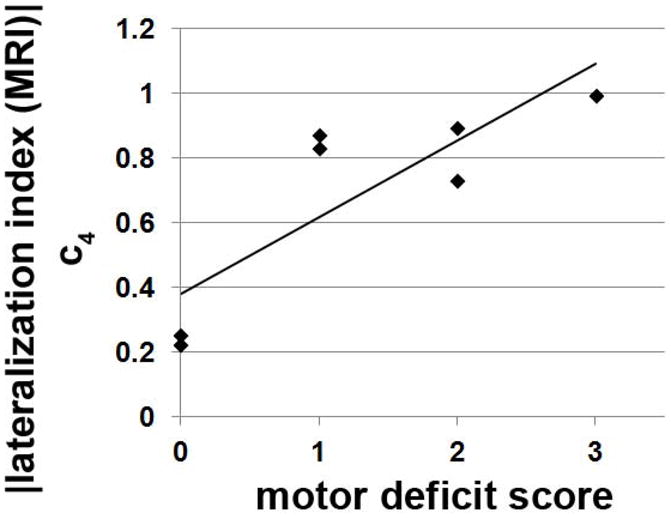
Correlation between clinical measure of motor deficit and DWI measure of CST lateralization. Absolute value of the LI in c4 showed significant correlation with clinical measure of motor deficit in 7 patents with SWS (Kendall’s tau=1.00, p-value<0.001).
Table 2.
Lateralization index (LI) of individual CST pathways in DWI tractography and corresponding motor deficits in the 7 SWS children.
| subject | age, gender, SWS lobar involvement | motor deficit | c1 | c2 | c3 | c4 | c5 | average | |
|---|---|---|---|---|---|---|---|---|---|
| location | severity | ||||||||
| ND | 4.3–17.8 y.o | −0.05 | 0.25 | 0.12 | 0.03 | 0.08 | 0.11 | ||
| mean(STD) | 21 M, 11 F | (0.24) | (0.24) | (0.25) | (0.15) | (0.13) | (0.14) | ||
| normal | (−) mean −2STD | −0.53 | −0.23 | −0.38 | −0.27 | −0.18 | −0.17 | ||
| range | (+) mena +2STD | +0.43 | +0.73 | +0.62 | +0.33 | +0.34 | +0.39 | ||
| SWS 1 | 2.0 y.o. F left TPO | none | normal (0) | 0.41 | 0.76 | 0.39 | −0.22 | −0.53 | 0.16 |
| SWS 2 | 9.0 y.o. F left TPO | right> left hand | moderate (2) | −0.82 | −0.81 | −0.33 | −0.89 | −0.73 | −0.72 |
| SWS 3 | 1.5 y.o F left TPO, FR | right hand | mild (1) | −0.58 | 0.26 | −0.02 | −0.83 | −0.85 | −0.40 |
| SWS 4 | 1.6 y.o. F right TPO, FR | left hand | mild (1) | 0.76 | 0.32 | 0.96 | 0.87 | 0.11 | 0.60 |
| SWS 5 | 3.0 y.o. F right TPO | left hand | moderate (2) | 0.67 | 0.03 | 0.75 | 0.73 | −0.43 | 0.35 |
| SWS 6 | 4.4 y.o. M right P | none | normal (0) | −0.17 | 0.77 | 0.85 | 0.25 | −0.48 | 0.24 |
| SWS 7 | 1.1 y.o. F right TPOFR | left hand | gross (3) | 0.81 | 0.94 | 0.92 | 0.99 | 0.95 | 0.93 |
mean and standard deviation (STD) were reported in the normally developing children (ND, n=32). Normal range was defined by mean ±2 STD of the values measured in ND group. Values indicating abnormally lateralized CST fiber counts in the affected hemisphere of individual SWS patient are bolded. The age, gender, and location of each legion were reported in the second column where F, M, FR, T, P, and O stand for female, male, frontal, temporal, parietal, and occipital lobe, respectively. Motor deficit scores 0–3 refer to severity of fine motor deficit (without gross motor abnormality), score 3 indicates (moderate) gross motor deficit.
Figure 7.
Correlation between FDG-PET and DW-MRI. (a) spatial correlation of FDG hypometabolism and reduced fiber density assessed in SWS 2: 9 years old female having abnormal lesions in left temporal, parietal, and occipital lobe. Significantly reduced glucose uptake and CST projection were found near c4 and c5 in left hemisphere, marked by white arrows pointing out atrophic cortex and white matter infarct. (b) PET-MRI correlation analysis in seven patients with unilateral SWS. LI values of PET and MRI were evaluated from five clusters, ck=1,2,..,5 of the CST pathways. Significant Pearson’s correlation coefficient (R) was found (R2 = 0.2312, p-value=0.0032). Dashed line indicates a log-fit.
DISCUSSION
Two major findings emerge from the present study. First, segmentwise connectivity analysis can separate and localize multiple CST pathways whose cortical terminals correspond well with three primary cortical motor areas, “mouth/lip”, “fingers”, and “leg/ankle”, as determined by fMRI. This may have important clinical implications for presurgical planning in infants or young children who are unable to follow fMRI motor tasks. Secondly, segmentwise connectivity analysis may have a promise to detect impaired motor pathways in children with early CST damage such as seen in SWS. Our preliminary data also suggest that a more severe CST deficit in the finger segment may be an imaging marker of a more pronounced motor deficit as defined by motor testing of the hand. Therefore, early segmental abnormalities of CST pathways might be useful to predict subsequent specific motor deficits and prompt targeted interventions (such as occupational therapy) at an early disease stage, thus optimizing motor outcome. A previous study reported that single tensor based DWI of young children with unilateral SWS showed significant reduction in the integrity of CST streamlines (i.e., reduced fractional anisotropy and increased apparent diffusion coefficient) even before severe motor impairment develops (37). This finding has been extended by the present study demonstrating apparently reduced streamline numbers in the affected hemispheres of two young children with no apparent gross or fine motor deficit (SWS patient #1 and #6), suggesting mild subclinical impairment of CST integrity. In one of them, segments corresponding to finger movements were not affected, but other segments (corresponding to mouth/lip and leg/ankle movements) showed moderate impairment. The functional correlate of these segment-specific deficits could not be determined. In the other child with no current motor impairment, impaired manual dexterity had been documented one year earlier, suggesting mild impairment of the finger segments which were compensated by the time of DWI. Whether this method is able to predict subsequent motor deficits in young children will need to be determined in longitudinal studies.
Voxelwise-identification of multi-tensor components has been problematic in clinical applications of DWI tractography because the conventional single tensor model fails to describe the complexity of water diffusion in voxels with multiple streamlines (22,23,38). By decomposing diffusion measurement into parametric multi-Gaussian tensor fields using the ICA+BSM, the present study successfully imaged the entire CST pathway that originates from the lip-finger-leg areas. It was also demonstrated that the CST pathways can be objectively segmented using the similarity of their courses in three dimensional space. It was revealed that lateral CST pathways are more likely to be connected to anterior PIC while medial pathways are more likely to be connected to posterior PIC, which is consistent with known neuroanatomical connections between PCG and PIC (25–27). Based on these distinctive pathways of lateral-medial projections, the present study suggests a possibility that distinct motor areas in PCG might be identified by their CST projections in children with SWS, without additional acquisition of other functional data such as fMRI.
The visualization of entire CST projections to primary motor areas is clinically important to plan neurosurgery where correct depiction of motor pathways is critical to avoid a postoperative motor deficit. In particular, non-invasive identification of the motor cortex and underlying motor tracts is important in children whose lesion or epileptogenic cortex involves the proximity of the sensori-motor regions, such as the case in most patients with SWS. Direct cortical stimulation via chronically implanted subdural electrodes (39,40) is a useful but invasive way of identifying motor cortex and, in SWS particularly, subdural grid placement is usually avoided due to the risk of hemorrhage. Although the present study does not discriminate unilateral/bilateral innervations and also does not take brain plasticity into account by introducing the standard atlas segments to younger patients, the findings suggest that DWI segmentwise clusters might be used to approximate not only the location of motor cortex but also identify the related CST pathway, which cannot be obtained from electrode stimulation mapping (41).
Previous DWI tractography studies (20,42) have attempted to isolate multiple fiber components in CST projections from clinically feasible DWI acquisition scheme with 55–60 diffusion directions and a b-value of 1000 s/mm2. These studies employed diffusion tractography to tract multiple streamlines in multi-orientation field (up to 3 streamlines) or a two-tensor fitting model. Compared to these studies, the present study uniquely utilized a new scheme (called “fast ICA”) to improve the accuracy and also expedite parametric optimization in multi-Gaussian tensor fields. However, a limitation of the present study is that the accuracies of all five clusters have not been thoroughly investigated. Only three clusters including “mouth/lip”, “fingers”, and “leg/ankle” were compared with corresponding fMRI activations. With larger samples of fMRI data showing cortical activations involved in the movements of other body parts including tongue and eyes, the accuracies of other two clusters will be investigated to address the question if these clusters can be used as an independent tool to localize primary motor areas without the assistance of other non-invasive imaging modalities. Another limitation is that the comparison was made with the CST lateralization index that was acquired from different age-groups using different scanners. This study presumed minimal variation across ages and scanners since the proposed approach is based on a lateralization index, not absolute values of fiber counts that may not be specific for one scanner and may be less affected by age variations. In addition, the present study applied the standard atlas to derive the segments of PCG in patients who may develop potential motor areas outside the normal position. The presented multimodal comparison supports that these segments appear to be insensitive to cortical pathology near PCG, Nevertheless, future studies should examine this effect more carefully with other potential confounds from age, gender, and scanner.
In conclusion, the present study demonstrates that DWI segmentwise clusters can approximate distinctive CST pathways most likely originating from distinct portions of the motor cortex, belonging to mouth-, finger-, and leg-movements, which are clinically important to plan resective neurosurgery for SWS and other lesions affecting the sensorimotor region. Preliminary results in patients with SWS support that assessment of DWI segmentwise clusters may be effective to assess function-specific impairment of CST, which can detect subclinical abnormalities and, thus, could be a predictor of subsequent motor deficits.
Acknowledgments
Grant Support: NIH (R01 NS041922 to C.J.) and NIH (R01 NS064989 to H.C).
We thank Cathie Germain for assisting patient recruitment and scheduling, Majid Janabi MD, Jane Cornett RN and Anne Deboard RN for performing sedation, Xuan Yang BS for assisting MRI data acquisition, as well as Angela Wigeluk, Galina Rabkin, Melissa Burkett, Carole Klapko and Andrew Mosqueda for performing the PET studies. We are also grateful to Michael Behen PhD, Amy Veenstra MA, and William Guy MA, for performing neuro-psychology testing.
References
- 1.Bodensteriner JB, Roach ES. Sturge-Weber syndrome. The Sturge-Weber Foundation; New York: Mt. Freedom: 2010. pp. 19–32. [Google Scholar]
- 2.Riela AR, Roach ES. Sturge-Weber syndrome. In: Roach ES, Miller VS, editors. Neurocutaneous disorder. New York: Cambridge University Press; 2004. pp. 179–195. [Google Scholar]
- 3.Maton B, Kresek P, Jayakar P, et al. Medically intractable epilepsy in Sturge-Weber syndrome is associated with cortical malformation: implications for surgical therapy. Epilepsia. 2010;51:257–267. doi: 10.1111/j.1528-1167.2009.02304.x. [DOI] [PubMed] [Google Scholar]
- 4.Pfund Z, Kagawa K, Juhasz C, et al. Quantitative analysis of gray-and white-matter volumes and glucose metabolism in Sturge-Weber syndrome. J Child Neurol. 2003;18:119–126. doi: 10.1177/08830738030180021501. [DOI] [PubMed] [Google Scholar]
- 5.Juhasz C, Chugani HT. An almost missed leptomeningeal angioma in Sturge-Weber syndrome. Neurology. 2007;68:243. doi: 10.1212/01.wnl.0000242581.43024.0a. [DOI] [PubMed] [Google Scholar]
- 6.Juhasz C, Lai C, Behen ME, et al. White matter volume as a major predictor of cognitive function in Sturge-Weber syndrome. Arch Neurol. 2007;64:1169–1174. doi: 10.1001/archneur.64.8.1169. [DOI] [PubMed] [Google Scholar]
- 7.Batista CE, Chuagni HT, Hu J, et al. Magnetic resonance spectroscopic imaging detects abnormalities in normal appearing frontal lobe of patients with Sturge-Weber syndrome. J Neuroimaging. 2008;18:306–313. doi: 10.1111/j.1552-6569.2007.00207.x. [DOI] [PMC free article] [PubMed] [Google Scholar]
- 8.Hu J, Yu Y, Juhasz C, et al. MR susceptibility weighted imaging (SWI) complements conventional contrast enhanced T1 weighted MRI in characterizing brain abnormalities of Sturge-Weber Syndrome. J Magn Reson Imaging. 2008;28:300–307. doi: 10.1002/jmri.21435. [DOI] [PMC free article] [PubMed] [Google Scholar]
- 9.Alkonyi B, Chugani HT, Behen M, et al. The role of the thalamus in neuro-cognitive dysfunction in early unilateral hemispheric injury: a multimodality imaging study of children with Sturge-Weber syndrome. Eur J Paediatr Neurol. 2010;14:425–433. doi: 10.1016/j.ejpn.2010.03.012. [DOI] [PMC free article] [PubMed] [Google Scholar]
- 10.Alkonyi B, Govindan RM, Chugani HT, et al. Focal white matter abnormalities related to neurocognitive dysfunction: an objective diffusion tensor imaging study of children with Sturge-Weber syndrome. Pediatr Res. 2011;89:74–79. doi: 10.1203/PDR.0b013e3181fcb285. [DOI] [PMC free article] [PubMed] [Google Scholar]
- 11.Basser PJ. Inferring microstructural features and the physiological state of tissues from diffusion-weighted images. NMR Biomed. 1995;8:333–344. doi: 10.1002/nbm.1940080707. [DOI] [PubMed] [Google Scholar]
- 12.Conturo TE, Lori NF, Cull TS, et al. Tracking neuronal fiber pathways in the living human brain. Proc Natl Aca Sci. 1999;96:10422–10427. doi: 10.1073/pnas.96.18.10422. [DOI] [PMC free article] [PubMed] [Google Scholar]
- 13.Mori S, Kaufmann WE, Pearlson GD, et al. In vivo visualization of human neural pathways by magnetic resonance imaging. Ann Neurol. 2000;47:412–414. [PubMed] [Google Scholar]
- 14.Basser PJ, Pajevic S, Pierpaoli C, et al. In vivo fiber tractography using DT-MRI data. Magn Reson Med. 2000;44:625–32. doi: 10.1002/1522-2594(200010)44:4<625::aid-mrm17>3.0.co;2-o. [DOI] [PubMed] [Google Scholar]
- 15.Tuch DS. Q-ball imaging. Magn Reson Med. 2004;52:1358–1371. doi: 10.1002/mrm.20279. [DOI] [PubMed] [Google Scholar]
- 16.Descoteaux M, Angelino E, Fitzgibbons S, Deriche R. Regularized, fast, and robust analytical Q-ball imaging. Magn Reson Med. 2007;58:497–510. doi: 10.1002/mrm.21277. [DOI] [PubMed] [Google Scholar]
- 17.Hess CP, Mukherjee P, Han ET, Xu D, Vigneron DB. Q-ball reconstruction of multimodal fiber orientations using the spherical harmonic basis. Magn Reson Med. 2006;56:104–117. doi: 10.1002/mrm.20931. [DOI] [PubMed] [Google Scholar]
- 18.Wedeen VJ, Wang RP, Schmahmann JD, et al. Diffusion spectrum magnetic resonance imaging (DSI) tractography of crossing fibers. Neuroimage. 2008;41:1267–1277. doi: 10.1016/j.neuroimage.2008.03.036. [DOI] [PubMed] [Google Scholar]
- 19.Alexander AL, Hasan KM, Lazar M, Tsuruda JS, Parker DL. Analysis of partial volume effects in diffusion-tensor MRI. Magn Reson Med. 2001;45:770–780. doi: 10.1002/mrm.1105. [DOI] [PubMed] [Google Scholar]
- 20.Qazi AA, Radmanesh A, O’Donnell L, et al. Resolving crossings in the corticospinal tract by two-tensor streamline tractography:method and clinical assessment using fMRI. Neuroimage. 2009;47:T98–106. doi: 10.1016/j.neuroimage.2008.06.034. [DOI] [PMC free article] [PubMed] [Google Scholar]
- 21.Singh M, Wong CW. Independent component analysis-based multifiber streamline tractography of the human brain. Magn Reson Med. 2010;64:1676–1684. doi: 10.1002/mrm.22509. [DOI] [PMC free article] [PubMed] [Google Scholar]
- 22.Kinoshita M, Yamada K, Hashimoto N, et al. Fiber tracking does not accurately estimate size of fiber bundle in pathological condition: initial neurosurgical experience using neuronaviagation and subcortical white matter stimulation. Neuroimage. 2005;25:424–429. doi: 10.1016/j.neuroimage.2004.07.076. [DOI] [PubMed] [Google Scholar]
- 23.Mikuni N, Okada T, Nishida N, et al. Comparison between motor evoked potential recording and fiber tracking for estimating pyramidal tracts near brain tumers. J Neurosurg. 2007;106:128–133. doi: 10.3171/jns.2007.106.1.128. [DOI] [PubMed] [Google Scholar]
- 24.Jeong JW, Asano E, Yeh FC, Chugani DC, Chugani HT. Independent component analysis tractography combined with a ball-stick model to isolate intra-voxel crossing fibers of the corticospinal tracts in clinical diffusion MRI. Magn Reson Med. 2012 Sep 21; doi: 10.1002/mrm.24487. [Epub ahead of print] [DOI] [PMC free article] [PubMed] [Google Scholar]
- 25.Bertrand G, Blundell J, Musella R. Electrical Exploration of the Internal Capsule and Neighbouring Structures during Stereotaxic Procedures. J Neurosurg. 1965;22:333–343. doi: 10.3171/jns.1965.22.4.0333. [DOI] [PubMed] [Google Scholar]
- 26.Dawnay NA, Glees P. Somatotopic analysis of fibre and terminal distribution in the primate corticospinal pathway. Brain Res. 1986;391:115–123. doi: 10.1016/0165-3806(86)90013-1. [DOI] [PubMed] [Google Scholar]
- 27.Hardy TL, Bertrand G, Thompson CJ. The position and organization of motor fibers in the internal capsule found during stereotactic surgery. Appl Neurophysiol. 1979;42:160–170. doi: 10.1159/000102360. [DOI] [PubMed] [Google Scholar]
- 28.Lee JS, Asano E, Muzik O, et al. Sturge-Weber syndrome: correlation between clinical course and FDG PET findings. Neurology. 2001;57:189–195. doi: 10.1212/wnl.57.2.189. [DOI] [PubMed] [Google Scholar]
- 29.Feidlin R, Özarslan E, Komlosh M, et al. Parsimonious model selection for tissue segmentation and classification applications: a study using simulated and experimental DTI data. IEEE Trans Med Imaging. 2007;26:1576–1584. doi: 10.1109/TMI.2007.907294. [DOI] [PubMed] [Google Scholar]
- 30.Hyvärinen A, Oja E. A fast fixed-point algorithm for independent component analysis. Neural Comput. 1997;9:1483–1492. [Google Scholar]
- 31.Schultz T, Westin CF, Kindlmann G. Multi-diffusion-tensor fitting via spherical deconvolution: a unifying framework. Med Image Comput Comput Assist Interv. 2010;13(Pt 1):674–681. doi: 10.1007/978-3-642-15705-9_82. [DOI] [PMC free article] [PubMed] [Google Scholar]
- 32.Tournier JD, Calamante F, Connelly A. Robust determination of the fibre orientation distribution in diffusion MRI: non-negativity constrained super-resolved spherical deconvolution. Neuroimage. 2007;35:1459–1472. doi: 10.1016/j.neuroimage.2007.02.016. [DOI] [PubMed] [Google Scholar]
- 33.Ashburner J. A fast diffeomorphic image registration algorithm. Neuroimage. 2007;38:95–113. doi: 10.1016/j.neuroimage.2007.07.007. [DOI] [PubMed] [Google Scholar]
- 34.Duda RO, Hart PE, Strok DG. Pattern Classificaiton. 2. New York: Wiley; 2001. pp. 228–237. [Google Scholar]
- 35.Ciccarelli O, Toosy AT, Parker GJ, et al. Diffusion tractography based group mapping of major white-matter pathways in the human brain. Neuroimage. 2003;19:1545–1555. doi: 10.1016/s1053-8119(03)00190-3. [DOI] [PubMed] [Google Scholar]
- 36.Catani M, Allin MP, Husain M, et al. Symmetries in human brain language pathways correlate with verbal recall. Proc Natl Acad Sci USA. 2007;104:17163–17168. doi: 10.1073/pnas.0702116104. [DOI] [PMC free article] [PubMed] [Google Scholar]
- 37.Sivaswamy L, Rajamani K, Juhasz C, Maqbool M, Makki M, Chugani HT. The corticospinal tract in Sturge-Weber syndrome: a diffusion tensor tractography study. Brain Dev. 2008;30:447–453. doi: 10.1016/j.braindev.2007.12.009. [DOI] [PMC free article] [PubMed] [Google Scholar]
- 38.Bürgel U, Amunts K, Hoemke L, Mohlberg H, Gilsbach JM, Zilles K. White matter fiber tracts of the human brain: three-dimensional mapping at microscopic resolution, topography and intersubject variability. Neuroimage. 2006;29:1092–1105. doi: 10.1016/j.neuroimage.2005.08.040. [DOI] [PubMed] [Google Scholar]
- 39.Wyllie E, Awad I. Invasive neurophysiologic techniques in the evaluation for epilepsy surgery in children. In: Luders HO, editor. Epilepsy Surgery. New York: Raven Press; 1991. pp. 409–412. [Google Scholar]
- 40.Lesser RP, Crone NE, Webber WR. Subdural electrodes. Clin Neurophysiol. 2010;121:1376–1392. doi: 10.1016/j.clinph.2010.04.037. [DOI] [PMC free article] [PubMed] [Google Scholar]
- 41.Haseeb A, Asano E, Juhasz C, Shah A, Sood S, Chugani HT. Young patients with focal seizures may have the primary motor area for the hand in the postcentral gyrus. Epilepsy Res. 2007;76:131–139. doi: 10.1016/j.eplepsyres.2007.07.007. [DOI] [PMC free article] [PubMed] [Google Scholar]
- 42.Berman JI, Berger MS, Hung SW, Nagarajan SS, Henry RG. Accuracy of diffusion tensor magnetic resonance imaging tracgography assesed using intraoperative subcortical stimulation mapping and magnetic source imaging. J Neurosurg. 2007;107:488–494. doi: 10.3171/JNS-07/09/0488. [DOI] [PubMed] [Google Scholar]


