

Abstract
Rationale
Impulsive behavior is associated with both alcohol use disorders and a family history of alcoholism (FHA). One operational definition of impulsive behavior is the stop signal task (SST), which measures the time needed to stop a ballistic hand movement.
Objective
Employ functional magnetic resonance imaging (fMRI) to study right frontal responses to stop signals in heavy drinking subjects with and without FHA, and as a function of alcohol exposure.
Methods
Twenty two family history positive (FHP; age = 22.7 years, SD= 1.9) and 18 family history negative (FHN; age = 23.7, SD= 1.8) subjects performed the SST in fMRI in two randomized visits: once during intravenous infusion of alcohol, clamped at a steady-state breath alcohol (BrAC) concentration of 60mg%, and once during infusion of placebo saline. An independent reference group (n= 13, age= 23.7, SD= 1.8) was used to identify a priori right prefrontal regions activated by successful inhibition (Inh) trials, relative to ‘Go’ trials that carried no need for inhibition (Inh > Go).
Results
FHA interacted with alcohol exposure in right prefrontal cortex, where alcohol reduced [Inh > Go] activation in FHN subjects, but not in FHP subjects. Within this right frontal cortical region, stop signal reaction time (SSRT) also correlated negatively with [Inh > Go] activation, suggesting that the [Inh > Go] activity was related to inhibitory behavior.
Conclusions
The results are consistent with the low level of response theory (Schuckit, 1980; Quinn & Fromme, 2011), with FHP being less sensitive to alcohol’s effects.
Keywords: fMRI, alcoholism, family history, stop signal, inhibition, impulsivity, frontal lobes
Introduction
A family history of alcoholism (FHA) doubles the risk of alcohol dependence (Nurnberger et al., 2004). Beyond the risk for alcohol use disorders, familial alcoholism is also significantly associated with impulsive and externalizing behaviors (Marmorstein et al., 2009)–behaviors thought to be relevant to drinking initiation, escalation, and treatment relapse (Perry & Carroll, 2008).
One operational definition of impulsive behavior is stop signal reaction time (SSRT), or the time needed to withdraw (stop) a ballistic hand movement (Logan, 1994; Logan et al., 1997). Distinct from delay discounting, which measures impulsive devaluing of reward as a function of time, the motor impulsiveness assessed by SSRT represents the speed (or slowness) with which an individual can accommodate an environmental demand to halt a behavior. Using the stop signal task (SST) to quantify SSRT, Nigg et al. (2004) found that alcohol-naïve adolescent offspring of alcoholic fathers had slower SSRTs than children from control families, and that SSRT predicted aggregate future alcohol and drug problems (Nigg et al., 2006). Acheson, et al (2011) also reported more SST inhibition failures in FHP adults without histories of alcohol or drug use disorders. These findings suggest that slower SSRTs in illicit substance use (Lipszyc & Schachar, 2010) may be more than a toxicologic effect, and reflect a pre-existing deficit in the frontal and subcortical brain systems that regulate behavioral inhibition. In imaging, a large scale functional magnetic resonance imaging (fMRI) study of the SST (Whelan et al., 2012) found lower orbitofrontal responses related to successful inhibition in adolescents who had used illicit substances (although frequent users of illicit drugs also had higher responses in right inferior frontal cortex). In alcohol dependent patients, Li (2009) showed a reduced left frontal response in successful compared to errant stop signal inhibition. Smokers and problem gamblers have also been shown to have less medial-dorsal frontal activation during SST (de Ruiter et al., 2012). Contrary to the evidence above, however, it is of note that, in all of these imaging studies of addiction, SSRT was not different between controls and the clinical samples of interest.
Beyond its potential as a reflection of baseline behavioral impulsiveness, SSRT and inhibition success (but not choice reaction time) are worsened by alcohol intoxication (e.g., De Wit et al., 2000; Fillmore & Vogel-Sprott, 1999). In turn, this aggravated motor impulsiveness (lengthened SSRT) has been found to correlate with increasingly maladaptive reward-seeking behaviors (Loeber & Duka, 2009). Thus, as inhibitory control worsens during intoxication, so does ad lib alcohol consumption (Weafer & Fillmore, 2008), speaking to a potential mechanism in the loss of control of drinking.
Against this background, we examined frontal lobe responses to stop signal behavior in groups of heavy drinking subjects with and without FHA. Subjects performed the SST in fMRI during exposure to intravenously infused alcohol that was clamped at a breath alcohol concentration (BrAC) of 60mg%, as well as during an intravenous infusion of placebo saline. Given alcohol’s propensity to induce behavioral disinhibition, as well as the relationship between familial alcoholism and impulsive behaviors, we hypothesized that FHP individuals would be disproportionately affected by acute alcohol exposure, both in SSRT and in a right inferior frontal region implicated in behavioral inhibition (e.g., Aron & Poldrack, 2006; Congdon et al., 2010; Whelan et al., 2012).
Materials and Methods
Subjects
Forty-three non-dependent, non-treatment seeking, heavy drinking subjects were recruited by use of advertisements placed in the community. Subjects were assessed using the Semi-Structured Assessment for the Genetics of Alcoholism (SSAGA; Bucholz et al., 1994), the Timeline Followback interview for habitual drinking (TLFB; Sobell et al., 1986), the Alcohol Use Disorders Identification Test (AUDIT; Saunders et al., 1993), and urine screens for drugs of abuse. All subjects had previously participated in a larger, ongoing behavioral study in which they performed the SST during clamped alcohol and placebo exposures outside the scanner. Three subjects did not have usable imaging data because of their inability to either remain awake (one subject) or to perform the task (two subjects).
The resulting 40 subjects (Table 1) consisted of 22 individuals with positive family histories of alcoholism (FHP), and 18 of whom were family history negative (FHN). FHP had at least one first degree relative with probable alcoholism, and at least one other first or second degree relative (with one exception being a subject with 4 second degree relatives), assessed using the family history assessment module of the SSAGA and interviewing only the subject (not the subjects’ family members). As intended, the family history groups did not differ (ps > 0.10) in age, education, drinking patterns, age at initiation of regular drinking, current AUDIT scores, or in scores on the Subjective Rating of the Effects of alcohol inventory (SRE; Schuckit & Smith, 1997). All subjects were right handed. Although we did not exclude for drug experimentation, none of the subjects had histories of drug dependence. None tested positive for drugs of abuse, except for one FHP subject who was positive for stimulants the day of his saline infusion scan (prior night’s use of a prescription stimulant for studying). Data were therefore analyzed with and without this subject/session.
Table 1.
Subject Characteristics.
| FHP (n= 22) | FHN (n=18) | |||
|---|---|---|---|---|
| Mean (SD) | n (%) | Mean (SD) | n (%) | |
| Age | 22.7 (1.9) | 23.7 (1.8) | ||
| Male (%) | 12 (54.5) | 11 (61.1) | ||
| Smokers* (%) | 2 (9.1) | 0 (0) | ||
| Education (yrs) | 15.1 (1.8) | 15.8 (0.8) | ||
| Drinks/drinking day | 5.1 (3.1) | 5.4 (2.4) | ||
| Heavy drinking days/week | 1.5 (1.3) | 1.3 (0.8) | ||
| Drinks/week | 15.1 (13.0) | 13.9 (6.9) | ||
| Age of regular drinking | 18.2 (1.7) | 18.3 (1.9) | ||
| AUDIT | 8.1 (2.6) | 9.1 (3.2) | ||
| SRE (first 5 times drinking) | 4.4 (1.9) | 4.1 (1.4) | ||
| SRE (most recent 3 months) | 5.8 (2.0) | 5.4 (1.6) | ||
| SRE (heaviest period) | 7.6 (3.0) | 8.6 (2.0) | ||
Notes:
Of the two smoking subjects, one reported at 0.25 pack/day habit, while the second reported a 0.3 pack/day habit. One heavy drinking day is ≥5 drinks for men, ≥4 for women (NIAAA, 2005). AUDIT= Alcohol Use Disorder Identification Test (scores unavailable for 2 FHP subjects and 3 FHN subjects). SRE= Subjective Rating of the Effects of alcohol inventory, quantified as number of drinks required to obtain detectable effects rated.
To assist in defining regions of interest (ROIs) for analysis, we first imaged a similarly aged (23.7 years, SD=1.8) “reference sample” of 13 (six male) right-handed healthy community volunteers who performed the SST during fMRI without any intravenous infusions. This permitted defining a priori regions that responded to the task in an independent sample that was unrelated to those samples tested for the effects of alcohol and FHA. Although detailed TLFB results are not available for this group, five described drinking 2-4 times per week, four drank 2-4 times per month, three drank once per month, and one abstained. Of those who did drink alcohol, all but one drank under five drinks per occasion, with the remaining subject drinking more than six per occasion on a weekly basis.
Stop Signal Task (SST)
An SST, modeled after Rubia et al (2003), was programmed in E-Prime 2.0 software (Psychology Software Tools Inc., Sharpsburg, PA). Each of 3 individual task runs consisted of 80 ‘Go’ trials, each requiring a left or right button press on an MRI-compatible response box (Current Designs, Philadelphia, PA) to horizontal green arrows pointing either left or right; subjects were instructed to respond as quickly and as accurately as possible. An additional 40 ‘Stop’ trials were marked by a red up-pointing arrow immediately after a Go stimulus, indicating the need to inhibit the Go response to the prior green arrow (total of 240 Go trials and 120 Stop trials). An adaptive staircase algorithm adjusted the delay between ‘Go’ and ‘Stop’ stimuli in 50 ms increments to target a stop inhibition rate of 50%; in the current context, the algorithm also compensates for effects related to practice, fatigue, and intoxication. Estimated SSRT for a given subject was calculated by subtracting a subject’s average stop signal delay from that subject’s xth percentile Go reaction time (RT), where x corresponds to the stop failure rate (Band et al., 2003). Thus, if a subject failed to stop on 45% of stop trials, the Go RT subtracted from the average stop signal delay would be the time falling at the 45th percentile of the subject’s Go RT distribution. A mirror mounted on the head coil enabled subjects to view the stimuli as back-projected on a screen at the rear of the scanner bore.
Procedure
Subjects reported to the Indiana Clinical Research Center (CRC) on two mornings, between 7 am and 9 am (average number of days between scanning, 9.4, SD= 6.1, with no significant differences between the FHA groups; p= 0.30). Subjects understood that one scan would be done with alcohol and one with saline, although subjects remained blinded to the infusate content on each day. After obtaining height and weight, a catheter was placed in a vein in the antecubital fossa of the subject’s non-dominant arm. Subjects were then fed a calorically standardized breakfast, and escorted to the imaging facility between 9 am and 11 am. Following imaging, subjects returned to the CRC for lunch, and remained at the CRC until BrAC fell below 20 mg% (0.02 g/L).
Imaging
Subjects were imaged on a Siemens (Siemens Healthcare, Erlangen, Germany) 3T Magnetom Trio-Tim scanner using a 12-channel head coil array. Three echo-planar imaging (EPI) scans measured SST responses (193 blood oxygenation level dependent [BOLD] volumes, gradient echo, repetition time 2,000 ms, echo time 29 ms, flip angle 76°, 35 interleaved 3 mm thick axial slices, acquisition matrix 88×88, 2.5×2.5× 3.0 mm3 voxels, GRAPPA acceleration factor 2, 3D prospective acquisition correction algorithm). In addition, five 5:45 min long pulsed arterial spin labeling (PASL) scans measured regional cerebral blood flow (rCBF; ml/100gr/min) using a one-compartment model (Wang et al., 2003): (1) at baseline (before infusion), (2-3) twice during the ascending limb, (4) once after reaching the intended brain alcohol concentration target, and (5) once after BOLD imaging. These data were collected to assure that alcohol infusion did not significantly affect global rCBF, effectively decoupling the BOLD signal from neural responses (see below). PASL scans were acquired using the Siemens product sequence with a Q2TIPS PICORE (Luh et al., 1999) labeling scheme, as detailed in Yang, et al (2011) with a 64 label-control pair readout (gradient-echo single shot EPI; 18 ascending slices, matrix 64×64, 3.75×3.75×6 mm3 voxels, same acceleration as BOLD and including prospective motion correction). In addition, high resolution (MP-RAGE sequence with 1×1× 1.2 mm3 voxels) anatomical images were obtained for each subject to facilitate transformation to a common stereotactic system and to segment out gray matter tissue.
Alcohol Infusion
Subjects were intravenously infused with either alcohol (6% vol/vol) or saline (placebo) in randomized, counter-balanced order on each of the two days. Infusion pump rates were computer-controlled (O’Connor et al., 1998; Ramchandani et al., 1999), with the infusion profile customized for each individual to achieve the same time-course of breath alcohol concentration (BrAC) for all subjects: A linear ascension to 60 mg% in 15 min, followed by constant exposure at 60 mg% throughout BOLD imaging. Placebo infusion employed the same pump-rate profile as the individual’s alcohol session. BrAC was measured prior to and after imaging using a forensic grade breath meter.
Between BOLD scans, subjects rated their subjective impressions of the infusion on visual analog scales, using a button box to advance a cursor along a 100 mm line. Subjects rated perceived anxiety, intoxication, number of drinks, stimulation, enjoyment of alcohol, craving for alcohol, and tiredness. For analyses of alcohol’s effect on executive control, we focused on perceived intoxication, number of drinks, stimulation, and enjoyment.
Image Analysis
Functional and rCBF images were pre-processed in SPM8 (Wellcome Trust Centre for Neuroimaging). Individual subject effects were estimated in fixed-effect designs, where responses to the onsets of Go and Stop signal trials were modeled with a standard hemodynamic reference function. An auto-regression term and motion parameter regressors were also used. After prospective motion correction, and as calculated by Jiang et al (1995), mean displacement (residual subject movement) was 0.11 mm (SD= 0.04) during alcohol infusion, and 0.12 mm (SD= 0.08) during saline, without significant differences between groups or conditions (ps > 0.5). As lesion and transcranial magnetic stimulation studies (Aron et al., 2003; Chambers et al., 2006; Floden & Stuss, 2006) suggest a right-lateralized “stop” system, we focused on right prefrontal cortex, testing for activation related to successful inhibitions (Inh) contrasted against correct Go responses (the [Inh > Go] contrast). This contrast has also repeatedly implicated right frontal cortex in the processing of behavioral stop signals (Aron & Poldrack, 2006; Aron et al., 2007; Congdon et al., 2010).
For the primary analyses, a random effects voxel-wise analysis of the [Inh > Go] contrast was conducted in SPM8 in the reference sample to first localize target functional ROIs for subsequent analysis in the two family history groups of interest. This was done using family-wise error corrected cluster statistics (pFWE < 0.05) at a stringent voxel height threshold of p< 0.001 (uncorrected). These right frontal clusters of activation (Table 3) were then used as functional regions of interest from which [Inh > Go] BOLD contrasts in the family history (FH) groups were extracted with the MarsBar utility (Brett et al., 2002). The mean [Inh > Go] BOLD contrast values in these ROIs were then analyzed in 2(FHA) × 2(Infusion) linear mixed models (SPSS v. 20), with our principal effect of interest being the FHA × Infusion interaction. A supplementary and exploratory voxel-wise analysis (p < 0.001, uncorrected; k > 10 voxels) was also done using an SPM factorial model to test for regions other than those identified by the reference group, and where FHA and Infusion might interact (see online supplementary results).
Table 3.
Significant Right Frontal Clusters in the Reference Sample.
| Region/Cluster | MNI | peak | k |
|---|---|---|---|
| x, y, z | Z | ||
| 1. Inferior frontal gyrus* | 54, 18, 14 | 4.61 | 792* |
| 2. Anterior, inferior frontal | 40, 54, 4 | 4.43 | 160 |
| 3. Superior frontal gyrus | 26, 14, 68 | 4.30 | 143 |
| 4. Middle frontal gyrus | 4, 44, 24 | 4.11 | 104 |
| 5. Middle frontal gyrus | 44, 4, 34 | 4.05 | 198 |
Notes: MNI = Montreal Neurological Institute coordinate system. k= cluster size defined at voxel height threshold, p< 0.001.
Sub-peak of a larger cluster in the right insula, extending into right inferior frontal cortex.
Only voxels of at least 75% gray matter tissue (Jahng et al., 2005), as determined by the SPM segmentation of subject’s MP-RAGE images, were used in determining rCBF in whole-brain gray matter and right prefrontal cortex. rCBF in these volumes was analyzed using a 2(Scan) × 2(Infusion) linear mixed model, comparing the pre-infusion baseline scan to the average of the two PASL scans obtained during the clamped alcohol period (and its matched placebo). This allowed us to verify that alcohol did not significantly alter blood flow during the period in which BOLD imaging was conducted— an effect that could depress the BOLD response as an artifact of altered perfusion (e.g., Seifritz et al., 2000).
Results
Reference sample task performance
SST performance during fMRI in the reference sample was characterized by a mean of 98.5% correct Go responses (SD= 1.9%) and 48.6% correctly withheld stop responses (SD= 2.5%), very near the intended 50% targeted by the task’s adaptive algorithm. Mean (of intra-subject median) Go RT was 451 ms (SD= 93), and SSRT was 251 ms (SD=36). This performance was highly similar to that of the FHA samples of interest during fMRI under saline infusion (see Table 2).
Table 2.
Stop Signal Performance
| FHP | FHN | |||
|---|---|---|---|---|
| Alcohol (SD) | Placebo (SD) | Alcohol (SD) | Placebo (SD) | |
| Go Correct (%) | 96.6 (4.0) | 96.4 (6.4) | 98.5 (1.1) | 98.7 (2.0) |
| Stop Correct (%) | 50.1 (3.0) | 51.7 (2.5) | 49.8 (4.1) | 50.0 (3.0) |
| Median Go RT | 455 (138) | 445 (123) | 447 (94) | 428 (86) |
| SSRT*† | 246 (39) | 236 (23) | 267 (33) | 253 (22) |
Notes: RT= Reaction time (ms). SSRT= Stop Signal Reaction Time (ms), calculated as the difference between average stop signal delay interval (ms) and Go RT (see Methods for details).
Main effect of FHA, p= 0.037;
Main effect of infusion, p= 0.012. See text for more detailed descriptions of the effects.
Effects of Alcohol: Subjective perceptions, rCBF, task performance
Breath alcohol
BrAC as measured after SST in fMRI was 60.0 mg% (SD= 7.1) on the alcohol days, and insignificantly different between FHP (60.2 mg%, SD= 6.0) and FHN (60.0 mg%, SD= 8.5) groups.
Subjective effects
As analyzed in 2(FHA) × 2(Infusion) × 5(Time) linear mixed models, with Infusion and Time as repeated measures, there were significant main effects of Infusion for perceived Intoxication (p < 0.001), Number of Drinks (p< 0.001), Stimulation (p= 0.001), Relaxation (p= 0.001), and Enjoyment (p< 0.001). Infusion × Time interactions were also evident for Intoxication (p< 0.001), Number of Drinks (p< 0.001), Stimulation (p< 0.001), and Enjoyment (p< 0.001). Thus, as intended, infused alcohol induced a clear subjective sense of alcohol exposure. The sole effect involving FHA was an FHA × Infusion interaction for Relaxation (p= 0.006), which reflected greater relaxation under alcohol in FHP (43.6, SE= 3.7) than in FHN (31.1, SE= 4.1), with Relaxation during placebo being equivalent across FHP (29.8, SE= 3.7) and FHN (29.7, SE= 4.1).
rCBF
For both whole brain and right frontal gray matter, there were no main effects of Infusion, and most importantly, no Scan × Infusion interactions (ps > 0.17) that would indicate an rCBF change from the pre-infusion baseline as a function of the infusate.
Stop signal performance
Analyzed in a 2(FH) × 2(Infusion) linear mixed model, a trend FHA main effect reflected small differences in percent correct Go responses between FHP (96.5%, SE= 0.7%) and FHN (98.6%, SE= 0.8%; p= 0.055), although this occurred in the context of greater than 95% mean accuracy in both groups during both infusions. The task algorithm again functioned as intended, as Stop trial accuracy was almost exactly 50% in both FHA groups in both infusions (Table 2).
Analyzed in a 2(FH) × 2(Infusion) linear mixed model, Go RT (average of intra-subject medians) was not significantly slower under alcohol (451 ms, SE= 19) than under placebo (437 ms, SE= 17; infusion main effect, p= 0.078). However, there was a significant main effect of infusion on SSRT (p= 0.012), with clamped alcohol infusion producing slower SSRTs (256 ms, SE= 6) than placebo saline infusion (244 ms, SE= 4). While there was a main effect of FHA (p= 0.037), the difference was in the opposite direction than hypothesized, with FHN SSRT being slower (260 ms, SE= 7) than FHP SSRT (241 ms, SE= 6). There was no FHA× Infusion interaction.
BOLD imaging of SST
Reference sample BOLD response to SST
The reference sample showed five significant right pre-frontal clusters for [Inh > Go] (Figure 1, top; Table 3), which were then used to define regions from which the same BOLD contrast was extracted in the FHA groups. Of note, the overall anatomic distribution of the [Inh > Go] effect in the reference sample was very similar to that of the FHN while imaged under placebo/saline (Figure 1, bottom); the location and magnitude of these effects was unchanged when excluding the one reference subject with more hazardous drinking (>6 per occasion).
Figure 1.
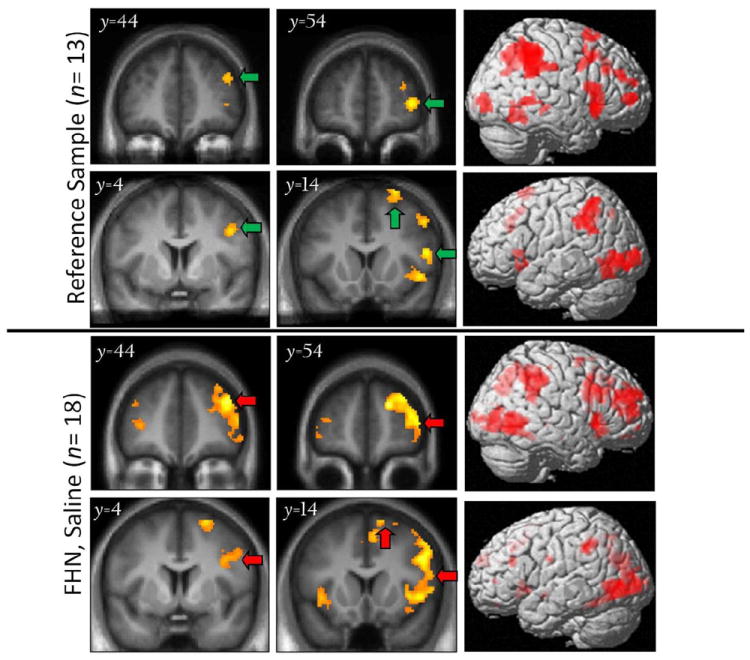
[Inh > Go] BOLD response in the reference sample (top) and in family history negative (FHN) subjects under placebo conditions (bottom), with 3D rendering of activation (right-most column). Note lateralized effects in right frontal cortex. Green arrows: Significant (pFWE< 0.05) clusters of BOLD responses at height threshold puncorr < 0.001. Red arrows: Clusters in FHN that correspond to (are replicated by) those of the reference group. Left = left in coronal slices.
Effects of FHA and alcohol on the BOLD SST response
As examined in a FHA(2) × Infusion(2) linear mixed model, there were no significant FHA or Infusion main effects in the five right frontal ROIs for the [Inh > Go] BOLD contrast. However, in testing the hypothesis that alcohol affected the BOLD contrast differentially by FHA, there was a significant FHA × Infusion interaction (p= 0.008) in the most anterior and inferior right frontal ROI (Cluster #2 in Table 3; Figure 2, top middle panel). This interaction reflected a significant decrease in the FHN response during clamped alcohol, as compared to placebo (p= 0.002), but without any significant change in FHP subjects in the alcohol versus placebo comparison (see Figure 2).
Figure 2.
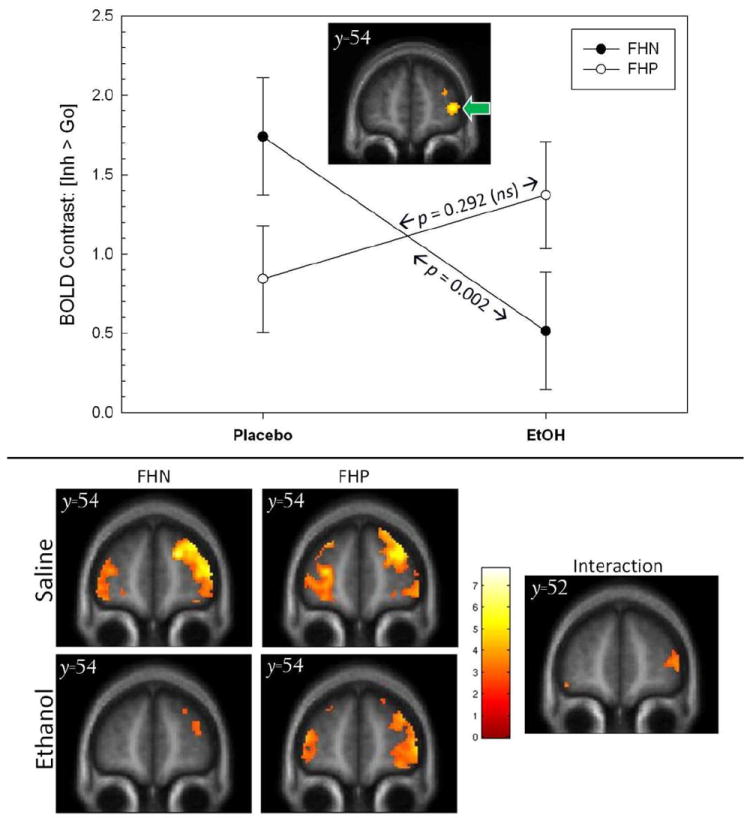
top. Significant (p = 0.008) Infusion × FHA interaction in the [Inh > Go] BOLD contrast within the a priori right anterior/inferior prefrontal ROI (defined by independent reference sample, inset/green arrow and Figure 1). The BOLD contrast was significantly affected by alcohol in FHN (p = 0.002), but not FHP (p= 0.292). FHP= family history positive for alcoholism; FHN= family history negative for alcoholism. Error bars= standard errors of the mean. bottom. For reference, voxel-wise display of individual group/condition effects (left), as well as the Infusion × family history interaction (right) at its peak location (y = 54mm); display threshold, p< 0.005, uncorrected.
Given FHA group differences in SSRT, we also examined the same linear mixed model using SSRT as a covariate. Although the SSRT covariate was significant (p = 0.048), the FHA × Infusion remained significant (p = 0.029). However, there was also a significant FHA × Session × SSRT interaction (p = 0.013). The nature of this three-way interaction involving the covariate was such that during placebo infusion SSRT was negatively correlated with the [Inh > Go] BOLD contrast in FHP (r= −0.50, p = 0.019), but not in FHN (r= −0.01, p = 0.975; Figure 3, left). Thus, within FHP a smaller inferior right prefrontal [Inh > Go] BOLD contrast was associated with a longer SSRT. Under alcohol, however, there was no correlation between SSRT and the [Inh > Go] contrast in FHP (r= 0.12, p = 0.592), although there was a significantly negative correlation between SSRT and [Inh > Go] in FHN (r= −0.67, p = 0.002; Figure 3, right).
Figure 3.
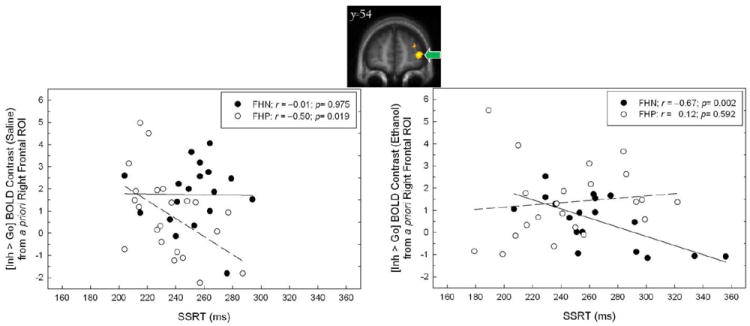
Relationship between stop signal reaction time (SSRT) and the BOLD contrast [Inh > Go] during alcohol and placebo (saline) infusion in the right prefrontal ROI derived from the reference group (voxel map, top; green arrow; also see Figure 1). Separate regression lines reflect trends for FHN (solid) and FHP (dashed).
After re-analysis of the fMRI data without the subject who tested positive for stimulants during the placebo session, the FHA× Infusion interaction remained significant, both without (p= 0.009) and with the SSRT covariate (p< 0.028). Re-analysis of the data when covarying for group differences in perceived relaxation during infusion also did not change the significance of the FHA × Infusion interaction.
Exploratory voxel-wise analyses
Voxel-wise analysis (p< 0.001, uncorrected; k > 10 voxels) of the FHA × Infusion interaction showed right orbital-, superior-, and middle- frontal regions in which FHP were less affected by alcohol infusion (see supplementary results table online). This included a peak at [46, 52, 4], which corresponds closely to the location of the a priori ROI derived from our reference sample ([40, 54, 4], pFWE= 0.016, corrected for the volume that activated in the reference sample ROI; see Table 3). There were no frontal areas in which FHN had greater activation than FHP under alcohol as compared to placebo.
In the ROI analyses, an unexpected three way SSRT × FHA× Infusion interaction had emerged in which the correlation between SSRT and the [Inh > Go] contrast changed as a function of both FHA and infusion. In light of this, we also conducted a voxel-wise analysis to determine if there were any frontal regions in which SSRT correlated negatively with the [Inh > Go] BOLD contrast across all subjects in each of the infusion conditions. This reflects the more intuitive hypothesis that, irrespective of group membership, a slower SSRT should be related to a smaller right frontal [Inh > Go] response. During placebo infusion, there was a right inferior frontal cluster in which SSRT negatively correlated with the [Inh > Go] contrast (p< 0.001, k = 20 voxels at [48, 40, −2], inclusively masked for the [Inh > Go] response main effect under saline; Figure 4, top). During alcohol infusion, there was also negative correlation between SSRT and the [Inh > Go] contrast in a proximal right inferior frontal cluster (p< 0.001; k = 30 voxels at [48, 50, −4], masked inclusively for the [Inh > Go] response main effect under alcohol; Figure 4, bottom). Thus, across all subjects, there was an expected negative relationship in inferior right prefrontal cortex in which less [Inh > Go] activation was related to a longer SSRT. As depicted in Figure 4, this was particularly the case with the larger range of SSRTs that developed under alcohol infusion.
Figure 4.
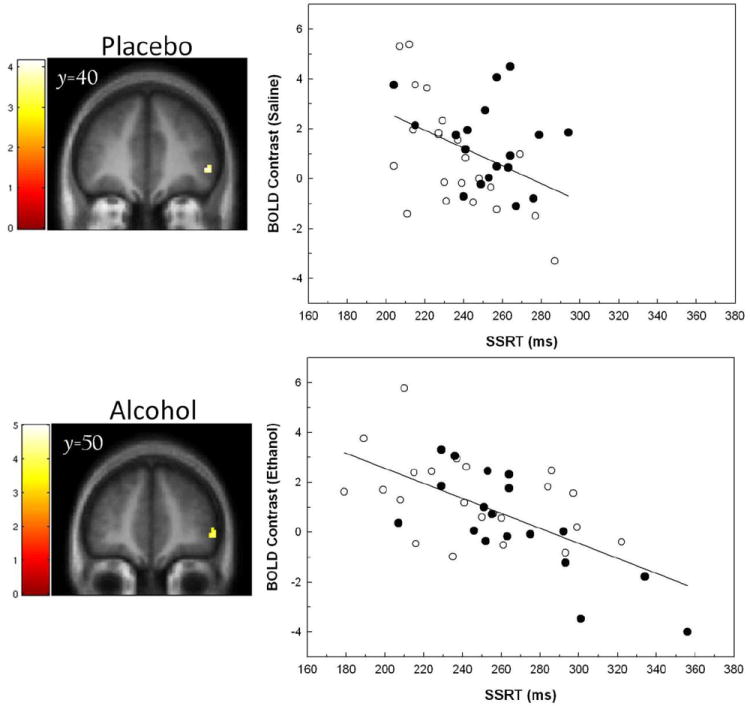
Left. Voxel-wise analyses of the relationship between SSRT and BOLD contrast [Inh > Go] during placebo (saline; top) and alcohol (bottom) infusion. Display threshold p< 0.001, k > 10 voxels, masked for the [Inh > Go] main effect in each of the respective infusions. Right. Plots that illustrate the relationships between SSRT and the BOLD contrast as extracted from the clusters displayed in the voxel-wise maps at left. Solid circles= FHN; Open circles= FHP.
Discussion
The principal finding from this experiment was a significant interaction between alcohol exposure and FHA in right prefrontal BOLD activation during motor inhibition. Compared to FHP subjects, FHN subjects had a non-significant (p= 0.10) trend toward greater right prefrontal activation during saline infusion. During clamped alcohol infusion, however, this right frontal activation in FHN was significantly reduced, while in FHP activation remained essentially unchanged. Moreover, there was a significant negative correlation between SSRT and the right prefrontal BOLD response. That is, those subjects with a smaller right prefrontal BOLD response during behavioral inhibition also tended to need more time (had a longer SSRT) to successfully inhibit their behavioral responses. This negative correlation between SSRT and inferior right prefrontal activity, also reported by others (see Congdon et al., 2010), provides confidence that activity in right inferior prefrontal cortex was related to inhibitory behavior—particularly so when SSRT was lengthened by alcohol infusion.
Impulsive, externalizing behaviors are associated with FHA (Marmorstein et al., 2009). As one operational definition of impulsive behavior, SSRT does appear to be related to both FHA and drinking in some larger behavioral studies (Nigg et al., 2004; Nigg et al., 2006). Meta-analyses suggest that substance dependent patients do have a mild deficit in SSRT (Lipszyc & Schachar, 2010; but also see Whelan et al., 2012 for contradictory findings). Correspondingly, frontal deficits in the BOLD response to stop signals also appear affected in substance use disorders (Whelan et al., 2012; Li et al., 2009; de Ruiter et al., 2012). Although the SST specifically targets the attempt to stop an already initiated motor impulse, others have used the Go/NoGo paradigm to study brain regions involved in behavioral inhibition as a function of FHA. Schweinsburg et al. (2004) reported that FHP youths (as compared to FHN youth) had smaller left middle frontal gyrus responses in successful No-Go trials. Heitzeg et al (2010) reported that only those FHP subjects with alcohol related problems had Go/No-Go activation differences when compared to either FHP or FHN without alcohol-related difficulties. In this latter study, however, FHP subjects with alcohol problems had greater left middle and medial frontal activation related to No-Go responses, while FHN subjects had greater Go-related activation in the ventral caudate. Jamadar, et al (2012) also found greater FHP activation (in the anterior cingulate) during correct No-Go trials when compared to FHN, although memantine (an N-methyl-D-aspartate glutamate receptor antagonist) reduced No-Go responses in the left cingulate and caudate regions of FHP subjects, while it did not in FHN. As far as we know, however, the data that we report here represent the first study of differences in frontal activation in the stop signal paradigm as a function of both FHA and alcohol exposure. While we found only an insignificantly smaller difference in frontal responses to correct stop signal responses in FHP subjects, which is consistent with the Go/No-Go data of Schweinsburg, et al. (2004), only FHN subjects’ activation frontal activation was significantly reduced by alcohol.
Schuckit et al. (1980) first proposed that individuals with FHA are less sensitive to alcohol’s effects. A recent meta-analysis (Quinn & Fromme, 2011) suggests that this effect is not particularly different as a function of alcohol’s stimulant and sedative effects. The same meta-analysis nevertheless found that, when compared to lower drinkers, heavier drinkers are more sensitive to alcohol’s stimulant effects, and less sensitive to alcohol’s sedative effects. In a closely analogous study to the research presented here, Schuckit et al. (2012) used a stop signal paradigm to study non-dependent college drinkers who were stratified by level of response to alcohol. In Schuckit et al.’s (2012) BOLD response comparison that most closely matches our own findings, this group found that those with a low response to alcohol had larger left superior frontal and anterior cingulate BOLD responses to difficult (as compared to easy) stop trials when challenged with oral alcohol (and in comparison to those who reported a higher level of response to alcohol). FHA was, however, not addressed in this study. Moreover, in our work BOLD responses to successful stop trials were compared to Go trials that required no inhibition, while Schuckit et al. (2012) focused on level of difficulty within successful stop trials.
While the direction of our findings was different from what we originally hypothesized, the data are generally consistent with the concept that FHP subjects are less susceptible to (in this case, the adverse cognitive) effects of alcohol exposure in a brain region that plays an important role in behavioral inhibition. This was the case even though the FHA groups were insignificantly different in recent drinking, and in their self-report of tolerance to alcohol in both early and later-life drinking experiences. Both groups were also not significantly different in their response to steady-state alcohol exposure during imaging, as reflected in ratings of perceived number of drinks, intoxication, stimulation, and enjoyment of the infusion. Rather, the dependent measure that proved most sensitive to the effects of alcohol across the family history groups was the right prefrontal response during successful behavioral inhibition.
Several imaging studies of FHA have focused on the reward system. For example, we (Kareken et al., 2010) reported that the aromas of preferred alcoholic drinks elicited a larger response in FHP (compared to FHN) heavy drinkers in a medial prefrontal cortical region implicated in coding subjective reward value. Others have also reported larger frontal and limbic responses in FHP subjects to alcohol-related stimuli (Tapert et al., 2003) and monetary rewards (Acheson et al., 2009; Villafuerte et al., 2012). Some studies, however, suggest that the ventral striatal response to monetary reward may be attenuated in FHP compared to FHN subjects (Andrews et al., 2011) or insignificantly different (Bjork et al., 2008). Thus, these data at least raise the possibility that FHP subjects may have brain systems that are sensitized to reward cues. It may, however, seem somewhat counter-intuitive that a resistance to becoming impulsive under alcohol intoxication (i.e., in FHP individuals) would constitute an endophenotypic risk for developing alcoholism. There are two considerations that may make such a concept more intuitive. First, while laboratory measures of impulsive motor behavior such as the SST do correlate with the self-reported impulsive personality traits that are believed to contribute to alcoholism risk, the magnitude of this association is quite limited (Cyders & Coskunpinar, 2011). Thus, it is certainly possible that an individual may habitually use poor judgment and make impulsive decisions, while still possessing good motor inhibitory capacity. In that vein, there is no significant association between motor inhibition and impulsive reward choice (i.e., delay discounting; Broos et al., 2012). Having said this, a resistance to the cognitively impairing effects of intoxication may carry its own risks, as subjects may perceive a reduced vulnerability to alcohol’s punishing consequences— or in this case the adverse effects in brain systems regulating behavioral control. Thus, the combination of an increased sensitivity to reward and a tolerance to alcohol’s cognitively impairing effects could represent a mechanism of increased risk of progression to heavier drinking, in particular by creating expectancies in drinkers that they can increase their consumption without adverse consequences to their behavior (Vogel-Sprott & Sdao-Jarvie, 1989).
Several considerations in interpreting the findings of this study deserve attention. First, the contrast that we studied was that of successful inhibition compared to Go trials in the absence of any inhibitory demand. This is a widely studied contrast that reliably produces right inferior frontal activation in this study and elsewhere (Aron & Poldrack, 2006; Aron et al., 2007; Xue et al., 2008). Right inferior frontal activation from this contrast also correlates with SSRT (Congdon et al., 2010). However, some note that this BOLD contrast may instead more accurately model a right frontal attentional system involved in processing stop signals, rather than successful motor inhibition, per se (e.g., Zhang & Li, 2012). Thus, there is the possibility that our data speak more to an attentional network that monitors inhibitory signals, rather than a network that directly controls motor inhibition (and, we do note that we did not find significant FHA effects when examining successful stopping compared to the baseline of failed inhibition). There was also an unexpected difference between FHP and FHN subjects in SSRT that, while small in absolute magnitude, was significant and in the opposite direction (FHN > FHP) than expected (Nigg et al., 2004). Whether this difference is truly representative likely requires a larger sample for analysis. Moreover, although there was a clear effect of infusion on the SSRT response, there was no FHA × Infusion interaction on SSRT to mirror the same interaction in right frontal BOLD response. Although SSRT did correlate negatively with the BOLD response in this region, it may be the case that the sample size was not large enough to detect this behavioral interaction. It is similarly unclear why there was a negative correlation between SSRT and right prefrontal BOLD responses in the FHP under placebo, but not under alcohol. Normally, a negative correlation would be expected, with a lower frontal response relating to a longer time to inhibit behavior. It can be challenging to find correlations between physiology and behavior in smaller samples (Congdon et al., 2010), and it was the case that, with voxel-wise exploration, there were similar right frontal regions in which the BOLD response negatively correlated with SSRT across both samples, and in both alcohol and placebo conditions. Thus, regional sampling error and statistical power may be considerations here. Gender effects may also be present, although the current sample size does not permit examining interactions with gender. Finally, BOLD responses can be decoupled from neuronal activity when using a vasoactive drug that significantly changes cerebral blood flow. We doubt that this played a large role in our data, as alcohol did not significantly affect rCBF in either the whole brain or in right prefrontal cortex, where FHA interacted with Infusion on the BOLD response.
Conclusions
The data from this study suggest that FHA interacts with alcohol exposure in brain regions important to behavioral inhibition. In particular, the findings suggest that heavier drinking FHP subjects have right prefrontal regions that are less affected by alcohol exposure than FHN subjects who drink equivalently. The findings reinforce the concept that FHA may involve an inherent insensitivity to the adverse effects of alcohol, including in brain systems that mediate inhibitory behavior. From a clinical point of view, this reduced sensitivity could increase alcoholism risk by creating the subjective impression of an invulnerability to alcohol’s adverse cognitive consequences while drinking.
Supplementary Material
Acknowledgments
We gratefully acknowledge Kyle Windisch, Christopher Hobbick, and Dongbing Lai for assistance with computer programming, Courtney Robbins and Michele Beal for fMRI acquisition, and Jim Hayes, Kurt White, Cari Lehigh, Rose Case, Stella Tran, Cristina Soeurt, and Melissa Walker for recruitment and subject management. Supported by NIH grants P60 AA007611 and TR000006.
References
- Acheson A, Richard DM, Mathias CW, Dougherty DM. Adults with a family history of alcohol related problems are more impulsive on measures of response initiation and response inhibition. Drug and Alcohol Dependence. 2011;117:198–203. doi: 10.1016/j.drugalcdep.2011.02.001. [DOI] [PMC free article] [PubMed] [Google Scholar]
- Acheson A, Robinson JL, Glahn DC, Lovallo WR, Fox PT. Differential activation of the anterior cingulate cortex and caudate nucleus during a gambling simulation in persons with a family history of alcoholism: Studies from the Oklahoma Family Health Patterns Project. Drug and Alcohol Dependence. 2009;100:17–23. doi: 10.1016/j.drugalcdep.2008.08.019. [DOI] [PMC free article] [PubMed] [Google Scholar]
- Andrews MM, Meda SA, Thomas AD, Potenza MN, Krystal JH, Worhunsky P, Stevens MC, O’Malley S, Book GA, Reynolds B, Pearlson GD. Individuals Family History Positive for Alcoholism Show Functional Magnetic Resonance Imaging Differences in Reward Sensitivity That Are Related to Impulsivity Factors. Biological Psychiatry. 2011;69:675–683. doi: 10.1016/j.biopsych.2010.09.049. [DOI] [PMC free article] [PubMed] [Google Scholar]
- Aron AR, Behrens TE, Smith S, Frank MJ, Poldrack RA. Triangulating a cognitive control network using diffusion-weighted magnetic resonance imaging (MRI) and functional MRI. Journal of Neuroscience. 2007;27:3743–3752. doi: 10.1523/JNEUROSCI.0519-07.2007. [DOI] [PMC free article] [PubMed] [Google Scholar]
- Aron AR, Fletcher PC, Bullmore ET, Sahakian BJ, Robbins TW. Stop-signal inhibition disrupted by damage to right inferior frontal gyrus in humans. Nature Neuroscience. 2003;6:115–116. doi: 10.1038/nn1003. [DOI] [PubMed] [Google Scholar]
- Aron AR, Poldrack RA. Cortical and Subcortical Contributions to Stop Signal Response Inhibition: Role of the Subthalamic Nucleus. Journal of Neuroscience. 2006;26:2424–2433. doi: 10.1523/JNEUROSCI.4682-05.2006. [DOI] [PMC free article] [PubMed] [Google Scholar]
- Band GPH, van der Molen MW, Logan GD. Horse-race model simulations of the stop-signal procedure. Acta Psychologica. 2003;112:105–142. doi: 10.1016/s0001-6918(02)00079-3. [DOI] [PubMed] [Google Scholar]
- Bjork J, Knutson B, Hommer D. Incentive-elicited striatal activation in adolescent children of alcoholics. Addiction. 2008;103:1308–1319. doi: 10.1111/j.1360-0443.2008.02250.x. [DOI] [PubMed] [Google Scholar]
- Brett M, Anton J-L, Valabregue R, Poline J-B. Region of interest analysis using an SPM toolbox. NeuroImage. 2002;16:2. Abstract. [Google Scholar]
- Broos N, Schmaal L, Wiskerke J, Kostelijk L, Lam T, Stoop N, Weierink L, Ham J, de Geus EJC, Schoffelmeer ANM, van den Brink W, Veltman DJ, de Vries TJ, Pattij T, Goudriaan AE. The Relationship between Impulsive Choice and Impulsive Action: A Cross-Species Translational Study. PLoS ONE. 2012;7:e36781. doi: 10.1371/journal.pone.0036781. [DOI] [PMC free article] [PubMed] [Google Scholar]
- Bucholz KK, Cadoret R, Cloninger CR, Dinwiddie SH, Hesselbrock VM, Nurnberger JI, Jr, Reich T, Schmidt I, Schuckit MA. A new, semi-structured psychiatric interview for use in genetic linkage studies: a report on the reliability of the SSAGA. Journal of Studies on Alcohol. 1994;55:149–158. doi: 10.15288/jsa.1994.55.149. [DOI] [PubMed] [Google Scholar]
- Chambers CD, Bellgrove MA, Stokes MG, Henderson TR, Garavan H, Robertson IH, Morris AP, Mattingley JB. Executive “Brake Failure” following Deactivation of Human Frontal Lobe. Journal of Cognitive Neuroscience. 2006;18:444–455. doi: 10.1162/089892906775990606. [DOI] [PubMed] [Google Scholar]
- Congdon E, Mumford JA, Cohen JR, Galvan A, Aron AR, Xue G, Miller E, Poldrack RA. Engagement of large-scale networks is related to individual differences in inhibitory control. NeuroImage. 2010;53:653–663. doi: 10.1016/j.neuroimage.2010.06.062. [DOI] [PMC free article] [PubMed] [Google Scholar]
- Cyders MA, Coskunpinar A. Measurement of constructs using self-report and behavioral lab tasks: Is there overlap in nomothetic span and construct representation for impulsivity? Clinical Psychology Review. 2011;31:965–982. doi: 10.1016/j.cpr.2011.06.001. [DOI] [PubMed] [Google Scholar]
- de Ruiter MB, Oosterlaan J, Veltman DJ, van den Brink W, Goudriaan AE. Similar hyporesponsiveness of the dorsomedial prefrontal cortex in problem gamblers and heavy smokers during an inhibitory control task. Drug and Alcohol Dependence. 2012;121:81–89. doi: 10.1016/j.drugalcdep.2011.08.010. [DOI] [PubMed] [Google Scholar]
- De Wit H, Crean J, Richards JB. Effects of d-amphetamine and ethanol on a measure of behavioral inhibition in humans. Behavioral Neuroscience. 2000;114:830–837. doi: 10.1037//0735-7044.114.4.830. [DOI] [PubMed] [Google Scholar]
- Fillmore MT, Vogel-Sprott M. An Alcohol Model of Impaired Inhibitory Control and Its Treatment in Humans. Experimental and Clinical Psychopharmacology. 1999;7:49–55. doi: 10.1037//1064-1297.7.1.49. [DOI] [PubMed] [Google Scholar]
- Floden D, Stuss DT. Inhibitory Control is Slowed in Patients with Right Superior Medial Frontal Damage. Journal of Cognitive Neuroscience. 2006;18:1843–1849. doi: 10.1162/jocn.2006.18.11.1843. [DOI] [PubMed] [Google Scholar]
- Heitzeg MM, Nigg JT, Yau WYW, Zucker RA, Zubieta JK. Striatal Dysfunction Marks Preexisting Risk and Medial Prefrontal Dysfunction Is Related to Problem Drinking in Children of Alcoholics. Biological Psychiatry. 2010;68:287–295. doi: 10.1016/j.biopsych.2010.02.020. [DOI] [PMC free article] [PubMed] [Google Scholar]
- Jahng GH, Song E, Zhu XP, Matson GB, Weiner MW, Schuff N. Human Brain: Reliability and Reproducibility of Pulsed Arterial Spin-labeling Perfusion MR Imaging1. Radiology. 2005;234:909–916. doi: 10.1148/radiol.2343031499. [DOI] [PMC free article] [PubMed] [Google Scholar]
- Jamadar S, DeVito E, Jiantonio R, Meda S, Stevens M, Potenza M, Krystal J, Pearlson G. Memantine, an NMDA receptor antagonist, differentially influences Go/No-Go performance and fMRI activity in individuals with and without a family history of alcoholism. Psychopharmacology. 2012;222:129–140. doi: 10.1007/s00213-011-2628-2. [DOI] [PMC free article] [PubMed] [Google Scholar]
- Jiang AP, Kennedy DN, Baker JR, Weisskoff RM, Tootell RBH, Woods RP, Benson RR, Kwong KK, Brady TJ, Rosen BR, Belliveau JW. Motion detection and correction in functional MR imaging. Human Brain Mapping. 1995;3:224–235. [Google Scholar]
- Kareken DA, Bragulat V, Dzemidzic M, Cox C, Talavage T, Davidson D, O’Connor SJ. Family history of alcoholism mediates the frontal response to alcoholic drink odors and alcohol in at-risk drinkers. NeuroImage. 2010;50:267–276. doi: 10.1016/j.neuroimage.2009.11.076. [DOI] [PMC free article] [PubMed] [Google Scholar]
- Li CsR, Luo X, Yan P, Bergquist K, Sinha R. Altered Impulse Control in Alcohol Dependence: Neural Measures of Stop Signal Performance. Alcoholism: Clinical and Experimental Research. 2009;33:740–750. doi: 10.1111/j.1530-0277.2008.00891.x. [DOI] [PMC free article] [PubMed] [Google Scholar]
- Lipszyc J, Schachar R. Inhibitory control and psychopathology A meta-analysis of studies using the stop signal task. Journal of the International Neuropsychological Society. 2010;16:1064–1076. doi: 10.1017/S1355617710000895. [DOI] [PubMed] [Google Scholar]
- Loeber S, Duka T. Acute alcohol impairs conditioning of a behavioural reward-seeking response and inhibitory control processes-- Implications for addictive disorders. Addiction. 2009;104:2013–2022. doi: 10.1111/j.1360-0443.2009.02718.x. [DOI] [PubMed] [Google Scholar]
- Logan GD. On the ability to inhibit thought and action: A users’ guide to the stop signal paradigm. In: Dagenbach D, Carr TH, editors. Inhibitory processes in attention, memory, and language. San Diego: Academic Press; 1994. [Google Scholar]
- Logan GD, Schachar RJ, Tannock R. Impulsivity and inhibitory control. Psychological Science. 1997;8:60–64. [Google Scholar]
- Luh W, Wong E, Bandettini P, Hyde J. QUIPSS II with thin-slice TI1 periodic saturation: a method for improving accuracy of quantitative perfusion imaging using pulsed arterial spin labeling. Magnetic Resonance in Medicine. 1999;41:1246–1254. doi: 10.1002/(sici)1522-2594(199906)41:6<1246::aid-mrm22>3.0.co;2-n. [DOI] [PubMed] [Google Scholar]
- Marmorstein NR, Iacono WG, McGue M. Alcohol and illicit drug dependence among parents: associations with offspring externalizing disorders. Psychological Medicine. 2009;39:149–155. doi: 10.1017/S0033291708003085. [DOI] [PMC free article] [PubMed] [Google Scholar]
- NIAAA. Helping Patients Who Drink Too Much: A Clinician’s Guide. 2. Bethesda, M.D.: U.S. Department of Health & Human Services; 2005. [Google Scholar]
- Nigg JT, Glass JM, Wong MM, Poon E, Jester JM, Fitzgerald HE, Puttler LI, Adams KM, Zucker RA. Neuropsychological executive functioning in children at elevated risk for alcoholism: Findings in early adolescence. Journal of Abnormal Psychology. 2004;113:302–314. doi: 10.1037/0021-843X.113.2.302. [DOI] [PubMed] [Google Scholar]
- Nigg JT, Wong MM, Martel MM, Jester JM, Puttler LI, Glass JM, Adams KM, Fitzgerald HE, Zucker RA. Poor response inhibition as a predictor of problem drinking and illicit drug use in adolescents at risk for alcoholism and other substance use disorders. Journal of the American Academy of Child and Adolescent Psychiatry. 2006;45:468–475. doi: 10.1097/01.chi.0000199028.76452.a9. [DOI] [PubMed] [Google Scholar]
- Nurnberger JI, Wiegand R, Bucholz K, O’Connor S, Meyer ET, Reich T, Rice J, Schuckit M, King L, Petti T, Bierut L, Hinrichs AL, Kuperman S, Hesselbrock V, Porjesz B. A family study of alcohol dependence - Coaggregation of multiple disorders in relatives of alcohol-dependent probands. Archives of General Psychiatry. 2004;61:1246–1256. doi: 10.1001/archpsyc.61.12.1246. [DOI] [PubMed] [Google Scholar]
- O’Connor S, Morzorati S, Christian J, Li TK. Clamping breath alcohol concentration reduces experimental variance: application to the study of acute tolerance to alcohol and alcohol elimination rate. Alcoholism: Clinical and Experimental Research. 1998;22:202–210. [PubMed] [Google Scholar]
- Perry J, Carroll M. The role of impulsive behavior in drug abuse. Psychopharmacology. 2008;200:1–26. doi: 10.1007/s00213-008-1173-0. [DOI] [PubMed] [Google Scholar]
- Quinn PD, Fromme K. Subjective Response to Alcohol Challenge: A Quantitative Review. Alcoholism: Clinical and Experimental Research. 2011;35:1759–1770. doi: 10.1111/j.1530-0277.2011.01521.x. [DOI] [PMC free article] [PubMed] [Google Scholar]
- Ramchandani VA, Bolane J, Li TK, O’Connor S. A physiologically-based pharmacokinetic (PBPK) model for alcohol facilitates rapid BrAC clamping. Alcoholism: Clinical and Experimental Research. 1999;23:617–623. [PubMed] [Google Scholar]
- Rubia K, Smith AB, Brammer MJ, Taylor E. Right inferior prefrontal cortex mediates response inhibition while mesial prefrontal cortex is responsible for error detection. NeuroImage. 2003;20:351–358. doi: 10.1016/s1053-8119(03)00275-1. [DOI] [PubMed] [Google Scholar]
- Saunders JB, Aasland OG, Babor TF, de la Fuente JR, Grant M. Development of the Alcohol Use Disorders Identification Test (AUDIT): WHO Collaborative Project on Early Detection of Persons with Harmful Alcohol Consumption--II. Addiction. 1993;88:791–804. doi: 10.1111/j.1360-0443.1993.tb02093.x. [DOI] [PubMed] [Google Scholar]
- Schuckit MA. Self-Rating of alcohoI intoxication by young men with and without family histories of alcoholism. Journal of Studies on Alcohol. 1980;41:242–249. doi: 10.15288/jsa.1980.41.242. [DOI] [PubMed] [Google Scholar]
- Schuckit MA, Smith TL. The Self-Rating of the Effects of Alcohol (SRE) form as a retrospective measure of the risk for alcoholism. Addiction. 1997;92:979–988. [PubMed] [Google Scholar]
- Schuckit MA, Tapert S, Matthews SC, Paulus MP, Tolentino NJ, Smith TL, Trim RS, Hall S, Simmons A. fMRI Differences Between Subjects with Low and High Responses to Alcohol During a Stop Signal Task. Alcoholism: Clinical and Experimental Research. 2012;36:130–140. doi: 10.1111/j.1530-0277.2011.01590.x. [DOI] [PMC free article] [PubMed] [Google Scholar]
- Schweinsburg AD, Paulus MP, Barlett VC, Killeen LA, Caldwell LC, Pulido CARM, Brown SA, Tapert SF. An fMRI Study of Response Inhibition in Youths with a Family History of Alcoholism. Annals of the New York Academy of Sciences. 2004;1021:391–394. doi: 10.1196/annals.1308.050. [DOI] [PubMed] [Google Scholar]
- Seifritz E, Bilecen D, Hänggi D, Haselhorst R, Radn EW, Wetzel S, Seelig J, Scheffler K. Effect of ethanol on BOLD response to acoustic stimulation: implications for neuropharmacological fMRI. Psychiatry Research: Neuroimaging. 2000;99:1–13. doi: 10.1016/s0925-4927(00)00054-8. [DOI] [PubMed] [Google Scholar]
- Sobell MB, Sobell LC, Klajner F, Pavan D, Basian E. The reliability of a timeline method for assessing normal drinker college students’ recent drinking history: utility for alcohol research. Addictive Behaviors. 1986;11:149–161. doi: 10.1016/0306-4603(86)90040-7. [DOI] [PubMed] [Google Scholar]
- Tapert SF, Cheung EH, Brown GG, Frank LR, Paulus MP, Schweinsburg AD, Meloy MJ, Brown SA. Neural response to alcohol stimuli in adolescents with alcohol use disorder. Arch Gen Psychiatry. 2003;60:727–735. doi: 10.1001/archpsyc.60.7.727. [DOI] [PubMed] [Google Scholar]
- Villafuerte S, Heitzeg MM, Foley S, Wendy Yau WY, Majczenko K, Zubieta JK, Zucker RA, Burmeister M. Impulsiveness and insula activation during reward anticipation are associated with genetic variants in GABRA2 in a family sample enriched for alcoholism. Mol Psychiatry. 2012;17:511–519. doi: 10.1038/mp.2011.33. [DOI] [PMC free article] [PubMed] [Google Scholar]
- Vogel-Sprott M, Sdao-Jarvie K. Learning alcohol tolerance: the contribution of response expectancies. Psychopharmacology. 1989;98:289–296. doi: 10.1007/BF00451677. [DOI] [PubMed] [Google Scholar]
- Wang J, Licht DJ, Jahng GH, Liu CS, Rubin JT, Haselgrove J, Zimmerman RA, Detre JA. Pediatric perfusion imaging using pulsed arterial spin labeling. Journal of Magnetic Resonance Imaging. 2003;18:404–413. doi: 10.1002/jmri.10372. [DOI] [PubMed] [Google Scholar]
- Wang Y, Saykin AJ, Pfeuffer J, Lin C, Mosier KM, Shen L, Kim S, Hutchins GD. Regional reproducibility of pulsed arterial spin labeling perfusion imaging at 3T. NeuroImage. 2011;54:1188–1195. doi: 10.1016/j.neuroimage.2010.08.043. [DOI] [PMC free article] [PubMed] [Google Scholar]
- Weafer J, Fillmore M. Individual differences in acute alcohol impairment of inhibitory control predict ad libitum alcohol consumption. Psychopharmacology. 2008;201:315–324. doi: 10.1007/s00213-008-1284-7. [DOI] [PMC free article] [PubMed] [Google Scholar]
- Whelan R, Conrod PJ, Poline JB, Lourdusamy A, Banaschewski T, Barker GJ, Bellgrove MA, Buchel C, Byrne M, Cummins TDR, Fauth-Buhler M, Flor H, Gallinat J, Heinz A, Ittermann B, Mann K, Martinot JL, Lalor EC, Lathrop M, Loth E, Nees F, Paus T, Rietschel M, Smolka MN, Spanagel R, Stephens DN, Struve M, Thyreau B, Vollstaedt-Klein S, Robbins TW, Schumann G, Garavan H. Adolescent impulsivity phenotypes characterized by distinct brain networks. Nature Neuroscience. 2012;15:925. doi: 10.1038/nn.3092. [DOI] [PubMed] [Google Scholar]
- Xue G, Aron AR, Poldrack RA. Common Neural Substrates for Inhibition of Spoken and Manual Responses. Cerebral Cortex. 2008;18:1923–1932. doi: 10.1093/cercor/bhm220. [DOI] [PubMed] [Google Scholar]
- Zhang S, Li CS. Functional networks for cognitive control in a stop signal task: Independent component analysis. Human Brain Mapping. 2012;33:89–104. doi: 10.1002/hbm.21197. [DOI] [PMC free article] [PubMed] [Google Scholar]
Associated Data
This section collects any data citations, data availability statements, or supplementary materials included in this article.