

SUMMARY
The role of caveolin-1 (CAV1) in cancer is highly controversial. CAV1 suppresses genes that favor tumor development, yet also promotes focal adhesion turnover and migration of metastatic cells. How these contrasting observations relate to CAV1 function in vivo is unclear. Our previous studies implicate E-cadherin in CAV1-dependent tumor suppression. Here we use murine melanoma B16F10 cells, with low levels of endogenous CAV1 and E-cadherin, to unravel how CAV1 affects tumor growth and metastasis, and to assess how co-expression of E-cadherin modulates CAV1 function in vivo in C57BL/6 mice. We find that overexpression of CAV1 in B16F10(cav-1) cells reduces subcutaneous tumor formation, but enhances metastasis relative to control cells. Furthermore, E-cadherin expression in B16F10(E-cad) cells reduces subcutaneous tumor formation, and lung metastasis when intravenously injected. Importantly, co-expression of CAV1 and E-cadherin in B16F10(cav1/E-cad) cells abolishes tumor formation, lung metastasis, increased Rac-1 activity and cell migration observed with B16F10(cav-1) cells. Finally, consistent with the notion that CAV1 participates in switching human melanomas to a more malignant phenotype, elevated levels of CAV1 expression correlated with enhanced migration and Rac-1 activation in these cells.
Keywords: E-cadherin, molecular switch, CAV1, tumour suppression, metastasis, melanoma model
INTRODUCTION
Caveolin-1 (CAV1) is one of three members of the caveolin family of proteins expressed by mammalian cells: CAV1 and CAV2 are found in a wide range of cells and tissues, whereas expression of CAV3 is restricted to muscle and glial cells (Quest et al., 2008). CAV1 is the predominantly studied isoform in cancer. Reports that levels of CAV1 mRNA and protein are down-regulated in oncogene-transformed cultured fibroblasts (Koleske et al., 1995), and that re-expression of CAV1 blocks transformation (Engelman et al., 1997), led to the conclusion that CAV1 functions as a tumor suppressor. Levels of CAV1 are also reduced in several human tumors (Bender et al., 2000; Wiechen et al., 2001) and again, in these cells, CAV1 re-expression is often sufficient to block functions associated with the transformed cell phenotype (Bender et al., 2002; Bender et al., 2000; Wiechen et al., 2001). Furthermore, selective loss of CAV1 achieved with use of antisense oligonucleotides is sufficient to transform NIH3T3 cells (Engelman et al., 1997). And CAV1 knockout mice exhibit increased angiogenesis, predisposition to mammary cancer, carcinogen-induced skin hyperplasia, and tumor formation, underscoring a role for CAV1 in tumor suppression (Capozza et al., 2003; Lin et al., 2007).
Many potential downstream targets are associated with CAV1-mediated tumor suppression (reviewed in (Quest et al., 2008; Quest et al., 2004). Results from our laboratory show that CAV1 reduces expression of the apoptosis inhibitor survivin (also referred to as BIRC5) and of cyclo-oxygenase-2 (COX2), two proteins that normally favor tumor cell survival (Rodriguez et al., 2009; Torres et al., 2007). Reduction of these two factors is linked to sequestration of β-catenin to the plasma membrane and inhibition of β-catenin /Tcf-Lef-dependent transcription of the survivin and COX2 genes. Moreover, in HT29(US) colon cancer cells and in B16F10 melanoma cells, E-cadherin is required for CAV1-mediated suppression of survivin and COX2. Collectively, these findings suggest that the function of CAV1 varies in a cell context-dependent manner (Torres et al., 2007); this conclusion is particularly significant given that CAV1 is also associated with enhanced tumor cell malignancy, and particularly with metastatic spread (discussed in (Quest et al., 2008; Quest et al., 2004)).
In contrast to the above observations, the presence of CAV1 reportedly also promotes more aggressive traits in a variety of tumor cells and in patients, and is associated with increased metastasis, multi-drug resistance, and poorer prognosis (Ando et al., 2007; Du et al., 2009; Savage et al., 2007; Tirado et al., 2010). For example, CAV1 is not expressed in normal prostate tissue, but its levels increase upon formation and metastatic progression of prostate tumors (Bartz et al., 2008; Tahir et al., 2008; Watanabe et al., 2009). In breast cancer cells, CAV1 expression promotes multi-drug resistance (Lavie et al., 1998) and anchorage-independent growth (Ravid et al., 2008), and CAV1 up-regulation in human melanoma is correlated with disease progression (Felicetti et al., 2009). Finally, CAV1 promotes focal adhesion turnover, activation of Rac-1, and migration of metastatic melanoma as well as breast cancer cells (Urra et al., 2012).
Given the functional dichotomy of CAV1 in cancer, the issue of which factors are responsible for such dramatic variability in activity has yet to be addressed. Of interest in this context are our previous findings that establish a connection between CAV1 and E-cadherin, especially considering that loss of E-cadherin is often linked to metastasis (Wendt et al., 2011), and in melanoma, such loss is also associated with poor patient prognosis (Gray-Schopfer et al., 2007; Molina-Ortiz et al., 2009; Wu et al., 2008). During tumor progression, E-cadherin is frequently replaced by N-cadherin, which promotes cell migration (Maret et al., 2010) and augments the metastatic potential of melanomas (Augustine et al., 2008; Kreizenbeck et al., 2008). And lastly, re-expression of E-cadherin inhibits migration of melanoma cells and their dissemination from the original tumor location to other organs (Molina-Ortiz et al., 2009; Wu et al., 2008).
Our earlier work has identified CAV1 as a potent negative regulator of genes whose expression favors the development and progression of tumors, but this result holds true only in cell lines that co-express CAV1 and E-cadherin. We have developed an experimental system in which both functions traits of CAV1 can be observed in vivo, and here we use this system to ask how the presence of E-cadherin modulates these functions of CAV1. Melanomas are particularly useful for studying tumor formation and host properties associated with metastasis: due to their high melanin pigment content, melanomas generate well-defined subcutaneous tumors, as well as easily detectable metastatic tumors. Bearing in mind the importance of E-cadherin in melanoma development, we undertook an evaluation of the extent to which the presence of E-cadherin modulates CAV1 function in vivo.
RESULTS
Overexpression of CAV1 in B16F10 cells suppresses subcutaneous tumor growth
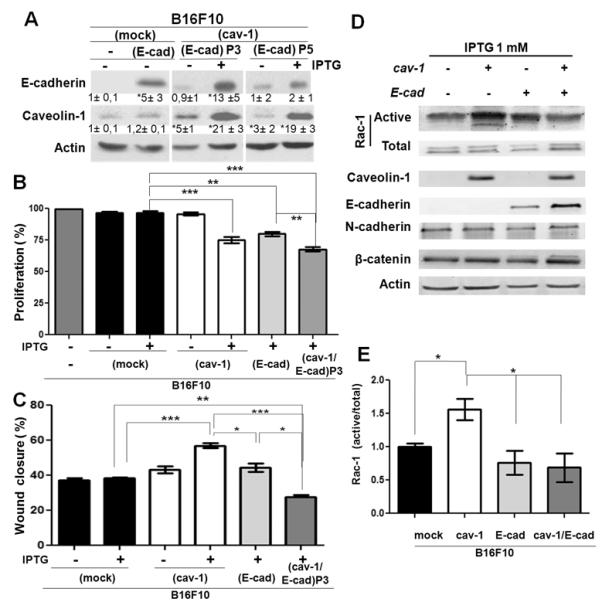
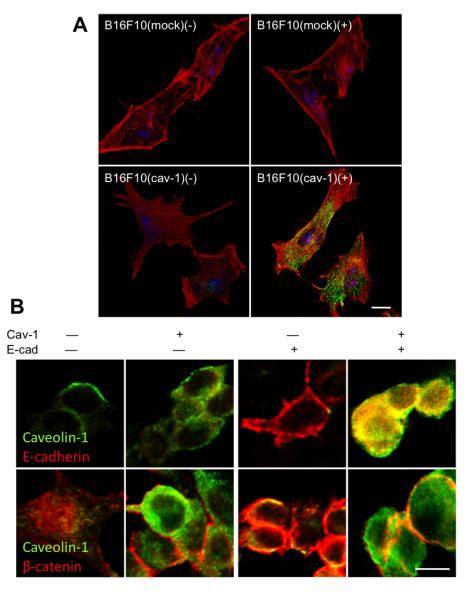
To explore the mechanisms underlying the ambiguity in the function of CAV1, we stably transfected B16F10 cells with either the IPTG-inducible control vector pLacIOP, or with pLacIOP-encoding CAV1 (pLacIOPcav-1), to yield B16F10(mock) and B16F10(cav-1) cells, respectively. For B16F10(cav-1) cells, levels of CAV1 expression were higher, both in the absence and presence of IPTG, compared with B16F10(mock) controls (P<0.05, Figure 1A). In B16F10(cav-1) cells, CAV1 was present at various locations, including the plasma membrane, cytoplasm and Golgi (Figure S1), as also described for other cells (Li et al., 2001). We evaluated the time course of tumor formation subsequent to subcutaneous injections of these melanoma cells in mice (Figure 1B, 1C). Tumor formation was delayed with use of B16F10(cav-1) cells (Figure 1D) and tumors were significantly smaller on day 15 post-injection (P<0.001), compared to animals injected with B16F10(mock) cells. We found no differences between B16F10 wild type and B16F10(mock) cells in terms of their ability to form subcutaneous tumors (Figure S2). Hence, CAV1 clearly displays tumor suppressor activity when B16F10 cells are used in an in vivo setting.
Figure 1.

Tumor formation by a clonal population of B16F10(cav-1) cells
The above results for B16F10 cells were obtained with use of batch-transfected cells, which represent a mix of sub-populations that display varying levels of CAV1 expression. To evaluate the outcome of homogeneous CAV1 expression in melanomas, we isolated and characterized clonal populations of CAV1-expressing cells. Figure 1 shows results for cells of clone 3, in which levels of expression of CAV1 are lower than for B16F10(cav-1) cells, but are significantly higher than for control cells (P<0.05, Figure 1A): tumor formation was delayed with use of clone 3 cells (Figure 1E) and tumor volumes on day 15 were significantly smaller (P<0.001, Figure 1F) compared to B16F10(mock) cells. These observations demonstrate that CAV1 functions as a tumor suppressor when B16F10(cav-1) cells are injected subcutaneously, irrespective of whether the injected cells are heterogeneous or homogeneous in terms of CAV1 expression.
Enhanced lung metastasis by B16F10 cells overexpressing CAV1
We next evaluated the metastatic potential of intravenously injected batch-transfected and clonal (Figure 2) B16F10(cav-1) cells. Time course experiments show that B16F10(cav-1) cells metastasized to the lung more readily than did B16F10(mock) cells (Figure S3); CAV1 expression led to metastases that evolved mostly from within the lung, often filled the entire lung parenchyma from one side to the other, and occupied a large amount of parenchymal space (Figure S4). Thus, rather than evaluating the appearance of surface nodules, we recorded the mass of metastasized black lung tumors at 15–21 days after intravenous injection (Figure 2A), and selected the tumor mass on day 21 for subsequent comparison (Figure 2B). On day 21, the percentage of lung tumor mass in C57BL/6 mice resulting from use of B16F10(mock) and B16F10(cav-1) cells was 9 and 30 %, respectively (P<0.001, Figure 2C). No significant differences were detected in mice injected with B16F10 wild type and B16F10(mock) cells (Figure S5). However, analysis of metastases following intravenous injection of B16F10(cav-1) clone 3 cells revealed highly significant differences between lung metastases promoted by the presence of CAV1 (Figure 2D) relative to controls on day 21 (P<0.001, Figure 2E). Collectively, these results demonstrate that CAV1 expression in B16F10 cells promotes lung metastasis in vivo following intravenous injection.
Figure 2.

Transfection with an E-cadherin-encoding plasmid
As discussed above, we have identified CAV1 as an important negative regulator of β-catenin/Tcf-Lef-dependent transcription of the survivin and COX2 genes; however, CAV1 only displays this ability in cells that also express E-cadherin (Rodriguez et al., 2009; Torres et al., 2007). We thus explored whether the requirement for E-cadherin also holds true with regard to the ability of this aggressive tumor cell line to form subcutaneous tumors, or metastasize to the lung. B16F10(mock) and B16F10(cav-1) cells were stably transfected with the E-cadherin-encoding pBATEM2 plasmid, in order to generate the B16F10(E-cad) and B16F10(cav-1/E-cad) cell lines, respectively. Because pBATEM2 does not include a resistance marker that permits selection, cells were co-transfected with pcDNA3.1, a vector that confers resistance to G418. Western blots revealed a 5-fold (5 ± 3 with respect to B16F10(mock)) increase in levels of E-cadherin in B16F10(E-cad) cells, and up to 13-fold (13 ± 3) higher levels of E-cadherin in B16F10(cav-1/E-cad) cells (Figure 3A). Because of the effect of co-expression of both proteins on cell proliferation (Figure 3B), the presence of E-cadherin decreased markedly over time (compare passage 3 and passage 5 cells in Figure 3A), and declined to background levels after 10 passages (data not shown). We thus used only passage 3 or passage 5 cells in our experiments. Also, because metastasis is associated with changes in cell migration, we employed a wound closure assay to assess cell migration in these cells. While expression of CAV1 augmented cell migration, co-expression of the two proteins led to a substantial reduction in the migration of B16F10(cav-1/E-cad) cells with respect to B16F10(mock) cells (Figure 3C). Finally, with regard to our previous observation that expression of CAV1 increases Rac-1 activation in B16F10 cells (Urra et al., 2012), here we noted that Rac-1 activation triggered by Cav-1 was suppressed in the presence of E-cadherin (Figure 3D, 3E).
Figure 3.
Localization of β-catenin, E-cadherin and CAV1 in B16F10 cells
Our previous studies in colon cancer cells highlight that the ability of CAV1 to regulate survivin in the presence of E-cadherin depends on the capacity of CAV1 to aid in sequestering β-catenin to the plasma membrane (Torres et al., 2007). We thus used indirect immunofluorescence analysis to characterize the intracellular distribution of these participating proteins in B16F10(cav-1), B16(cav-1/E-cad) and B16F10(mock) cells. CAV1 protein was detected at the plasma membrane and also in the cytosolic compartment (Figure 4A). E-cadherin was distributed somewhat diffusely at the plasma membrane and low levels of the protein were also observed in punctuate structures within the cytosol (Fig. 4B). β-catenin was localized to the cell surface, as well as in the cytoplasm of B16F10(mock) cells; however, in the presence of either CAV-1 or E-cadherin, the peripheral distribution of β-catenin at the plasma membrane was somewhat increased. And co-expression of CAV1 and E-cadherin in B16F10(cav-1/E-cad) cells induced an accumulation of β-catenin at the plasma membrane, where it co-localized with CAV1 (Figure 4B). In these cells, CAV1 also colocalized to a significant extent with E-cadherin (Figure 4B).
Figure 4.
Tumor formation by B16F10(mock), B16F10(cav-1), B16F10(E-cad) and B16F10(cav-1/E-cad) cells
Mice were inoculated subcutaneously with B16F10(mock), B16F10(cav-1), B16F10(E-cad) or B16F10(cav-1/E-cad) cells and tumor growth was either evaluated over time (Figure 5A) or tumor volumes were compared on day 15 post-inoculation (Figure 5B). B16F10(cav-1) cells led to tumor volumes that were reduced compared to B16F10(mock) cells (p<0,001) and B16F10(E-cad) cells resulted in tumors that were somewhat smaller than for B16F10(cav-1) cells (p<0,001), while tumor formation was completely suppressed following injection of B16F10(cav-1/E-cad) cells.
Figure 5.
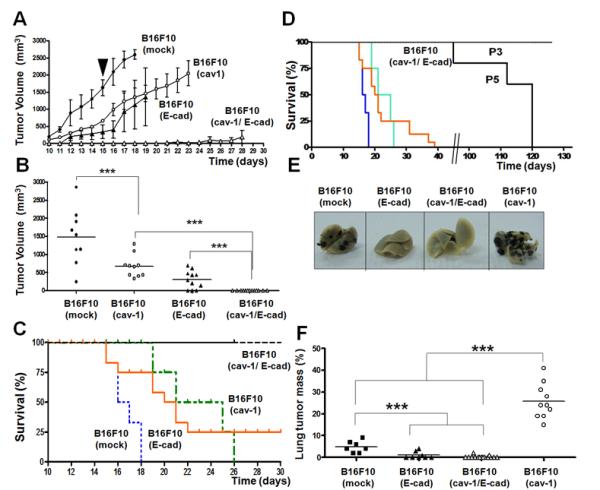
To facilitate comparison of findings across groups, experiments were continued for all animals until tumors reached the bioethically permitted limit of 2500 mm3, at which point animals were killed (Kaplan-Meier survival curves, Figure 5C, 5D). While the mice that were injected with B16F10(mock), B16F10(cav-1) or B16F10(E-cad) had to be sacrificed by days 18, 29 and 36, respectively, those injected with B16F10(cav-1/E-cad) cells survived for considerably longer periods of time (Figure 5C). Mice that were injected with cells that expressed lower levels of E-cadherin (passage 5 cells) survived up to 95 days, while none of the mice that were injected with passage 3 cells had reached the permitted limit even at 130 days post-injection (Figure 5D). These results show that CAV1 and E-cadherin cooperate in suppressing tumor formation by B16F10 cells, and that the extent of synergy observed for these two proteins depends on the expression levels of E-cadherin.
Metastasis of B16F10(mock), B16F10(cav-1), B16F10(E-cad) and B16F10(cav-1/E-cad) cells
In the assays that follow, we have evaluated how the presence of E-cadherin affects metastasis of B16F10 cells to the lung. For these experiments, the B16F10(cav-1/E-cad) cells we used were from passage 3 (Figure 5E, 5F). As above, metastasis of B16F10(cav-1) cells on day 21 was significantly elevated with respect to that of B16F10(mock) cells (p<0,001); however, use of B16F10(E-cad) and B16F10(cav-1/E-cad) cells was associated with substantially lower metastases than for B16F10(mock) cells (P<0.001). Thus, in the presence of E-cadherin, the ability of CAV1 to promote B16F10 migration in vitro is diminished (Figure 3C), and metastasis to the lung is completely abolished (Figure 5E, 5F).
Gene expression profiles for cells that constitute proliferative versus invasive melanomas
To account for the heterogeneity of melanoma cells in tumours, and to explain the rapid progression of disease to a highly aggressive state, a phenotype-switching model has recently been proposed. Rather than invoking a series of mutations followed by selection, as in the model wherein tumors progress linearly towards an increasingly aggressive phenotype, the phenotype-switching model suggests that, in response to environmental cues, cells switch back and forth between two main states: these states are characterized in vitro by the strong proliferation/weak invasiveness of cells (proliferative phenotype), or by their weak proliferation/strong invasiveness (invasive phenotype) (Hoek et al., 2008; Hoek and Goding, 2010). This model was most recently exploited to develop a gene expression-based tool referred to as Heuristic Online Phenotype Prediction, which can be applied to predict phenotype. The utility of this tool has been validated by showing that of the 536 lines analyzed, almost 90% fall within the two categories described (Widmer et al., 2012a). Using the available database, we compared gene expression for CAV1, E-cadherin, N-cadherin, COX2 and survivin in proliferative and invasive melanoma cell phenotypes (Figure 6): this was accomplished either by depicting levels of gene expression in all cell lines that were analyzed (Figure 6A), or by averaging the gene expression values for all lines assigned to a given phenotype (Figure 6B and Supplementary data file).
Figure 6.

As expected from published reports, E-cadherin levels were reduced, while N-cadherin levels were elevated, in melanoma cell lines that display the invasive phenotype. CAV1 levels followed the same pattern observed for N-cadherin: both were elevated in the invasive group. However, for the survivin (BIRC5) and COX2 genes, which are frequently upregulated in cancer and are implicated in promoting metastasis (Kang et al., 2011; Mehrotra et al., 2010; Singh et al., 2007), no differences in expression levels were detected between melanoma cells that led to proliferative and to invasive phenotypes (Figure 6A, 6B and Supplementary data file).
Expression of E-cadherin, N-cadherin and CAV1 during the development and progression of melanoma
We also evaluated the expression levels for E-cadherin, N-cadherin and CAV1 in a limited number of cell lines that are derived from primary melanocytes, horizontal and vertical growth phase, as well as metastatic melanomas. In melanocytes, E-cadherin was readily detectable during the early phase of the melanoma, but then disappeared with disease progression and was replaced by N-cadherin. We also observed very substantial increases in levels of CAV1, particularly in cells derived from metastatic melanomas (Figure 6C). Thus in melanoma development, the well established E-cadherin/N-cadherin “switch” associated with malignant progression (Margineanu et al., 2008) coincides with augmented CAV1 expression.
We characterized additional melanoma lines from ATCC that fell into either the low (SKMEL2, 28) or high (A375M) metastatic categories. E-cadherin expression was readily detected in the first group but not in the second, while CAV1 was only detected in A375 cells, wherein N-cadherin levels were also elevated (Figure 7A). Consistent with these findings, a wound-healing assay used with SKEMEL2 and SKEMEL28 cells revealed migration to be about 5-fold lower than for A375 wildtype (−) or A375M(mock) cells. Migration of A375M(cav-1) cells, which expressed higher levels of CAV1, was even faster (Figure 7B). Results were essentially similar when cell migration was assessed in transwell assays (Figure 7C). Thus, expression of CAV1 in SKMEL2 and SKEMEL28 cells did not favor migration, but did lead to substantially lower levels of survivin protein, and an increase of about 70% in cell death (supplementary Figure S6A, S6B).
Figure 7.
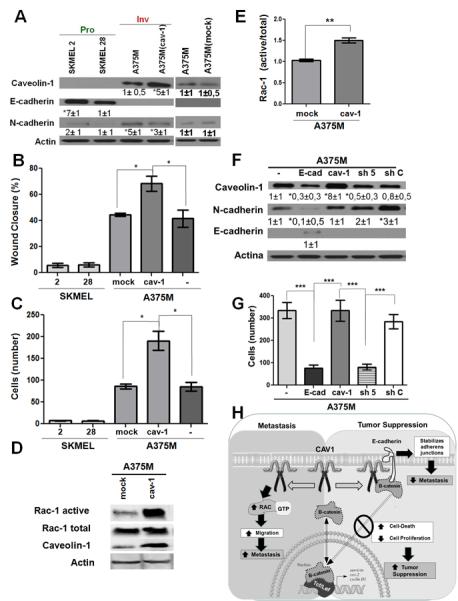
Pull-down assays showed that augmented CAV1 expression in human melanoma A375M(cav-1) cells that lack E-cadherin coincides with enhanced Rac-1 activity (Figure 7D, 7E), as also observed in the murine B16F10 cell model (see Fig. 3D, 3E). In A375M wild type cells, expression of E-cadherin induced by transfection with pBATEM2 reduced levels of expression of CAV1 and N-cadherin (Figure 7F), and also reduced the invasive capacity of these cells (Figure 7G). Increasing the expression of CAV1 in the cells by transfection with placIOP(cav-1) (Figure 7F), had no notable effect on invasiveness (Figure 7G), which suggests that the existing CAV1 levels in A375M cells were sufficient to ensure maximal migration in this assay. On the other hand, use of shRNA (sh5) against to CAV1 decreased CAV1 levels (relative to wild type cells) by at least two-fold (Figure 7F) and substantially reduced transmigration of these cells; this was not the case for shC-treated control cells (Figure 7G). Note that E-cadherin expression in A375M(cav-1) increased cell death to 65%, which correlated with significant decreases in levels of survivin protein (supplementary Figure S6C, S6D).
DISCUSSION
A dual role of CAV1 in melanomas
CAV1 reportedly functions as a tumor suppressor, and yet also promotes metastasis (Quest et al., 2008; Quest et al., 2004). A fundamental problem with published studies on the role of CAV1 is the use of different experimental settings and cellular models, or analyses of distinct stages of tumor progression, which make direct comparison of findings from different labs difficult. We argue that an experimental approach that permits evaluation of both types of functions in the same in vivo model would greatly facilitate an understanding of the features of CAV1 that contribute to one or the other function. Here we have used a pre-clinical melanoma model (B16F10) to show that CAV1 functions as a tumor suppressor and also promotes metastasis. Importantly, we show that the ability of CAV1 to promote metastasis is abolished by the presence of E-cadherin, thus identifying E-cadherin as a critical modulator of these traits in vivo. Coincident with these findings, we report that in a large number of metastatic melanoma cell lines, levels of CAV1 and N-cadherin are elevated, in combination with reduced expression of E-cadherin: we thus conclude that enhancing CAV1 in the absence of E-cadherin is a necessary part of the molecular “switch” needed to trigger the transition from a proliferating to an invasive melanoma phenotype.
CAV1 as a tumor suppressor
Consistent with its role as a tumor suppressor, CAV1 expression is reduced in a number of human tumors, and with re-expression of CAV1, cells lose various traits that are associated with the transformed phenotype (see Introduction). Several mechanisms have been proposed to explain this ability of CAV1. For example, over-expression of CAV1 may inhibit cellular proliferation and trigger cell cycle arrest. Alternatively, CAV1 sensitizes HEK293T, fibrosarcoma L929, and HeLa cells to different cytotoxic drugs, such as staurosporine and arsenate via activation of the PI3K/Akt pathway. Also, CAV1 promotes caspase-3 activation and down regulates the inhibitor of apoptosis protein (IAP) survivin, and may thereby augment susceptibility to apoptosis, possibly via a caspase-9-dependent mechanism. Moreover, tyrosine phosphorylation of CAV1 sensitizes MCF7 breast cancer cells to paclitaxel-induced apoptosis, by inactivating Bcl-2 and increasing mitochondrial permeability. Taken together, these results point to the possibility that CAV1 acts as a tumor suppressor by activating the intrinsic cell death pathway (Quest et al., 2013).
We have also shown that CAV1 regulates the expression of survivin/COX2 in cancer cells by sequestering β-catenin to the plasma membrane, in a manner that is dependent on the presence of E-cadherin (Rodriguez et al., 2009; Torres et al., 2007; Torres et al., 2006). Note that E-cadherin is silenced in melanoma cells, thus likely contributing to melanoma progression and metastasis (Larue and Delmas, 2006). B16F10 cells also do not express E-cadherin, and in fact, re-expression of E-cadherin in B16F10 cells restores the ability of CAV1 to suppress survivin and COX2 expression, as well as to promote cell death in vitro (Rodriguez et al., 2009; Torres et al., 2007). Consistent with our working model (which was largely based on observations made on colon cancer cells), expression of CAV1 and E-cadherin in B16F10 cells results in co-localization of CAV1 with E-cadherin as well as β-catenin at the cell surface (Figure 4B). Moreover, the simultaneous presence of CAV1 and E-cadherin reduces cell proliferation (Figure 3B), increases cell death ((Torres et al., 2007); also, data not shown), and abolishes subcutaneous tumor growth. As a result, the survival rate of the mice is also markedly enhanced (Figure 5).
For cells that are injected subcutaneously, CAV1 also functions as a tumor suppressor in the absence of E-cadherin, albeit less effectively. Note, however, that no increases in E-cadherin expression are detected in melanoma cells isolated from these subcutaneous tumors (ex tumour cells, data not shown). These observations indicate that E-cadherin-independent pathways are also relevant for CAV1-mediated tumor suppression in this model. Studies under way in our laboratory are aimed at identifying such alternative mechanisms: we are considering the possibility that other cadherins can substitute for E-cadherin.
The E-cadherin/N-cadherin switch
In melanoma, loss of E-cadherin, and the “switch” to N-cadherin, both correlated with disease progression, epithelial-mesenchymal transition (EMT), poor patient prognosis (Gray-Schopfer et al., 2007; Kreizenbeck et al., 2008; Molina-Ortiz et al., 2009), and are also associated with enhanced migration of tumor cells (Li et al., 2001; Maret et al., 2010) as well as metastatic potential (Augustine et al., 2008; Kreizenbeck et al., 2008). On the other hand, re-introduction of E-cadherin into melanomas reduces cell migration as well as metastases (Molina-Ortiz et al., 2009; Wu et al., 2008). A comparison of the gene profiles of melanoma cell lines that exhibit strong proliferation/weak metastasis, versus those that display weak proliferation/strong metastasis, supports these findings: increased N-cadherin and reduced E-cadherin are consistently associated with the metastatic phenotype. Gene profiling (Figure 6A, 6B and Supplementary data file) and Western blot (Figure 6C) analyses also reveal increased CAV1 expression in metastatic human melanomas. And finally, the cadherin “switch” is recapitulated to some extent in vitro in A375M cells, wherein transfection with pBATEM2 and expression of E-cadherin significantly decreases levels of N-cadherin and invasiveness (Figure 7F, 7G).
Re-expression of E-cadherin in B16F10 melanoma cells greatly enhanced the ability of CAV1 to suppress subcutaneous tumor growth, abolished its capacity for promoting metastasis (Figure 5), and blocked the CAV1-induced increase in cell migration in vitro (Figure 3). Thus, although B16F10 cells express considerable amounts of N-cadherin (data not shown), it is unlikely that the presence of this protein contributes to CAV1-mediated tumor suppression, since survivin downregulation is only detected when CAV1 and E-cadherin are co-expressed (Torres et al., 2007; and data not shown). In particular, note that co-expression of CAV1 and E-cadherin increases cell death in B16F10 cells (Torres et al., 2007 and data not shown); likewise, expression of E-cadherin in A375M cells with endogenous CAV1 (supplementary Figure S6C, S6D), or introduction of CAV1 into SKMEL cells that express endogenous E-cadherin (Supplementary Figure S6A, S6B), greatly reduces cell viability and levels of survivin protein.
N-cadherin may also collaborate with CAV1 in promoting lung metastasis. Indeed, we found that Rac-1 activity was enhanced in B16F10 in the presence of CAV1 (Fig. 3D, 3E). These observations link CAV11-enhanced migration in vitro and metastasis in vivo to the activation of Rac-1 in mouse melanomas. To what extent this holds true for other cancer models merits further investigation.
The role of CAV1 in invasion/metastasis
A recent report links CAV1 expression to increased metastatic potential in a variety of human melanoma cell lines (Felicetti et al., 2009), while another indicates that CAV1 blocks metastasis of B16F10 melanomas (Trimmer et al., 2010). Our results with B16F10 cells support the former observation – namely that CAV1 expression enhances the metastatic potential of the melanoma cells. The reason(s) for this discrepancy in findings is not clear. However, our experimental observations are congruent with those obtained by expression profiling analysis (Figures 6A, 6B and Supplementary data file), which document that the enhanced invasive potential of melanoma cells correlates with elevated CAV1 expression in a large number of melanoma lines. Also in keeping with this notion is our observation that increased CAV1 expression in A375M cells favors migration in wound healing and transmigration assays (Figures 7A, 7B, 7C), while reduced endogenous CAV1 expression decreases the invasive capacity of the same cells (Figures 7F, 7G). Thus, our working hypothesis (which was established in a preclinical murine model) is supported by our data on human melanoma cells, and links higher levels of CAV1 expression in the absence of E-cadherin to augmented 2D and 3D migration of tumor cells, as well as to activation of Rac-1 in vitro (Figure 7D, 7E).
Enhanced migration and metastasis due to CAV1 are abolished by the presence of E-cadherin
Metastasis is a complex, multi-step process that involves local invasion, intravasation, survival in the circulation, extravasation and colonization of new tissue. For each type of cancer, these events occur with distinct kinetics, and affect different organ sites. Organ specificity is determined by the expression of unique factors that promote extravasation and colonization of the secondary site once cells have disseminated from a primary tumor (Nguyen et al., 2009). When B16F10 cells were injected subcutaneously in our experiments, no metastasis is observed (data not shown), which suggests that CAV1 does not participate in the initial steps, including local invasion and intravasation: these early events may thus be rate-limiting in metastasis (Podsypanina et al., 2008).
Greater metastatic potential is frequently associated with enhanced migratory capacity of cells; a number of reports suggest that CAV1 expression favors migration. However, these data are controversial. Some cells require CAV1 for efficient polarization of cellular components and migration in 2D and 3D (Sun et al., 2009). Our studies also favor the notion that CAV1 promotes migration of B16F10 cells by enhancing the turnover of focal adhesions and activation of Rac-1 (Urra et al., 2012). Consistent with this, we show that B16F10(cav-1) cells migrate more rapidly than B16F10(mock) cells in a wound healing assay (Figure 3C), and importantly, this ability of CAV1 is diminished in the presence of E-cadherin. Thus, the enhanced metastasis to the lung in vivo, triggered by the presence of CAV1 in B16F10(cav-1) cells, correlates with a higher velocity of migration in vitro, and both are substantially reduced in the presence of E-cadherin (Figure 3C; Figure 7).
A limited number of proteins display ambiguous roles in cancer
The markedly distinct functions of CAV1 observed in the same experimental model may appear to be perplexing; however, proteins that have a dual function in cancer have been described. For example, Wnt5A (Nishita et al., 2010), the Wilms tumor 1 (WT1) protein (Yang et al., 2007), the β-ZIP transcription factor Maf (Pouponnot et al., 2006), Semaphorin 3E and its receptor Plexin D1 (Casazza et al., 2010), the death receptor Fas (Chen et al., 2010), and the scaffold protein Sprouty-2 (Holgren et al., 2010; Barbachano et al., 2010) all display more than one trait. CAV1 joins this select group of proteins with dual function.
Conclusions
Our earlier studies showed that, in the presence of E-cadherin, CAV1 recruits β-catenin to the plasma membrane, and that this recruitment coinicides with reinstatement of CAV1-dependent regulation of survivin and COX-2 expression in tumor cells (Rodriguez et al., 2009; Torres et al., 2007). In cultured B16F10 melanoma cells, co-expression of CAV1 and E-cadherin reduces proliferation and enhances apoptosis (Torres et al., 2007). The results presented here corroborate the hypothesis that these mechanisms are also relevant in vivo and that the functioning of CAV1 as a tumor suppressor is explained, at least in part, by this mechanism (see Figure 7H). Our data also provide direct evidence that E-cadherin and CAV1 synergize in tumor suppression. We also show that (at least to some extent) CAV1 can also function as a tumor suppressor independent of E-cadherin. Most significantly, CAV1 promotes metastasis upon intravenous injection of melanoma cells, and this ability is completely quenched when E-cadherin is co-expressed with CAV1. These findings provide experimental support for a novel concept whereby E-cadherin not only promotes the tumor suppressor role of CAV1, but it also blocks the ability of CAV1 to develop malignant traits associated with enhanced metastasis; in doing so, the presence or absence of E-cadherin is identified here as a critical molecular “switch” that drives CAV1 function in vivo. Consistent with this model, gene profiling data from a large number of melanoma cell lines links the reductions in E-cadherin and increases in CAV1 expression with a transition of the melanoma to a metastatic phenotype. Moreover, the expression of CAV1 elevates Rac-1 activity, migration, and the invasive capacity of human melanoma cells that lack E-cadherin, while expression of CAV1 in the presence of E-cadherin reduces survivin expression and increased cell death. Our proposed working model (Figure 7H), indicates that, in the absence of E-cadherin, CAV1 favours an alternative, yet to be elucidated, signalling pathway that leads to Rac-1 activation. Finally, our data indicate that therapeutic approaches which lead to combined increases in E-cadherin as well as CAV1 expression should be highly beneficial in melanoma patients.
MATERIALS AND METHODS
Materials
Polyclonal antibodies to CAV1 and β-catenin, and monoclonal antibodies to E-cadherin, CAV1 and Rac-1 were purchased from Transduction Laboratories (Lexington, KY); polyclonal anti-N-cadherin antibody was from Santa Cruz Biotechnology (Santa Cruz, CA); and rabbit polyclonal anti-human survivin and anti-actin antibodies were from RD systems (Minneapolis, MN) and Sigma (St. Louis, MO), respectively. Goat anti-rabbit immunoglobulin G (IgG) and goat anti-mouse IgG antibodies coupled to horseradish peroxidase were from Bio Rad Laboratories (Hercules, CA) and Sigma, respectively. FITC-conjugated anti-rabbit or anti-mouse IgG (1:200) and Alexa Fluor 546-coupled anti-rabbit IgG were from Molecular Probes (Eugene, OR). Anti-mouse-Cy3-coupled antibodies were from Jackson Immunoresearch Laboratories (West Grove, PA, USA). Anti-Gigantin-1 polyclonal antibody (1:500) was from Covance (Princeton, NJ). Actin was detected by staining cells with rhodamine-coupled phalloidin (1:1000) from Sigma Aldrich (St. Louis, MO). Bicinchoninic acid was from Pierce (Rockford, IL). The EZ-ECL chemiluminescent substrate was from Biological Industries (Kibbutz Beit Haemek, Israel) hygromycin was from Calbiochem (La Jolla, CA), and cell media and antibiotics were from Gibco-BRL (Paisley, Scotland, United Kingdom). Fetal bovine serum (FBS) was from Hyclone (Logan, UT). All other reagents used for immunofluorescence, Western blotting and cell culture were from Sigma or of the highest grade available.
Western blotting
Cells extracts were prepared and separated by sodium dodecyl sulfate-polyacrylamide gel electrophoresis (SDS-PAGE) on 12 % acrylamide minigels (Bio-Rad): 35 –50 μg total protein was loaded per lane and transferred to nitrocellulose. Blots were blocked with 5% milk in 0.1% Tween-phosphate-buffered saline (PBS) and then probed with anti-actin (1:5000), anti-CAV1 (1:3000), anti-E-cadherin (1:3000), anti-Rac-1 (1:3000) or anti-N-cadherin (1:3000) antibodies. For pull-down assays, blots were blocked and probed with anti-Rac-1 (1:3000) antibodies. Bound antibodies were detected with horseradish peroxidase-conjugated secondary antibodies and the enhanced chemiluminescence system EZ-ECL.
Animal studies
Pathogen-free C57BL/6 mice were obtained from the Instituto de Salud Pública (Santiago, Chile) and housed in the animal facility at the Immunology Laboratory, Instituto de Ciencias Biomédicas (ICBM), Universidad de Chile. Mice between 8 to 12 weeks of age and average weight 25 g were used for experiments. All animal procedures were approved by the local bioethics committee (CBA 0271 CMUCH).
Cells and culture conditions
Human melanoma lines obtained from Dr Meenhard Herlyn, Wistar Institute, PA (WM lines) and from Drs I. Hart, G. Moore and P. Parsons were grown in RPMI1640 medium with 10% FBS, 2 mM L-glutamine, 100 U/ml penicillin, 100 μg/ml streptomycin and 10% CO2. Hermes2B immortal human melanocytes were grown as described (Gray-Schopfer et al., 2006). Human melanoma lines (SKMEL2, 28 and A375M) from ATCC were cultured in RPMI1640 medium. B16F10 wildtype cells and cells that were stably transfected with either plasmid (pLacIOP; IPTG inducible expression) alone (B16F10(mock)) or with a CAV1-encoding insert (B16F10(cav-1)) have been described (Torres et al., 2007). Individual clones were obtained with use of cloning rings and selected for resistance to hygromycin (750 μg/ml). All cells were cultured in RPMI supplemented with 10% FBS, 2mmol/L glutamine, and antibiotics (100 U/mL penicillin and 100 μg/mL streptomycin) at 37°C in 5% CO2. A375M cells transfected with pLacIOP and pLacIOP-Cav-1 were selected in hygromycin (750 μg/ml) to generate A375M(mock) and A375M(Cav-1) cells. A375M cells were also transiently transfected for 12 h with pBATEM2, with use of Fugene (Promega, Madison, USA), according to the manufacturer's instructions. Cells were then grown for an additional 36 h in medium without transfection reagent. To reduce endogenous CAV1 expression, we also used Fugene to transiently transfect A375M cells with a short hairpin construct specific for CAV1 (sh5) or with a scrambled control (shC).
Immunofluorescence labeling
Cells grown to confluency on 12 mm coverslips in 24-well plates were fixed at different times for 30 minutes with 4% paraformaldehyde in 100 mM PIPES buffer (pH 6.8) containing 40 mM KOH, 2 mM EGTA and 2 mM MgCl2. Cells were next washed three times with washing solution (50 mM Tris buffer pH 7.6 containing 0.15 M NaCl and 0.1% sodium azide), permeabilized with 0.1% Triton X-100 in washing solution for 10 min, washed twice, and blocked with 1% bovine serum albumin for 60 min. Caveolin-1 distribution was evaluated by staining cells with an anti-caveolin-1 pAb or mAb (1:200), followed by FITC-conjugated anti-rabbit or anti-mouse IgG (1:200). Cells were stained with Rhodamine-coupled phalloidin (1:1000) and DAPI for staining actin and cell nuclei, respectively (see Figure 4A). E-cadherin and β-catenin distribution were determined with use of anti-E-cadherin mAb and anti- β-catenin pAb (both dilution 1:200) followed by anti-mouse-Cy3 and Alexa Fluor 546-coupled anti rabbit IgG (both dilution 1:200), respectively (see Figure 4B). Coverslips were washed and mounted on microscope slides with 10% Mowiol-2.5% 1,4-Diazabicyclo[2.2.2]octane (DABCO); samples were analyzed and documented on a LSM Microsystems Pascal 5 confocal microscope (Carl Zeiss, Thornwood, NY).
B16F10(E-cad) and B16F10(cav-1/E-cad) cells
B16F10(mock) and B16F10(cav-1) cells were cultured as described in 100 mm plates until they reached 60–70% confluency; they were then harvested, resuspended in 1 ml of RPMI medium without serum, and electroporated in the presence of the plasmids pBATEM2 and pcDNA3.1(+) (ratio 1:1, 20 μg total plasmid DNA) at 1600 V and 250 mA as described (Torres et al., 2007). In our case, co-transfection with pcDNA3.1(+) that confers neomycin resistance was necessary to permit subsequent selection, since the pBATEM2 plasmid encoding murine E-cadherin (under the control of an actin promoter), (provided by Amparo Cano, Universidad Autónoma de Madrid, Madrid, Spain), lacks a selection marker. Transfected cells were diluted into RPMI medium with 10% serum and selected in the presence of 1 mg/ml G418 for 3 weeks to yield B16F10(E-cad) and B16F10(cav-1/E-cad) cells.
Proliferation assays
Cells were seeded in 96-well plates at a density of 1×10⁴ cells per well, and incubated for 48 h in the presence of 1 mM IPTG (for B16F10(mock), B16F10(cav-1), B16F10(E-cad) and B16F10(cav-1/E-cad) cells) or in the absence of IPTG (for B16F10 (wild type) cells). Proliferation was measured using the MTS assay according to the manufacturer's instructions.
Wound healing migration assays
B16F10(mock) and B16F10(cav-1) cells were seeded in 24-well plates and grown for 24 h to 70–80% confluency, with or without IPTG (1 mM). Sub-confluent monolayers were wounded with a sterile pipette tip, washed twice with PBS and left in serum-free DMEM medium for 30 minutes (time 0 h). Cells were then stimulated with 3% fetal bovine serum in DMEM medium. Wound closure was monitored by time-lapse recordings on a Carl Zeiss Axiovert-135 microscope coupled to a Nikon Coolpix 995 digital camera. Images were analyzed for void area using NIH ImageJ software. The rate of migration was obtained as the slopes of plots of wound area versus time.
Transwell migration assays
Assays were performed in Boyden Chambers (Transwell Costar, 6.5 mm diameter, 8 μm pore size) as described (Urra et al., 2012). Briefly, the bottom side of each insert was coated with 2 μg/ml fibronectin, cells (5×10⁴) re-suspended in serum-free medium were plated onto the top of each chamber insert, and serum-free medium was added to the bottom chamber. After 2 hours, inserts were removed, washed, and cells that had migrated to the bottom side of the inserts were stained with 0.1% crystal violet in 2% ethanol and counted in an inverted microscope.
Rac-1 Pull-Down Assays
Pull-down assays were performed as described (Urra et al., 2012). Briefly, cells were lysed in a buffer containing 25 mM HEPES, pH 7.4, 100 mM NaCl, 5 mM MgCl2, 1% NP-40, 10% glycerol, 1 mM dithiothreitol, and protease inhibitors. Extracts were clarified by centrifugation (10,000×g for 1 min at 4°C). Supernatants were used immediately for pull-down assays. Glutathione beads had been pre-coated with 50 μg of GST-PAK1 by incubating for 1 h at 4°C on a rotating shaker. Pull-down incubations were carried out by incubating fresh extracts with 50 μl of pre-coated beads for 15 min at 4°C on a rotating shaker. Thereafter, beads were washed three times with lysis buffer containing 0.01% NP-40 and protease inhibitors. Samples were separated by SDS-PAGE (12% acrylamide) and analyzed by Western blotting.
Tumor growth assay
B16F10 cells (3×10⁵) in 100 μl physiological saline (0.9 % NaCl) were injected subcutaneously into the flanks of mice. Appearance of tumors was monitored by palpitation, and was confirmed in initial experiments by histopathological analysis. The largest perpendicular diameters of the resulting tumors were periodically measured and tumor volumes were calculated according to the following formula: width2 × length × π/6 (Current Protocols in Immunology, 2000). In initial experiments, mice were injected simultaneously in the left and right flank with different cell lines (B16F10(mock) and B16F10(cav-1)) (Figure 1). However, due to substantial differences in tumor growth rates, mice were injected with only one cell line for all other experiments. Animals were sacrificed when tumors reached the bioethically permitted limit of 2500 mm3.
Metastasis assay
C57BL/6 mice were injected intravenously with 2×10⁵ B16F10 cells (in 500 μl physiological saline), then sacrificed on post-injection day 21. Lungs were fixed in Feketes solution (Current Protocols in Immunology, 2000), black tissue was separated from the rest of the lung, and weighed. Metastasis was expressed as black tissue mass/total lung mass in percent (%) post-fixation.
Gene expression datasets, describing expression profiling of libraries of melanoma cells
Gene expression data sets were extracted from the NCBI Gene Expression Omnibus (http://www.ncbi.nlm.nih.gov/geo), using the accession numbers GSE4840 (Zurich), GSE4841 (Philadelphia), GSE4843 (Mannheim), GSE7127 (Johansson), GSE8332 (Wagner) and GSE10916 (Augustine). Each dataset was separately normalized using Genespring GX 7.3 (Agilent Technologies), each probe-set value was divided by the 50th percentile of all measurements within a sample and then divided by the median of its values across all samples. Samples were classified according to their melanoma phenotype-specific expression (MPSE) patterns and identified as having proliferative or invasive phenotype signatures (Widmer et al., 2012a). Data for specific genes (CAV1, ECAD, SURVIVIN, COX2, NCAD) were extracted using the Heuristic Online Phenotype Prediction MPSE facility (http://www.jurmo.ch/hopp/hopp_mpse.php) to analyze their expression performance in a phenotype-specific context. All relevant data including the cell lines considered in this analysis is summarized in the Supplementary data file.
Matrigel invasion assay
A375M cells (6×10⁵) were seeded, allowed to grow for 24 h, then serum-starved for 24 or 48 h; 2×10⁵ cells were seeded over 8μm-porous inserts covered with Matrigel (Matrigel Invasion Chamber 8.0 μm, BD Biosciences, Bedford, USA). Inserts were fixed in cold methanol, and immunocytochemistry with specific antibodies was used to detect for the presence of cytokeratin; the membranes were mounted in Mowiol, and observed under a light microscope. At least 10 fields were evaluated (at 40× magnification) to determine the number of cells per field.
Statistical analysis
Quantitative Western blot analysis was used to make statistical comparisons: the Kruskal-Wallis test was used followed by multiple comparison post-tests (Dunn's multiple comparison test). In animal experiments, results were compared using unpaired t-tests on means of three or more independent values (animals), and corroborated with a Duncan test. Phenotype-specific differences in gene expression were assessed using Students t- and Fishers combined probability tests. A value of P<0.05 was considered significant.
Supplementary Material
SIGNIFICANCE.
We show for the first time in a pre-clinical mouse model that CAV1 functions as a tumor suppressor as well as a promoter of metastasis. Moreover, E-cadherin synergizes with CAV1 in suppressing tumor formation and importantly, it blocks the ability of CAV1 to promote migration in vitro and metastasis in vivo, possibly via a Rac-1-dependent mechanism. Thus, E-cadherin is a molecular “switch” that determines whether or not CAV1 will promote B16F10 metastasis. Consistent with these findings, expression profiling analysis of data available for a large number of melanoma lines, as well as specific characterization of a limited number of human melanoma lines associates elevated CAV1, reduced E-cadherin and Rac-1 activation with melanoma transition from a proliferative to an invasive phenotype. These observations reveal a possible connection between CAV1-Rac-1 and metastasis in melanomas, and indicate that therapies that simultaneously increase the expression of CAV1 and E-cadherin in melanoma cells will be of benefit to patients who suffer from this highly aggressive disease.
ACKNOWLEDGEMENTS
Our work was supported by the following awards: Fondecyt-FONDAP 15010006 (to AFGQ), Fondecyt 1090071 (AFGQ), Award 5R03TW007810 from the Fogerty International Center-NIH (LL), Fondecyt 1070699, 1110490 (LL), Iniciative Cientifica Milenio (RCM) P09-015-F (LL), as well as CONICYT PhD fellowships (To LLG and LA), MECESUP PhD fellowships (To LLG and LA). We are very grateful to Dorothy Bennett for careful reading of the manuscript and for generously providing access to protein extracts obtained from human melanoma cell lines. Information concerning these cell lines is available at http://www.sgul.ac.uk/depts/anatomy/pages/Dot/Cell%20bank%20holdings.html. We also acknowledge Arturo Ferreira and Ruth Mora for their help with the animal studies. Results described here were presented in preliminary form at the XXIV Annual Meeting of Chilean Cell Biology Society (November, 2010, Pucón, Chile), the Cell Signaling Networks Meeting (October 2011, Merida, Mexico) and the 2012 Annual ASCB meeting (December 2012, San Francisco, USA).
Footnotes
CONFLICT OF INTEREST
The authors declare no conflict of interest.
REFERENCES
- Ando T, Ishiguro H, Kimura M, Mitsui A, Mori Y, Sugito N, Tomoda K, Mori R, Harada K, Katada T, et al. The overexpression of caveolin-1 and caveolin-2 correlates with a poor prognosis and tumor progression in esophageal squamous cell carcinoma. Oncol Rep. 2007;18:601–9. [PubMed] [Google Scholar]
- Augustine CK, Yoshimoto Y, Gupta M, Zipfel PA, Selim MA, Febbo P, Pendergast AM, Peters WP, Tyler DS. Targeting N-cadherin enhances antitumor activity of cytotoxic therapies in melanoma treatment. Cancer Res. 2008;68:3777–84. doi: 10.1158/0008-5472.CAN-07-5949. [DOI] [PubMed] [Google Scholar]
- Barbachano A, Ordonez-Moran P, Garcia JM, Sanchez A, Pereira F, Larriba MJ, Martinez N, Hernandez J, Landolfi S, Bonilla F, et al. SPROUTY-2 and E-cadherin regulate reciprocally and dictate colon cancer cell tumourigenicity. Oncogene. 2010;29:4800–13. doi: 10.1038/onc.2010.225. [DOI] [PubMed] [Google Scholar]
- Bartz R, Zhou J, Hsieh JT, Ying Y, Li W, Liu P. Caveolin-1 secreting LNCaP cells induce tumor growth of caveolin-1 negative LNCaP cells in vivo. Int J Cancer. 2008;122:520–5. doi: 10.1002/ijc.23142. [DOI] [PubMed] [Google Scholar]
- Bender F, Montoya M, Monardes V, Leyton L, Quest AF. Caveolae and caveolae-like membrane domains in cellular signaling and disease: identification of downstream targets for the tumor suppressor protein caveolin-1. Biol Res. 2002;35:151–67. doi: 10.4067/s0716-97602002000200006. [DOI] [PubMed] [Google Scholar]
- Bender FC, Reymond MA, Bron C, Quest AF. Caveolin-1 levels are down-regulated in human colon tumors, and ectopic expression of caveolin-1 in colon carcinoma cell lines reduces cell tumorigenicity. Cancer Res. 2000;60:5870–8. [PubMed] [Google Scholar]
- Capozza F, Williams TM, Schubert W, Mcclain S, Bouzahzah B, Sotgia F, Lisanti MP. Absence of caveolin-1 sensitizes mouse skin to carcinogen-induced epidermal hyperplasia and tumor formation. Am J Pathol. 2003;162:2029–39. doi: 10.1016/S0002-9440(10)64335-0. [DOI] [PMC free article] [PubMed] [Google Scholar]
- Casazza A, Finisguerra V, Capparuccia L, Camperi A, Swiercz JM, Rizzolio S, Rolny C, Christensen C, Bertotti A, Sarotto I, et al. Sema3E-Plexin D1 signaling drives human cancer cell invasiveness and metastatic spreading in mice. J Clin Invest. 2010;120:2684–98. doi: 10.1172/JCI42118. [DOI] [PMC free article] [PubMed] [Google Scholar]
- Chen L, Park SM, Tumanov AV, Hau A, Sawada K, Feig C, Turner JR, Fu YX, Romero IL, Lengyel E, et al. CD95 promotes tumour growth. Nature. 2010;465:492–6. doi: 10.1038/nature09075. [DOI] [PMC free article] [PubMed] [Google Scholar]
- Du ZM, Hu CF, Shao Q, Huang MY, Kou CW, Zhu XF, Zeng YX, Shao JY. Upregulation of caveolin-1 and CD147 expression in nasopharyngeal carcinoma enhanced tumor cell migration and correlated with poor prognosis of the patients. Int J Cancer. 2009;125:1832–41. doi: 10.1002/ijc.24531. [DOI] [PubMed] [Google Scholar]
- Engelman JA, Wykoff CC, Yasuhara S, Song KS, Okamoto T, Lisanti MP. Recombinant expression of caveolin-1 in oncogenically transformed cells abrogates anchorage-independent growth. J Biol Chem. 1997;272:16374–81. doi: 10.1074/jbc.272.26.16374. [DOI] [PubMed] [Google Scholar]
- Felicetti F, Parolini I, Bottero L, Fecchi K, Errico MC, Raggi C, Biffoni M, Spadaro F, Lisanti MP, Sargiacomo M, et al. Caveolin-1 tumor-promoting role in human melanoma. Int J Cancer. 2009;125:1514–22. doi: 10.1002/ijc.24451. [DOI] [PMC free article] [PubMed] [Google Scholar]
- Gray-Schopfer V, Wellbrock C, Marais R. Melanoma biology and new targeted therapy. Nature. 2007;445:851–7. doi: 10.1038/nature05661. [DOI] [PubMed] [Google Scholar]
- Gray-Schopfer VC, Cheong SC, Chong H, Chow J, Moss T, Abdel-Malek ZA, Marais R, Wynford-Thomas D, Bennett DC. Cellular senescence in naevi and immortalisation in melanoma: a role for p16? Br J Cancer. 2006;95:496–505. doi: 10.1038/sj.bjc.6603283. [DOI] [PMC free article] [PubMed] [Google Scholar]
- Hoek KS, Eichhoff OM, Schlegel NC, Dobbeling U, Kobert N, Schaerer L, Hemmi S, Dummer R. In vivo switching of human melanoma cells between proliferative and invasive states. Cancer Res. 2008;68:650–6. doi: 10.1158/0008-5472.CAN-07-2491. [DOI] [PubMed] [Google Scholar]
- Hoek KS, Goding CR. Cancer stem cells versus phenotype-switching in melanoma. Pigment Cell Melanoma Res. 2010;23:746–59. doi: 10.1111/j.1755-148X.2010.00757.x. [DOI] [PubMed] [Google Scholar]
- Holgren C, Dougherty U, Edwin F, Cerasi D, Taylor I, Fichera A, Joseph L, Bissonnette M, Khare S. Sprouty-2 controls c-Met expression and metastatic potential of colon cancer cells: sprouty/c-Met upregulation in human colonic adenocarcinomas. Oncogene. 2010;29:5241–53. doi: 10.1038/onc.2010.264. [DOI] [PMC free article] [PubMed] [Google Scholar]
- Kang JH, Song KH, Jeong KC, Kim S, Choi C, Lee CH, Oh SH. Involvement of Cox-2 in the metastatic potential of chemotherapy-resistant breast cancer cells. BMC Cancer. 2011;11:334. doi: 10.1186/1471-2407-11-334. [DOI] [PMC free article] [PubMed] [Google Scholar]
- Koleske AJ, Baltimore D, Lisanti MP. Reduction of caveolin and caveolae in oncogenically transformed cells. Proc Natl Acad Sci U S A. 1995;92:1381–5. doi: 10.1073/pnas.92.5.1381. [DOI] [PMC free article] [PubMed] [Google Scholar]
- Kreizenbeck GM, Berger AJ, Subtil A, Rimm DL, Gould Rothberg BE. Prognostic significance of cadherin-based adhesion molecules in cutaneous malignant melanoma. Cancer Epidemiol Biomarkers Prev. 2008;17:949–58. doi: 10.1158/1055-9965.EPI-07-2729. [DOI] [PMC free article] [PubMed] [Google Scholar]
- Larue L, Delmas V. The WNT/Beta-catenin pathway in melanoma. Front Biosci. 2006;11:733–42. doi: 10.2741/1831. [DOI] [PubMed] [Google Scholar]
- Lavie Y, Fiucci G, Liscovitch M. Up-regulation of caveolae and caveolar constituents in multidrug-resistant cancer cells. J Biol Chem. 1998;273:32380–3. doi: 10.1074/jbc.273.49.32380. [DOI] [PubMed] [Google Scholar]
- Li WP, Liu P, Pilcher BK, Anderson RG. Cell-specific targeting of caveolin-1 to caveolae, secretory vesicles, cytoplasm or mitochondria. J Cell Sci. 2001;114:1397–408. doi: 10.1242/jcs.114.7.1397. [DOI] [PubMed] [Google Scholar]
- Lin MI, Yu J, Murata T, Sessa WC. Caveolin-1-deficient mice have increased tumor microvascular permeability, angiogenesis, and growth. Cancer Res. 2007;67:2849–56. doi: 10.1158/0008-5472.CAN-06-4082. [DOI] [PubMed] [Google Scholar]
- Maret D, Gruzglin E, Sadr MS, Siu V, Shan W, Koch AW, Seidah NG, Del Maestro RF, Colman DR. Surface expression of precursor N-cadherin promotes tumor cell invasion. Neoplasia. 2010;12:1066–80. doi: 10.1593/neo.10954. [DOI] [PMC free article] [PubMed] [Google Scholar]
- Margineanu E, Cotrutz CE, Cotrutz C. Correlation between E-cadherin abnormal expressions in different types of cancer and the process of metastasis. Rev Med Chir Soc Med Nat Iasi. 2008;112:432–6. [PubMed] [Google Scholar]
- Mehrotra S, Languino LR, Raskett CM, Mercurio AM, Dohi T, Altieri DC. IAP regulation of metastasis. Cancer Cell. 2010;17:53–64. doi: 10.1016/j.ccr.2009.11.021. [DOI] [PMC free article] [PubMed] [Google Scholar]
- Molina-Ortiz I, Bartolome RA, Hernandez-Varas P, Colo GP, Teixido J. Overexpression of E-cadherin on melanoma cells inhibits chemokine-promoted invasion involving p190RhoGAP/p120ctn-dependent inactivation of RhoA. J Biol Chem. 2009;284:15147–57. doi: 10.1074/jbc.M807834200. [DOI] [PMC free article] [PubMed] [Google Scholar]
- Nguyen DX, Bos PD, Massague J. Metastasis: from dissemination to organ-specific colonization. Nat Rev Cancer. 2009;9:274–84. doi: 10.1038/nrc2622. [DOI] [PubMed] [Google Scholar]
- Nishita M, Enomoto M, Yamagata K, Minami Y. Cell/tissue-tropic functions of Wnt5a signaling in normal and cancer cells. Trends Cell Biol. 2010;20:346–54. doi: 10.1016/j.tcb.2010.03.001. [DOI] [PubMed] [Google Scholar]
- Podsypanina K, Du YC, Jechlinger M, Beverly LJ, Hambardzumyan D, Varmus H. Seeding and propagation of untransformed mouse mammary cells in the lung. Science. 2008;321:1841–4. doi: 10.1126/science.1161621. [DOI] [PMC free article] [PubMed] [Google Scholar]
- Pouponnot C, Sii-Felice K, Hmitou I, Rocques N, Lecoin L, Druillennec S, Felder-Schmittbuhl MP, Eychene A. Cell context reveals a dual role for Maf in oncogenesis. Oncogene. 2006;25:1299–310. doi: 10.1038/sj.onc.1209171. [DOI] [PubMed] [Google Scholar]
- Quest AF, Gutierrez-Pajares JL, Torres VA. Caveolin-1: an ambiguous partner in cell signalling and cancer. J Cell Mol Med. 2008;12:1130–50. doi: 10.1111/j.1582-4934.2008.00331.x. [DOI] [PMC free article] [PubMed] [Google Scholar]
- Quest AF, Leyton L, Parraga M. Caveolins, caveolae, and lipid rafts in cellular transport, signaling, and disease. Biochem Cell Biol. 2004;82:129–44. doi: 10.1139/o03-071. [DOI] [PubMed] [Google Scholar]
- Quest AFG, Lobos-Gonzalez L, Núnez S, Sanhueza C, Fernández JG, Aguirre A, Rodríguez, Leyton L, Torres VA. The CAV1 connection to cell death and survival. Current Molecular Medicine. 2013;13:266–281. doi: 10.2174/156652413804810745. [DOI] [PubMed] [Google Scholar]
- Ravid D, Chuderland D, Landsman L, Lavie Y, Reich R, Liscovitch M. Filamin A is a novel caveolin-1-dependent target in IGF-I-stimulated cancer cell migration. Exp Cell Res. 2008;314:2762–73. doi: 10.1016/j.yexcr.2008.06.004. [DOI] [PubMed] [Google Scholar]
- Rodriguez DA, Tapia JC, Fernandez JG, Torres VA, Munoz N, Galleguillos D, Leyton L, Quest AF. Caveolin-1-mediated suppression of cyclooxygenase-2 via a beta-catenin-Tcf/Lef-dependent transcriptional mechanism reduced prostaglandin E2 production and survivin expression. Mol Biol Cell. 2009;20:2297–310. doi: 10.1091/mbc.E08-09-0939. [DOI] [PMC free article] [PubMed] [Google Scholar]
- Savage K, Lambros MB, Robertson D, Jones RL, Jones C, Mackay A, James M, Hornick JL, Pereira EM, Milanezi F, et al. Caveolin 1 is overexpressed and amplified in a subset of basal-like and metaplastic breast carcinomas: a morphologic, ultrastructural, immunohistochemical, and in situ hybridization analysis. Clin Cancer Res. 2007;13:90–101. doi: 10.1158/1078-0432.CCR-06-1371. [DOI] [PubMed] [Google Scholar]
- Singh B, Berry JA, Shoher A, Ayers GD, Wei C, Lucci A. COX-2 involvement in breast cancer metastasis to bone. Oncogene. 2007;26:3789–96. doi: 10.1038/sj.onc.1210154. [DOI] [PubMed] [Google Scholar]
- Sun XH, Liu ZY, Chen H, Beardsley AR, Qi Q, Liu J. A conserved sequence in caveolin-1 is both necessary and sufficient for caveolin polarity and cell directional migration. FEBS Lett. 2009;583: 3681–9. doi: 10.1016/j.febslet.2009.10.055. [DOI] [PubMed] [Google Scholar]
- Tahir SA, Yang G, Goltsov AA, Watanabe M, Tabata K, Addai J, Fattah El MA, Kadmon D, Thompson TC. Tumor cell-secreted caveolin-1 has proangiogenic activities in prostate cancer. Cancer Res. 2008;68:731–9. doi: 10.1158/0008-5472.CAN-07-2668. [DOI] [PubMed] [Google Scholar]
- Tirado OM, Maccarthy CM, Fatima N, Villar J, Mateo-Lozano S, Notario V. Caveolin-1 promotes resistance to chemotherapy-induced apoptosis in Ewing's sarcoma cells by modulating PKCalpha phosphorylation. Int J Cancer. 2010;126:426–36. doi: 10.1002/ijc.24754. [DOI] [PMC free article] [PubMed] [Google Scholar]
- Torres VA, Tapia JC, Rodriguez DA, Lladser A, Arredondo C, Leyton L, Quest AF. E-cadherin is required for caveolin-1-mediated down-regulation of the inhibitor of apoptosis protein survivin via reduced beta-catenin-Tcf/Lef-dependent transcription. Mol Cell Biol. 2007;27:7703–17. doi: 10.1128/MCB.01991-06. [DOI] [PMC free article] [PubMed] [Google Scholar]
- Torres VA, Tapia JC, Rodriguez DA, Parraga M, Lisboa P, Montoya M, Leyton L, Quest AF. Caveolin-1 controls cell proliferation and cell death by suppressing expression of the inhibitor of apoptosis protein survivin. J Cell Sci. 2006;119:1812–23. doi: 10.1242/jcs.02894. [DOI] [PubMed] [Google Scholar]
- Trimmer C, Whitaker-Menezes D, Bonuccelli G, Milliman JN, Daumer KM, Aplin AE, Pestell RG, Sotgia F, Lisanti MP, Capozza F. CAV1 inhibits metastatic potential in melanomas through suppression of the integrin/Src/FAK signaling pathway. Cancer Res. 2010;70:7489–99. doi: 10.1158/0008-5472.CAN-10-0900. [DOI] [PMC free article] [PubMed] [Google Scholar]
- Urra H, Torres VA, Ortiz RJ, Lobos L, Diaz MI, Diaz N, Hartel S, Leyton L, Quest AF. Caveolin-1-enhanced motility and focal adhesion turnover require tyrosine-14 but not accumulation to the rear in metastatic cancer cells. PLoS One. 2012;7:e33085. doi: 10.1371/journal.pone.0033085. [DOI] [PMC free article] [PubMed] [Google Scholar]
- Watanabe M, Yang G, Cao G, Tahir SA, Naruishi K, Tabata K, Fattah EA, Rajagopalan K, Timme TL, Park S, et al. Functional analysis of secreted caveolin-1 in mouse models of prostate cancer progression. Mol Cancer Res. 2009;7:1446–55. doi: 10.1158/1541-7786.MCR-09-0071. [DOI] [PMC free article] [PubMed] [Google Scholar]
- Wendt MK, Taylor MA, Schiemann BJ, Schiemann WP. Down-regulation of epithelial cadherin is required to initiate metastatic outgrowth of breast cancer. Mol Biol Cell. 2011;22:2423–35. doi: 10.1091/mbc.E11-04-0306. [DOI] [PMC free article] [PubMed] [Google Scholar]
- Widmer DS, Cheng PF, Eichhoff OM, Belloni BC, Zipser MC, Schlegel NC, Javelaud D, Mauviel A, Dummer R, Hoek KS. Systematic classification of melanoma cells by phenotype-specific gene expression mapping. Pigment Cell Melanoma Res. 2012a doi: 10.1111/j.1755-148X.2012.00986.x. [DOI] [PubMed] [Google Scholar]
- Widmer DS, Cheng PF, Eichhoff OM, Belloni BC, Zipser MC, Schlegel NC, Javelaud D, Mauviel A, Dummer R, Hoek KS. Systematic classification of melanoma cells by phenotype-specific gene expression mapping. Pigment Cell Melanoma Res. 2012b;25:343–53. doi: 10.1111/j.1755-148X.2012.00986.x. [DOI] [PubMed] [Google Scholar]
- Wiechen K, Diatchenko L, Agoulnik A, Scharff KM, Schober H, Arlt K, Zhumabayeva B, Siebert PD, Dietel M, Schafer R, et al. Caveolin-1 is down-regulated in human ovarian carcinoma and acts as a candidate tumor suppressor gene. Am J Pathol. 2001;159:1635–43. doi: 10.1016/S0002-9440(10)63010-6. [DOI] [PMC free article] [PubMed] [Google Scholar]
- Wu Y, Lin Y, Liu H, Li J. Inhibition of invasion and up-regulation of E-cadherin expression in human malignant melanoma cell line A375 by (−)-epigallocatechin-3-gallate. J Huazhong Univ Sci Technolog Med Sci. 2008;28:356–9. doi: 10.1007/s11596-008-0330-3. [DOI] [PubMed] [Google Scholar]
- Yang L, Han Y, Suarez Saiz F, Minden MD. A tumor suppressor and oncogene: the WT1 story. Leukemia. 2007;21:868–76. doi: 10.1038/sj.leu.2404624. [DOI] [PubMed] [Google Scholar]
Associated Data
This section collects any data citations, data availability statements, or supplementary materials included in this article.