

Abstract
Rotenone is an inhibitor of mitochondrial complex I that produces a model of Parkinson’s disease (PD), in which neurons undergo dopamine release dysfunction and other features. In neurons, exocytosis is one of the processes associated with dopamine release and is dependent on Ca2+ dynamic changes of the cell. In the present study, we have investigated the exocytosis of dopamine and the involvement of Ca2+ in dopamine release in PC12 cells administrated with rotenone. Results demonstrated that rotenone led to an elevation of intracellular Ca2+ through Ca2+ influx by opening of the voltage-gated Ca2+ channel and influenced the soluble N-ethylmaleimide attachment protein receptor (SNARE) proteins expression (including syntaxin, vesicle-associated membrane protein 2 (VAMP2) and synaptosome-associated protein 25 (SNAP-25)); pretreatment with a blocker of L-type voltage-activated Ca2+ channels (nifedipine) decreased the intracellular dopamine levels and ROS formation, increased the cell viability and enhanced the neurite outgrowth and exocytosis of synaptic vesicles. These results indicated that the involvement of intracellular Ca2+ was one of the factors resulting in suppression of dopamine release suppression in PC12 cells intoxicated with rotenone, which was associated with the rotenone-induced dopamine neurotoxicity.
Keywords: rotenone, PC12 cells, Ca2+, dopamine release, neurotoxicity
Introduction
Rotenone, a pesticide derived from the roots of plants of the Leguminosae family, is a specific inhibitor of mitochondrial complex I1. It is a popular botanical pesticide that is harmless to plants, but toxic to insects, fish, and mammals2,3. In a rat model, rotenone has been shown to produce effects that closely resemble Parkinson’s disease (PD)1. Many epidemiological surveys have also revealed that rotenone is relevant to the pathogenesis of PD4. These observations have led to the development of a rodent model of PD based on chronic exposure to the mitochondrial complex I inhibitor, rotenone1.
It has been shown that in vitro and in vivo treatment with rotenone decreased dopamine levels in the striatum, and inhibited dopamine uptake, thus reproducing the neurochemical features of PD5. It has also been demonstrated that rotenone has a supra-additive impact on the release of monoamine transmitters5. In previous studies, we also have reported that rotenone-induced PC12 cell toxicity is caused by oxidative stress resulting from altered dopamine metabolism6. These conclusions urge us to explore whether the alteration of dopamine metabolism in neurons is the result of dopamine release dysfunction induced by rotenone. It is well known that exocytosis and endocytosis play important roles in dopamine release in neurons, which is associated closely with Ca2+ ion participation7. Therefore, in the present study, we investigated whether the dopamine release in neurons was influenced by rotenone, its association with intracellular free Ca2+[Ca2+]i and its contribution to the neurotoxicity of PC12 cells. It is also noteworthy that the studies of the action of rotenone on [Ca2+]i and neurotransmitter release of PC12 cells may also contribute to understanding the etiology of the neurodegenerative mechanisms in PD.
Material and Methods
Materials
PC12 cells were obtained from Shanghai Cell Bank, Chinese Academy of Sciences. Rotenone, Fura-2/AM, FM1-43, nifedipine, and 2’,7’_dichlorofluorescein diacetate (DCF-DA) were purchased from Sigma-Aldrich (St. Louis, MO, USA). Antibodies of syntaxin, vesicle-associated membrane protein 2 (VAMP2) and synaptosomal-associated protein 25 (SNAP-25) were purchased from Abcam (Santa Cruz, CA, USA). A Cell counting kit was purchased from DOJINDO LABORATORIES (Japan). A BCA Protein Assay Kit was purchased from Beyotime(China). An ECL+ detection system was purchased from Beyotime (China). All other reagents used were of the highest grade available.
Cell culture and treatment
The PC12 cell line was cultured at 37ºC under an atmosphere of 5% CO2 in Dulbecco’s Modified Eagle’s Medium (DMEM) containing 10% horse serum and 5% fetal bovine serum (complete media). The culture medium was replenished at 3 to 4-day intervals based on the doubling time of PC12 cells. Cells were treated with the indicated concentration of rotenone dissolved in DMSO for 24 h. The control group was administrated with equal amounts of DMSO. The nifedipine pretreatment group was administrated with nifedipine (0.5 μM) for 30 minutes prior to rotenone intoxication.
Measurement of intracellular Ca2+ levels with fura-2/AM fluorescence
Fura-2/AM is a specific indicator of intracellular calcium fluorescence. It can be hydrolyzed into Fura-2 by intracellular esterase. Fura-2 can be combined with cytosolic free Ca2+ reversibly with fluorescence emission. The binding ratio is 1:1. The maximum excitation wavelengths shift from 380 nm, before its combination with Ca2+, to 340 nm. There is a quantitative relationship between the emission fluorescence intensity and binding Ca2+ concentration. Therefore, the concentration of calcium ions is indicated by the fluorescence ratio excitation at 340 nm and 380 nm. In this experiment, we investigated how the intracellular Ca2+ levels were affected in PC12 cells treated with rotenone. Intracellular Ca2+ contents of PC12 cells were assayed with Fura-2/AM fluorescent dye. The levels of intracellular Ca2+ were reflected by the intensity of the Fura-2/AM fluorescent probe under a fluorescence microscope. Digital calcium imaging was performed as follows. A kinetic study of rise in intracellular Ca2+ was conducted in which PC12 cells were loaded with 2 μg/ml Fura- 2/AM dye in the presence of pluronic acid at 37ºC for 40 min, then washed free of extracellular Fura-2/AM dye and resuspended in Krebs-Ringer-HEPES (KRH) buffer (131 mM NaCl, 5 mM KCl, 1.3 mM MgSO4, 1.3 mM CaCl2, 0.4 mM KH2PO4, 6 mM glucose, 20 mM HEPES, pH 7.4). The loading was terminated by washing with Hanks’ Balanced Salt Solution for 25 min before starting the experiment. Treatment with rotenone was initiated 1 min later, and the changes in fluorescence were recorded for 18 min. PC12 cells were intoxicated with rotenone for 24 h with or without nifedipine, and then the cells were harvested. PC12 cells were loaded with Fura- 2/AM dye and treated as above, and the intracellular Ca2+ was observed.
CCK-8 assay to evaluate PC12 cell viability
Cell Counting Kit-8 (CCK-8) was used to assess PC12 cell viability in accordance with the manufacturer’s instructions. PC12 cells were maintained at 30%–70% confluence (exponential growth phase) and then were inoculated into 96-well plates at 1000 cells/well. PC12 cells were subjected to control group, rotenone (1.0 μM) treatment group and nifedipine pretreatment group respectively. They were then incubated in a carbon dioxide cell incubator (37ºC,5% CO2) for 24 h. At the indicated times, CCK-8 solutions (10 μl) were added to each well, and incubation was performed for 2.5 h; optical density was then assayed with microplate reader at 450 nm. All results were normalized to optical density values measured from an identically conditioned well without medium.
Uptake of FM1-43 into PC12 cells
To examine the recycling of synaptic vesicles in PC12 cells treated with rotenone, FM1-43, a fluorescent dye, was introduced into the extracellular fluid. FM1-43, a lipophilic dye that has been shown to reflect neurosecretory changes through plasma membrane thickness due to vesicular exocytosis and endocytosis8, was used as a probe to understand the mechanism of neurotransmitter release in PC12 cells. PC12 cells were treated with 1 mM rotenone and solvent respectively for 24 h, and then were loaded with FM1-43 (10 mM) in a high K+ solution (50 mM) for 3 min. FM1-43 is “captured ” in newly formed synaptic vesicles during the process of endocytosis, and the intensity of FM1-43 labeling is proportional to the amount of endocytosis and inversely proportional to the amount of exocytosis. After washing with phosphate buffered saline (PBS) for 30 min, the cells were examined. A band-pass filter (450–490 nm) was placed in the excitation path, and a dichroic mirror (510 nm) and a cut-off filter (520 nm) were placed in the emission path. Images were acquired and analyzed using a confocal scanning laser microscope, and its software.
Western immunoblotting analysis
After rotenone treatments, PC12 cells were harvested with trypsin, washed twice with cold phosphate-buffered saline (PBS) and resuspended in ice-cold RIPA lysis buffer. After 15 min on ice, the samples were centrifuged at 4ºC for 15 min at 12,000 g. The supernatants were collected and stored at –80ºC until analysis. Each sample containing 20 ug proteins was resoluted in 12% sodium dodecyl sulfate (SDS)-polyacrylamide gel and electroblotted for 40 minutes at 15 V onto a PVDF membrane. Membranes were blocked for 1 h at room temperature using 5% nonfat milk in Tris-buffered saline (TBS) containing 0.1% Tween 20 (TBST) and incubated for 24 h at 4ºC with a monoclonal mouse anti-SNAP-25 antibody (1:750), vesicle-associated membrane protein 2 (VAMP2 ) antibody (1:1000) and syntaxin antibody (1:800), respectively, in blocking solution. The membranes were rinsed for 5 min at room temperature in TBST 3 times, incubated for 1 h with a peroxidase- conjugated goat anti-mouse IgG 1:1000 in blocking solution, and again rinsed with TBST. After a brief wash in TBST, bound antibodies were revealed by chemiluminescence with an ECL+ detection system. The membranes were further stripped of bound antibodies as recommended in the manufacturer’s instructions, reblocked and probed with a monoclonal mouse anti-GAPDH 1:1000 as a protein loading control. The electrochemiluminescence stainings were quantified by densitometry with a VisioLab 2000 image analyzer. Values obtained for protein were normalized with their corresponding GAPDH values.
HPLC determination of dopamine contents in PC12 cells
PC12 cells cultured for 3–4 days and maintained at 30%–70% confluence (exponential growth phase), were divided into groups and were exposed to different treatment factors. At the indicated time, the cells in the flask were washed with PBS, harvested and mixed with 120 L ice-chilled perchloric acid (0.2 M) containing 0.5 mM EDTA and 0.05 mg/ml dihydroxybenzylamine (DHBA). Then the solution was ultrasonicated and centrifuged at 7000 g for 20 min at 4ºC. The samples was collected and stored immediately at 80ºC until analyzed.
Levels of dopamine were measured by HPLC coupled with a fluorescence detection system. Samples were eluted through a 150x4.6-mm ODS C18 column at a rate of 1.0 ml/min with a mobile phase consisting of 0.1 M Na2HPO4, 0.8 mM octyl sulfonic acid (OSA), 0.5 mM EDTA and 10% (v/v) methanol and adjusted to pH 3.63 with phosphoric acid. The ODS C18 column was kept at room temperature. The fluorescence detector was set with excitation at 254 nm and emission at 338 nm. The working standard solution was prepared in 0.2 M perchloric acid containing 0.5 mM EDTA and 0.05 mg/ml DHBA. The dopamine concentrations were determined with an external standard calibration curve. The concentrations of dopamine were expressed as micrograms in per gram of protein. The BCA Protein Assay kit was used to determine the protein concentration of the samples.
Intracellular ROS measurement
Intracellular reactive oxygen species (ROS) were analyzed by using dichlorofluorescein diacetate (DCF-DA) as a probe. DCF-DA, a nonfluorescent compound, is deacetylated by viable cells to 2,7-dichlorofluorescein (DCF) by hydrogen peroxide. First, PC12 cells were treated with the designated experimental conditions. Then PC12 cells were collected and incubated with 100 mM DCF-DA (dissolved in DMSO) for 30 min at 37ºC. Cells were then washed three times with PBS (pH 7.4) and the intracellular accumulation of fluorescent DCF-DA was measured by a Cyto-Fluor Multi-Well Plate Reader with excitation at 485 nm and emission at 530 nm, respectively. The results were expressed as the intensity of DCF fluorescence.
Observation of neurite outgrowth of PC12 cells
Cells were cultured on cover slips. Following treatment, the cells were washed in ice-cold Krebs-Ringer buffer (KRB) and fixed with 10% paraformaldehyde. The cover slips were mounted with Mowiol and allowed to dry before viewing under phase-contrast conditions with a Zeiss Axiovert S100 microscope. From each slide, at least 100 cells from five randomly selected fields were counted. Measurements were carried out using the NIH/Scion image software.
Statistical analysis
All values in the experiments were expressed as  ± s. Statistical analyses were
carried out using the SPSS 10.0 software. The data were evaluated by one-way analysis of
the variance (ANOVA). P< 0.05 and P<0.01 were taken as levels of statistical
significance.
± s. Statistical analyses were
carried out using the SPSS 10.0 software. The data were evaluated by one-way analysis of
the variance (ANOVA). P< 0.05 and P<0.01 were taken as levels of statistical
significance.
Results
The intracellular Ca2+ in PC12 cells
A concentration-dependent increase in the intracellular Ca2+ levels was displayed in PC12 cells exposed to different concentrations of rotenone under digital calcium imaging. Experiments revealed that the increase in intracellular Ca2+ developed faster at higher concentrations of rotenone: 1.0 μM rotenone caused an elevation of [Ca2+]i within ~3 min in the majority of exposed cells. The averaged time course of changes in intracellular Ca2+ in all cells within the field of view indicated that the rotenone-inducing increase in intracellular Ca2+ occurred with an ~3 min delay and resulted in a substantial elevation of intracellular Ca2+ by the end of the recording period, 18 min (Fig. 1B, C, D). However, the intracellular Ca2+ was stable throughout the recording period in PC12 cells of the control group (Fig. 1A). In addition, intracellular Ca2+ was also increased in PC12 cells after rotenone treatment for 24 h, maintaining a relative stable level (Fig. 1G). However, intracellular Ca2+ was reduced in PC12 cells exposed to rotenone with nifedipine pretreatment (Fig. 1H).
Fig. 1.

Intracellular Ca2+ levels were determined with Fura-2/AM flurorescent dye. A: The intracellular Ca2+ of PC12 cells in the control group was stable during the observation time. B, C, D: Intracellular Ca2+ of PC12 cells was increased by treatment with rotenone (0.1 μM, 0.5 μM, 1.0 μM) in a concentration dependent manner. E: Effects of nifedipine on the increase in intracellular Ca2+ of PC12 cells intoxicated with rotenone (1.0 mΜ). PC12 cells were pretreated with nifedipine (0.5 μM) followed by rotenone administration. The enhancement of intracellular Ca2+ induced by rotenone was retarded in PC12 cells with nifedipine pretreatment. F: Effects of Ca2+ concentration in cell medium (Ca2+ free, CaCl2 or EGTA) on the increase in intracellular Ca2+ in PC12 cells intoxicated with rotenone (1.0 μM). Rotenone was added first without Ca2+, followed with CaCl2 (1 mM) added, and then the Ca2+ chelator EGTA (2 mM) was added to the medium. First, intracellular Ca2+ showed no obvious changes in PC12 cells treated with rotenone in the medium without intracellular Ca2+, this was followed by a swift rise in intracellular Ca2+ with Ca2+ addition, and then a quick drop in intracellular Ca2+ in the PC12 cells when EGTA was added. G: A stable increase in intracellular Ca2+ was induced in PC12 cells after rotenone treatment for 24 hours. H: With nifedipine pretreatment, a decrease in intracellular Ca2+ was observed in PC12 cells expososed to rotenone (1.0 μM) for 24 hours.
Factors affecting rotenone-inducing Ca2+ influx in PC12 cells
Pretreatment with the blocker of L-type voltage-activated Ca2+ channels (nifedipine) resulted in suppression of the rotenone-inducing intracellular Ca2+ increase in the PC12 cells to a certain extent (Fig. 1E). Another experiment showed that in the absence of extracellular Ca2+, there was no increase in intracellular Ca2+ during exposure of PC12 cells to rotenone. Reintroduction of extracellular Ca2+ with CaCl2, immediately after cell exposure to Ca2+-free solution, resulted in an equally fast recovery of increase in intracellular Ca2+. Moreover, when extracellular Ca2+ was abolished using the chelator (EGTA) of Ca2+ during the rising phase of the rotenone-inducing intracellular Ca2+ increase, the intracellular Ca2+ declined to almost its initial level within the next few minutes (Fig. 1F.).
The viability of PC12 cells
The viability of PC12 cells treated with rotenone was decreased significantly compared with that in the control group (P <0.01). However, the viability of PC12 cells pretreated with nifedipine was increased and signifcantlydifferent compared with that in the group treated with rotenone alone (Fig. 2).
Fig. 2.

PC12 cell viability was observed with CCK-8.
Rotenone treatment (1.0 μM) decreased the PC12 cell viability obviously compared
with that in the control group. However, nifedipine (0.5 μM) pretreatment
significantly improved the viability of PC12 cells exposed to rotenone alone. Data
are expressed as ± s, * P<0.05 vs PC12+rotenone group (1.0 μM); ** P
<0.01 vs control group.
Synaptic vesicle recycling in PC12 cells
FM1-43 labeling occurred in both the PC12 cells of the control group and the experimental groups following with high K+ stimulation. PC12 cells of the control group were extensively labeled along the contours of the cell body, mainly with dot-like distribution (Fig. 3A). On the other hand, the PC12 cells treated with rotenone were labeled more intensely, mainly clustering around the nucleus, and the particle density was obviously increased (Fig. 3B). The intensity of the fluorescence of the spots was measured and calculated. The fluorescence intensity was greater in PC12 cells treated with rotenone (1.0 μM) compared with that in the control group (Fig. 3D). The fluorescence intensity represented the numbers of vesicles. Therefore, the number of vesicles in the cytoplasm labeled with FM1-43 was increased in PC12 cells induced by rotenone in comparison with PC12 cells of the control group (Fig. 3D).
Fig. 3.

Synaptic vesicle recycling observed with FM1-43 in
PC12 cells. The results showed that the FM1-43 fluorescent dye was diffused along
the PC12 cell body in the control group (A); however it preferentially concentrated
around the nucleus of rotenone-treated PC12 cells (B). Nifedipine pretreatment
retarded these changes as shown in C. The fluorescence intensity of synaptic
vesicles labeled with FM1-43 was calculated. The results showed that the
distribution of the fluorescence intensity was greater in PC12 cells treated with
rotenone (1.0 μM) compared with that in the control group; however, the fluorescence
intensity was lower in PC12 cells pretreated with nifedipine in comparison with that
in PC12 cells treated with rotenone alone (1.0 μM) (D). Data are expressed as
± s, *
P≤0.01 vs control group; # P <0.01 vs rotenone (1.0 μM)
group.
Because the depolarization-inducing synaptic vesicle recycling is dependent on the influx of extracellular Ca2+, the Ca2+ dependency of the suppression of synaptic vesicles release induced by rotenone was tested in the stimulation medium pretreated with nifedipine. As shown in Fig. 3D, the fluorescence intensity of FM1-43 labeling was weakened in PC12 cells pretreated with nifedipine compared with that of PC12 cells treated with rotenone alone, which indicated that the numbers of synaptic vesicles in the cytoplasm decreased in PC12 cells treated with nifedipine. These synaptic vesicles were recycled in a Ca2+-dependent manner, and nifedipine pretreatment could slow down the increase in synaptic vesicles in PC12 cells induced by rotenone.
Soluble N-ethylmaleimide attachment protein receptor complex (SNARE) protein expression in PC12 cells
The neuronal SNARE formed by synaptobrevin (also known as VAMP2), syntaxin and SNAP-25 plays a central role in Ca2+-triggered neurotransmitter release. The effect of rotenone on SNARE protein expression was studied by Western immunoblotting analysis in PC12 cells. The VAMP2 protein expression level was increased significantly in PC12 cells treated with 1.0 μM rotenone compared with that of the control group (Fig. 4A-1, 2). SNAP-25 protein was detected in the control cells, and its expression level was decreased with rotenone treatment (Fig. 4B-1, 2). Under the same experimental conditions, syntaxin protein was also detected in PC12 cells and decreased markedly in the experimental group (Fig. 4C-1, 2). As the SNARE contains several potential Ca2+-binding sites on the surface, the variations of the three proteins expression might be associated with the influx of Ca2+ in the PC12 cells induced by rotenone as mentioned above. Thus, SNARE may be involved directly in the neurotoxicity of PC12 cells induced by rotenone.
Fig. 4.
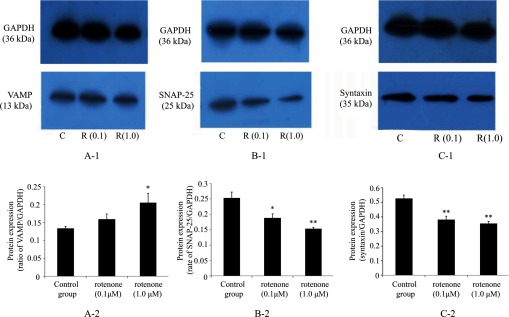
Western immunoblotting analysis of SNARE expression in PC12 cells. The Western
immunoblotting ratio was calculated from 3 batches of independent experiments and
was as shown in the figure. VAMP2 protein expression was increased
significantly by 1.0 μM rotenone treatment; however protein expression of SNAP-25
and syntaxin was decreased markedly by rotenone treatment. Data are expressed as
± s, (n
=3), * P < 0.05; ** P < 0.01.
Capabilities of dopamine release of PC12 cells
To study the dependence of Ca2+ on dopamine release in rotenone-intoxicated PC12 cells pretreated with nifedipine, intracellular dopamine levels were measured. Intracellular dopamine levels were significantly increased after rotenone (1.0 μM) treatment in compared with those in the control group (Fig. 5). However, the cytoplasmic dopamine content was decreased markedly in PC12 cells exposed to rotenone with nifedipine pretreatment (Fig. 5).
Fig. 5.

Intracellular dopamine in PC12 cells was
collected and analyzed. Intracellular dopamine levels were significantly increased
following treatment with 1.0 μM rotenone alone compared with that in the control
group. The level of intracellular dopamine of PC12 cells incubated with nifedipine
pretreatment was lower obviously compared with that in PC12 cells treated with
rotenone. Data are expressed as ± s, (n = 6), ** P < 0.01.
Changes in ROS levels in PC12 cells
The contents of ROS in PC12 cells can be reflected by the intensity of DCF-DA. The intensity of DCF-DA was increased in PC12 cells intoxicated with rotenone compared with that in the control group, indicating that the levels of ROS formation in PC12 cells was stimulated by rotenone. Pretreatment with nifedipine decreased the ROS formation in PC12 cells exposed to rotenone (Fig. 6).
Fig .6.

ROS content in PC12 cells intoxicated with rotenone. The top
panel shows microscopic images of DCF-DA fluorescence intensity, which reflected the
ROS levels in PC12 cells. DCF-DA fluorescence intensity in PC12 cells treated with
rotenone was more stronger than that in the control group, which indicated an
increase in ROS levels induced by rotenone in PC12 cells. Nifedipine (0.5 μM)
pretreatment could decrease the ROS levels in PC12 cells induced by rotenone. Data
are expressed as ± s, * P<0.01 vs control group; **P<0.01 vs
PC12+rotenone group.
The neurite outgrowth of PC12 cells
PC12 cells in the control group were polygonal and had long axons. However, after rotenone treatment for 24 h, the neurites of PC12 cells were dramatically shortened. Even some of the cells had almost no axons, becoming round, taking a spherical shape and forming a monolayer. However, PC12 cells pretreated with nifedipine (0.5 μM) and exposed to rotenone also differed morphologically from the controls. Nifedipine pretreatment, to some extent, could relieve the shortening of the processes of PC12 cells induced by rotenone (Fig. 7).
Fig. 7.

Effects of nifedipine on the neurite outgrowth of PC12 cells processes treated with
rotenone. Neurite length was reduced in PC12 cells intoxicated with rotenone and the
difference was significant (P<0.05). The processes of nifedipine pretreatment in
PC12 cells exposed to rotenone were longer in contrast with those in PC12 cells
intoxicated with rotenone alone. Data are expressed as ± s, *P<0.05 vs control
group; #P<0.05 vs PC12+rotenone.
Discussion
Rotenone is a lipophilic compound that freely crosses cell membranes and accesses cytoplasm and mitochondria and has been proved to have neurotoxicity and has abilities to produce many pathological and chemical features of PD in rats. Now, the neurotransmitter dopamine is believed to be involved in the neurodegeneration of PD9. Dopamine release from neurons takes place at specialized structures called synapses10. Dopamine release occurs through vesicular exocytosis and is action potential- and Ca2+-dependent.11
Intracellular Ca2+ has been strongly implicated in the regulation of the dopamine release of exocytosis signaling pathways12. And furthermore, it has also been reported that a rotenone-induced increase in Ca2+ concentration was involved in its toxic mechanism, which was associated with oxidative stress. In the present study, we also found that rotenone treatment resulted in a concentration-dependent rise in intracellular Ca2+ in PC12 cells, with the presence of extracellular Ca2+ as a precondition, which was connected with the dysfunction of the neurotransmitter release. The increase in intracellular Ca2+ partially contributed to the suppression of dopamine release in PC12 cells intoxicated with rotenone. It has been reported that an influx of extracellular Ca2+ through Ca2+-permeable ion channels, a decrease in the outflow of intracellular Ca2+ and a release of Ca2+ from intracellular stores are the three main mechanisms, that contribute to the increase of intracellular Ca2+ in cells. Our current results showed that in the absence of extracellular Ca2+ or with the removal of extracellular Ca2+ by adding the Ca2+ chelator (EGTA) to the medium, there was no increase in intracellular Ca2+ during the exposure of PC12 cells to rotenone, suggesting that there was no Ca2+ released from intracellular stores. Pretreatment with nifedipine , a blockers of L-type voltage-activated Ca2+ channels, effectively suppressed the rotenone-induced intracellular Ca2+ increase in PC12 cells. Therefore, the influx of extracellular Ca2+ mainly via L-type voltage-activated Ca2+ channels might be involved in the mechanism of rotenone-induced neurotoxicity.
FM 1-43 was developed about 10 years ago. It not only serves as a very useful tool for simple synapse identification in a living preparation, but also provides quantitative information about recycling pools of vesicles8. During periods of PC12 cell activity, recycling synaptic vesicles are labeled as they internalize t FM 1-43 dye. After washing out the surface-bound probe, the recycling synaptic vesicles are easily visualized. The present results showed that the FM1-43-labeled synaptic vesicles were extensively scattered in the contours of the cell body, with weak fluorescence intensity in PC12 cells of the control group. However, in PC12 cells treated with rotenone, FM1-43-labeled vesicles were mainly clustered around the nucleus with stronger fluorescence intensity. The number of synaptic vesicles increased in PC12 cells treated with rotenone, indicating there might be a suppression of vesicle exocytosis and an enhancement of endocytosis. The balance of endocytosis and exocytosis was destroyed by rotenone. It can be concluded that rotenone led to suppression of dopamine release and was involved in PC12 cells neurotoxicity.
Of course, exocytosis occurs in a series of steps and also is an intricate network involving many factors13,14. The process includes docking of synaptic vesicles to the presynaptic plasma membrane, one or more priming reactions that leave the vesicles ready for release, and the actual release triggered by Ca2+ influx into presynaptic terminals14,15,16,17. Thus, there are many factors that need to be considered. SNARE proteins play a key role in Ca2+-triggered neurotransmitter release in neurons18,19. However, the precise point of action of the SNARE in neurotransmitter release remains unclear. Syntaxin, SNAP-25 and VAMP2 are essential for regulated exocytosis in diverse cell types20. In PC12 cells intoxicated with rotenone, while the protein expression of VAMP2 increased, the syntaxin and SNAP-25 protein expression all decreased compared with those in the control group. The SNARE contains several potential Ca2+-binding sites on the surface20, suggesting that it may be involved directly in Ca2+-binding during neurotransmitter release. So the influx of Ca2+ induced by rotenone might have given rise to changes in protein expression of the SNARE or the binding action of SNARE, which further led to the dopamine release dysfunction in PC12 cells induced by rotenone. Therefore, the dopamine release dysfunction might participate in the mechanism of rotenone-induced neurotoxicity due to effects of rotenone on SNARE proteins.
Increasing evidence shows that this form of neurotransmitter discharge can be modulated by changes in intracellular Ca2+ concentration21. Nifedipine pretreatment markedly decreased the synaptic vesicle accumulation in PC12 cells intoxicated with rotenone, which suggested that nifedipine could alleviate the rotenone-induced exocytosis suppression of PC12 cells. The increase in intracellular Ca2+ in PC12 cells treated with rotenone may be the cause of exocytosis dysfunction, leading to the accumulation of synaptic vesicles and the intracellular dopamine increase. In fact, it has been reported many times that endocytosis and exocytosis of neurons are dependent on intracellular Ca2+. As rotenone treatment evoked a rise in intracellular Ca2+, dopamine release from synaptic vesicle exocytosis was partially suppressed in a Ca2+-dependent manner.
Thus, it can summed up that rotenone induced- neurotoxicity was associated with the influx of intracellular Ca2+ via the voltage-gated Ca2+ channel from the extracellular Ca2+ , and that suppression of dopamine release was partially dependent on the increased intracellular Ca2+. The current study may further add to the current knowledge of the mechanism of rotenone neurotoxicity and also the PD etiology. Of course, further detailed studies on the mechanisms of rotenone-induced suppression of dopamine release are necessary before definite conclusions can be drawn.
Acknowledgments
This work was supported by grants from the Natural Science Foundation of China (NSFC, 30800932 and 81273106) to Yan Sai.
Footnotes
This is an open-access article distributed under the terms of the Creative Commons Attribution Non-Commercial No Derivatives (by-nc-nd) License <http://creativecommons.org/licenses/by-nc-nd/3.0/>.
References
- 1.Betarbet R, Sherer TB, MacKenzie G, Garcia-Osuna M, Panov AV, and Greenamyre JT. Chronic systemic pesticide exposure reproduces features of Parkinson’s disease. Nat Neurosci. 3: 1301–1306 2000. [DOI] [PubMed] [Google Scholar]
- 2.Dauer W, and Przedborski S. Parkinson’s disease: mechanisms and models. Neuron. 39: 889–909 2003. [DOI] [PubMed] [Google Scholar]
- 3.Greenamyre JT, Betarbet R, and Sherer TB. The rotenone model of Parkinson’s disease: genes, environment and mitochondria. Parkinsonism Relat Disord. 9(Suppl 2): S59–S64 2003. [DOI] [PubMed] [Google Scholar]
- 4.Dhillon AS, Tarbutton GL, Levin JL, Plotkin GM, Lowry LK, Nalbone JT, and Shepherd S. Pesticide/environmental exposures and Parkinson’s disease in East Texas. J Agromedicine. 13: 37–48 2008. [DOI] [PubMed] [Google Scholar]
- 5.Milusheva E, Baranyi M, Kittel A, Sperlagh B, and Vizi ES. Increased sensitivity of striatal dopamine release to H2O2 upon chronic rotenone treatment. Free Radic Biol Med. 39: 133–142 2005. [DOI] [PubMed] [Google Scholar]
- 6.Sai Y, Wu Q, Le W, Ye F, Li Y, and Dong Z. Rotenone-induced PC12 cell toxicity is caused by oxidative stress resulting from altered dopamine metabolism. Toxicol In Vitro. 22: 1461–1468 2008. [DOI] [PubMed] [Google Scholar]
- 7.Kim Y, Park MK, and Chung S. Voltage-operated Ca2+ channels regulate dopamine release from somata of dopamine neurons in the substantia nigra pars compacta. Biochem Biophys Res Commun. 373: 665–669 2008. [DOI] [PubMed] [Google Scholar]
- 8.Verstreken P, Ohyama T, and Bellen HJ. FM 1-43 labeling of synaptic vesicle pools at the Drosophila neuromuscular junction. Methods Mol Biol. 440: 349–369 2008. [DOI] [PMC free article] [PubMed] [Google Scholar]
- 9.Bayersdorfer F, Voigt A, Schneuwly S, and Botella JA. Dopamine-dependent neurodegeneration in Drosophila models of familial and sporadic Parkinson’s disease. Neurobiol Dis. 40: 113–119 2010. [DOI] [PubMed] [Google Scholar]
- 10.Kile BM, Guillot TS, Venton BJ, Wetsel WC, Augustine GJ, and Wightman RM. Synapsins differentially control dopamine and serotonin release. J Neurosci. 30: 9762–9770 2010. [DOI] [PMC free article] [PubMed] [Google Scholar]
- 11.Rice ME, Patel JC, and Cragg SJ. Dopamine release in the basal ganglia. Neuroscience. 198: 112–137 2011. [DOI] [PMC free article] [PubMed] [Google Scholar]
- 12.Low JT, Shukla A, Behrendorff N, and Thorn P. Exocytosis, dependent on Ca2+ release from Ca2+ stores, is regulated by Ca2+ microdomains. J Cell Sci. 123: 3201–3208 2010. [DOI] [PubMed] [Google Scholar]
- 13.Davis AF, Bai J, Fasshauer D, Wolowick MJ, Lewis JL, and Chapman ER. Kinetics of synaptotagmin responses to Ca2+ and assembly with the core SNARE complex onto membranes. Neuron. 24: 363–376 1999. [DOI] [PubMed] [Google Scholar]
- 14.Cho WJ, Shin L, Ren G, and Jena BP. Structure of membrane-associated neuronal SNARE complex: implication in neurotransmitter release. J Cell Mol Med. 13: 4161–4165 2009. [DOI] [PMC free article] [PubMed] [Google Scholar]
- 15.Liu Y, Sugiura Y, and Lin W. The role of Synaptobrevin1/VAMP1 in Ca2+-triggered neurotransmitter release at the mouse neuromuscular junction. J Physiol. 589: 1603–1618 2011. [DOI] [PMC free article] [PubMed] [Google Scholar]
- 16.Shi L, Quick M, Zhao Y, Weinstein H, and Javitch JA. The mechanism of a neurotransmitter:sodium symporter--inward release of Na+ and substrate is triggered by substrate in a second binding site. Mol Cell. 30: 667–677 2008. [DOI] [PMC free article] [PubMed] [Google Scholar]
- 17.Liu X, Porteous R, d’Anglemont de Tassigny X, Colledge WH, Millar R, Petersen SL, and Herbison AE. Frequency-dependent recruitment of fast amino acid and slow neuropeptide neurotransmitter release controls gonadotropin-releasing hormone neuron excitability. J Neurosci. 31: 2421–2430 2011. [DOI] [PMC free article] [PubMed] [Google Scholar]
- 18.Yoon TY, Lu X, Diao J, Lee SM, Ha T, and Shin YK. Complexin and Ca2+ stimulate SNARE-mediated membrane fusion. Nat Struct Mol Biol. 15: 707–713 2008. [DOI] [PMC free article] [PubMed] [Google Scholar]
- 19.Sakisaka T, Yamamoto Y, Mochida S, Nakamura M, Nishikawa K, Ishizaki H, Okamoto-Tanaka M, Miyoshi J, Fujiyoshi Y, Manabe T, and Takai Y. Dual inhibition of SNARE complex formation by tomosyn ensures controlled neurotransmitter release. J Cell Biol. 183: 323–337 2008. [DOI] [PMC free article] [PubMed] [Google Scholar]
- 20.Chen YA, Scales SJ, Patel SM, Doung YC, and Scheller RH. SNARE complex formation is triggered by Ca2+ and drives membrane fusion. Cell. 97: 165–174 1999. [DOI] [PubMed] [Google Scholar]
- 21.Glitsch MD. Spontaneous neurotransmitter release and Ca2+--how spontaneous is spontaneous neurotransmitter release? Cell Calcium. 43: 9–15 2008. [DOI] [PubMed] [Google Scholar]