

Abstract
The liver is an insulin-responsive organ that contributes significantly to both whole body insulin sensitivity and availability of sex steroids through the production of sex hormone binding globulin (SHBG). Our objective was to explore whether lower SHBG was associated with ectopic liver fat and mediated its effect on insulin resistance in The Study of Women’s Health Across the Nation (SWAN). A subset of midlife African American and Caucasian women from SWAN (n=208; 50.9±0.18 yrs; 71% Caucasian) had computed tomography scans to quantify visceral, subcutaneous and liver fat. Blood samples were collected and assayed for hormonal and metabolic markers. The cohort, while overweight, was generally healthy, and both liver fat and SHBG were unaffected by menopausal stage or race. Both higher liver fat and lower SHBG levels were significantly associated with higher insulin concentrations after adjustment for adiposity (r=−0.25, p<0.001 and r=−0.18, p=0.01). SHBG and liver fat had additive effects on insulin concentrations such that women with the lowest SHBG and the highest fat levels had the highest values (interaction p=0.09). The association between SHBG and insulin was more apparent among women with fattier livers. SHBG and liver fat appear to have independent effects on insulin levels as adjustment for each other did not diminish the strength of either association (p=0.023 and 0.001 respectively). These results confirmed the strong independent associations between increased liver fat and decreased SHBG with increased metabolic risk in midlife women. Further these data underscore the need for additional research into the role of liver fat in modifying SHBG’s influence on insulin levels.
Keywords: liver fat, sex hormone binding globulin, perimenopause, ectopic fat, insulin resistance
Introduction
Metabolic syndrome (MS) describes the clustering of obesity, insulin resistance and cardiovascular risk. Each component has been associated with the accumulation of ectopic fat in the liver (1). Ultimately fatty liver, also referred to as non-alcoholic fatty liver disease, is associated with atherosclerotic burden (2). Aside from increasing cardiovascular morbidity and mortality, progressive accumulation of fat in the liver can result in more serious liver disease, such as non-alcoholic steatohepatitis, cirrhosis, and neoplasia (3). Fatty liver has been considered the hepatic manifestation of MS (3); however it has been recently recognized that ectopic liver fat accumulation has independent associations with insulin resistance and the cardiovascular risk biomarkers included in the MS definition (4–6). This potentially causal relationship between liver fat and cardiometabolic disease increases the significance of epidemiological reports estimating that the prevalence of fatty liver ranges from 33 – 46% of the U.S. population (7, 8). Although incidence data are sparse, in one healthy cohort prospectively followed, 22 of 144 (15%) individuals developed fatty liver during the 8.5 year follow up period (9).
Prevalence of liver fat and its consequences for MS and cardiovascular health generally increases with adipose accumulation (1, 7, 8) and advancing age. Weight change in aging women is well documented, and the menopause transition is associated with increasing visceral adipose tissue (VAT) in particular (10). Visceral fat is also considered an ectopic fat depot highly associated with fat in the liver (11). The Study of Women’s Health Across the Nation (SWAN) represents a midlife population of women at risk for liver fat accumulation and increasing risk of developing MS (12).
Results from SWAN have indicated an important relationship between sex hormone binding globulin (SHBG) and MS components (12–14). In these reports, SHBG had a stronger relationship with obesity and metabolic disease endpoints than did estrogen or testosterone (12, 14). SHBG is a carrier protein produced by the liver. Its main function is to transport sex steroids, but it has potential insulin sensitizing effects independent of its transport function (15, 16). Recently, the ability of SHBG to predict development of diabetes has been reported in both men and women, generating new interest in this protein as a marker for the development of metabolic disease (17, 18). Sex hormones are known to change over the menopausal transition, whereas SHBG remains relatively constant (19, 20). SHBG regulation is closely tied to liver fat, and factors that promote liver lipogenesis (21, 22). In this study, we sought to extend previous SWAN findings regarding SHBG by evaluating liver fat. The purpose of this paper is to describe the relationships between sex steroids, metabolic health, and liver fat in midlife women. As SHBG has been described as predictive for diabetes development, we focused on the relationships between SHBG and glycemic measures a) fasting glucose, b) insulin, and c) homeostasis model index for insulin resistance in these midlife women. We then examine whether SHBG may explain a portion of the association between liver fat and glycemic endpoints in these midlife women, an age at which the risks of developing MS and diabetes increase.
Methods and Procedures
The SWAN is a multicenter, multiethnic, longitudinal study designed to characterize the biological and psychosocial changes that occur during the menopausal transition in a community-based sample. Details of the study design and recruitment have been previously published (23). Briefly, SWAN is being conducted at 7 sites in the areas of: Boston, MA; Chicago, IL; Detroit, MI; Los Angeles, CA; Newark, NJ; Pittsburgh, PA; and Oakland, CA. A total of 3302 women aged 42–52 years were enrolled from 1996 to 1997. The current data were derived from the SWAN Heart Study, an ancillary study designed to characterize the natural history of subclinical atherosclerosis during the menopausal transition. SWAN Heart was conducted at the Pittsburgh and Chicago SWAN sites; enrollment spanned 2000–2005, beginning 4 years after the SWAN cohort had been assembled. A total of 608 women (259 from the University of Pittsburgh and 349 from Rush University in Chicago) were enrolled in SWAN Heart.
To be eligible for SWAN Heart, participants must have undergone a carotid ultrasound scan at a previous SWAN visit or, if they had not, were required to meet the following criteria: have at least one intact ovary and an intact uterus, no evidence of clinical atherosclerosis (myocardial infarction, angina, intermittent claudication, cerebral ischemia, or revascularization), and no reported use of menopausal hormone therapy (MHT) within the prior 3 months or current use of antihypertensive or diabetes medications. For the current analysis, we included 208 Caucasian and African American women from the Pittsburgh site, for whom additional computed tomography (CT) scan analysis had been done to provide liver fat data. Women initiating antidiabetic or antihypertensive medications were retained; however, women were excluded for missing data on cardiometabolic measures and poor quality imaging studies leading to missing visceral fat distribution data. The Institutional Review Boards of the participating institutions approved this study, and all women signed informed consent at all SWAN and SWAN Heart visits.
Liver fat, abdominal VAT and SAT measurement
Abdominal adipose tissue area was measured by using an electron beam CT scan, as described elsewhere (24). Briefly, 6-mm transverse images were obtained with a c-150 Ultrafast CT Scanner (GE Imatron, San Francisco, CA). A selected slice between L4 and L5 was read by a single reader at the University of Pittsburgh. A pixel range of −30 to −190 Hounsfield units (HU) was used to define fat. The area of adipose tissue was defined by using image analysis software (AccuImage Diagnostics, South San Francisco, CA). A region-of-interest (ROI) line was drawn at the interior of the abdominal musculature, along the fascial plane. Fat within this area was considered to be VAT. Subcutaneous fat (SAT) was calculated as the difference between the whole image and the VAT. Interobserver reliability was determined by repeat reads on 10 scans, with intraclass correlation coefficient of 0.97 and 0.94 for total and visceral fat area, respectively. Liver fat was assessed using the same unenhanced CT scan as that taken for abdominal adiposity measures, with procedures similar to those previously described (25, 26) with the following modifications: a representative slice at the thoracolumbar junction was selected with 3 ROIs of 200 mm2 placed over 3 regions of the liver (right posterior, right anterior, and left medial sectors) and averaged for a final HU. CT attenuation values are inversely related to fat content such that a lower score indicates more fat content in the liver tissue. A single 100 mm2 ROI at the same slice level was placed over the spleen, and a slice chosen for the left ventricle of the heart at its maximal diameter for a single 100 mm2 ROI. The spleen and the left ventricle measures were collected as potential reference tissues for the liver density assessment. However, since spleen and left ventricular attenuation values both correlated with all measures of adiposity (BMI, waist, WHR, VAT and SAT; all p<0.001), unadjusted liver attenuation values were used in analyses. Liver fat assessments were read by a single reader at the Wake Forest School of Medicine.
Questionnaire data
Race, current smoking habits, alcohol intake and educational status were obtained from a self-reported questionnaire. Women were also asked about their menstrual bleeding patterns in the 12 months before recruitment and reproductive history, and were then classified as either; 1) pre- or early perimenopausal (menstrual periods in the past 3 months) or using MHT, or 2) late perimenopausal or postmenopausal (> 3 months amenorrhea) or hysterectomized. MHT use was ascertained by self-reported use of birth control pills, estrogen pills, estrogen injection or patch, combination estrogen and progestin, or progestin pills.
Cardiometabolic risk factors
Fasting blood samples were assayed at Medical Research Laboratories (Lexington, KY), which is certified by the National Heart, Lung, and Blood Institute, Centers for Disease Control and Prevention Part II program. Serum total cholesterol, high density lipoprotein (HDL) cholesterol, and triglycerides (TG) were measured directly; and low density lipoprotein (LDL) cholesterol was calculated by using the Friedewald equation, excluding women with concentrations of triglycerides >400 mg/dL. The homeostasis model assessment insulin resistance index (HOMA-IR) was calculated from fasting insulin and glucose as fasting insulin in μU/L multiplied by fasting glucose in mmol/L and divided by 22.5. High sensitivity C-reactive protein (CRP) levels were measured using an ultra-sensitive rate immunonephelometric method (BN 100, Dade-Behring, Marburg, Germany).
Hormonal assessments
Phlebotomy was performed in the morning after an overnight fast. Subjects were scheduled for venipuncture between days 2 to 5 of a spontaneous menstrual cycle within 60 days of the anniversary of the baseline examination date. All assays were performed on an automated analyzer (ACS-180; Bayer Diagnostics Corporation, Tarrytown, New York) using a double-antibody chemiluminescent immunoassay with a solid-phase anti-IgG immunoglobulin conjugated to paramagnetic particles, antiligand antibody, and competitive ligand labeled with dimethylacridinium ester. The estradiol assay modifies the rabbit anti–estradiol-6 ACS-180 immunoassay to increase sensitivity, with a lower limit of detection (LLD) of 1.0 pg/mL (to convert to picomoles per liter, multiply by 3.671). The testosterone assay modifies the rabbit polyclonal antitestosterone ACS-180 immunoassay, with an LLD of 2.19 ng/dL (to convert to nanomoles per liter, multiply by 0.0347). The SHBG assay was developed at the central laboratory at the University of Michigan, Ann Arbor, using rabbit anti-SHBG antibodies, with an LLD of 0.22 μg/mL (to convert to nanomoles per liter, multiply by 8.896). Duplicate estradiol assays were conducted with results reported as the arithmetic mean for each subject, with a coefficient of variation of 3% to 12%. All other assays were single determinations. Serum FSH concentrations were from a 2-site chemiluminescence immunoassay to the β subunit. Inter- and intra-assay coefficients of variation were 12.0% and 6.0%, respectively, and the lower limit of detection was 1.1 IU/L. The absolute concentrations of FSH are higher in this assay than values from many clinical laboratories, based on differences in the standards selected. An automated ACS: 180-based chemiluminescent assay was developed using Bayer Diagnostics ACS: 180 to determine the levels of dihydroepiandrosterone (DHEAS) in human serum.
Physical measures
Blood pressure (BP) was measured in the right arm with the participant seated, after >5 minutes of rest. Two sequential blood pressure values were obtained and averaged. Height and weight were measured in participants while wearing light clothing and without shoes. Body mass index (BMI) was calculated as weight in kilograms divided by height in meters squared. Waist circumference was measured with the participant wearing nonrestrictive undergarments, at the level of the natural waist, defined as the narrowest part of the torso as seen from the anterior aspect. For cases in which waist narrowing was difficult to determine, the measure was taken at the smallest horizontal circumference in the area between the ribs and the iliac crest. Waist to hip ratio (WHR) was calculated as the waist circumference divided by the largest horizontal circumference below the waist.
Statistical methods
After checking that normality assumptions, descriptive data were provided for all variables as mean and standard error (SE), or median and interquartile ranges. Pearson’s correlation coefficients were generated for all continuous variables that were normally distributed and Spearmans’s correlation coefficients were generated for those failing to meet normality assumptions. Quartiles of liver fat and SHBG were generated, and trend tests were computed to study the relations in continuous variables across increasing quartiles. Partial correlation coefficients were computed after adjustment for adiposity, or base model covariates which included menopausal status (pre and early peri-menopause/late-perimenopause or post-menopausal), cycle day of blood draw, education level (< high school/> high school), smoking (yes/no), race, hormone replacement use (yes/no), age, alcohol intake (low = < 1 drink per month; moderate = more than 1 drink per month but less than 0.3 servings from food frequency questionnaire [FFQ] data or more than 1 drink per month but less than 2 per week; or high = 0.3 or more servings from FFQ or 2 or more drinks per week) and BMI. Interaction of continuous variables was assessed via multiplicative interaction terms and significance was set at p <0.05 for all analyses. Analyses were conducted without the diabetic women (n=7) and no significant differences were observed thus results are presented with all women included. Analyses were conducted also within each racial group for comparison. All statistical analyses were carried out using Statistica V9.1 (StatSoft Inc., Tulsa, OK).
Results
Patient Characteristics
Anthropomorphic and metabolic characteristics of the subjects (Table 1) indicate that these women were mostly white and overweight, but healthy. Mean waist circumference was similar to the Adult Treatment Panel III criteria for MS; all other MS criteria were below these limits. Consistent with this is that only 4 women in this cohort were on medications for diabetes and only 7 had ever received a diagnosis of diabetes. Average liver attenuation was 56 HU, which is 10% lower (more fatty) than healthy subjects (26), although there was a wide range of values, including very fatty livers and fat-free livers (attenuation values ranging from 5 – 77 HU). No differences in liver attenuation were seen with race (p=0.16) despite black women having higher BMI and waist circumferences (p<0.05 for both). Liver attenuation was correlated with SHBG (r=0.23, p=0.001), and estrogen (r=0.15, p=0.03), but did not differ by menopausal status (p=0.57). No other sex hormone was associated with liver attenuation. SHBG concentrations did not differ by menopausal status (p=0.71) or race (p=0.97) (data not shown).
Table 1.
Characteristics of the cohort.
| Mean (SE)/Median(IQR) | |
|---|---|
| N | 208 |
| Race (%White) | 71 |
| Age (Yrs) | 50.89 (0.18) |
| Status (%) Pre/early peri -menopausal | 53.4 |
| BMI (kg/m2) | 28.76 (0.41) |
| Waist: Hip Ratio | 0.82 (0.005) |
| Waist (cm) | 88.43 (0.98) |
| Liver attenuation (HU) | 55.56 (0.77) |
| VAT (cm2) | 116.72 (4.55) |
| SAT (cm2) | 338.81 (10.15) |
| Glucose (mmol/L) | 4.83 (4.50–5.16) |
| Insulin (pmol/L) | 57.6 (47.2–81.6) |
| HOMA index | 1.76 (1.36–2.60) |
| Triglycerides (mmol/L) | 1.12 (0.88–1.58) |
| HDL cholesterol (mmol/L) | 1.51 (0.026) |
| LDL cholesterol (mmol/L) | 3.28 (2.35) |
| Systolic BP (mmHg) | 113.78 (0.066) |
| Diastolic BP (mmHg) | 72.27 (0.61) |
| CRP (ng/L) | 2.15 (0.90–5.40) |
| SHBG (nmol/L) | 49.89 (2.09) |
| FSH (mIU/mL) | 53.32 (3.17) |
| Estradiol (pg/mL) | 39.95 (17.5–83.6) |
| DHEAS (μg/dL) | 121.65 (4.61) |
| Testosterone (ng/dL) | 33.07 (1.06) |
Adiposity, glycemic parameters, and SHBG
All measures of adiposity, including liver fat as indicated by lower attenuation values, were higher with decreasing quartiles of SHBG (Table 2). Nearly all metabolic endpoints evidenced less favorable levels with decreasing quartiles of SHBG (Table 2). Although LDL cholesterol was unchanged across all quartiles, lower SHBG was associated with decreasing HDL cholesterol such that there is a relative increase in atherogenic cholesterol in the circulation.
Table 2.
Metabolic characteristics and adiposity of subjects based on quartile of sex hormone binding globulin: Mean (SE), median (IQR), or percent.
| Lower ← Sex Hormone Binding Globulin Quartiles → Higher | p-trend | ||||
|---|---|---|---|---|---|
| Q1 | Q2 | Q3 | Q4 | ||
| SHBG (nmol/L) | 18.79 (0.91) | 35.83 (0.67) | 54.02 (0.83) | 90.91 (3.46) | <0.001 |
| Race (%White) | 75 | 75 | 68 | 76 | 0.86 |
| Age (Yrs) | 50.96 (0.36) | 51.32 (0.36) | 50.48 (0.41) | 50.84 (034) | 0.45 |
| Pre/early peri-MP (%) | 60 | 55 | 68 | 57 | 0.53 |
| BMI (kg/m2 ) | 32.36 (0.80) | 29.62 (0.80) | 27.16 (0.85) | 25.96 (0.60) | <0.001 |
| Waist (cm) | 95.40 (1.75) | 91.40 (1.92) | 86.28 (2.17) | 80.66 (0.44) | <0.001 |
| Waist: Hip Ratio | 0.83 (0.01) | 0.83 (0.01) | 0.82 (0.01) | 0.79 (0.01) | <0.001 |
| VAT (cm2) | 150.15 (9.13) | 129.05 (9.12) | 109.80 (9.72) | 78.71 (5.32) | <0.001 |
| SAT (cm2) | 406.94 (19.71) | 381.94 (20.03) | 294.15 (19.22) | 271.71 (17.29) | <0.001 |
| Liver Attenuation (HU) | 53.25 (1.84) | 59.03 (1.48) | 59.48 (1.59) | 61.96 (0.99) | <0.001 |
| Triglycerides (mmol/L) | 1.36 (0.97–2.03) | 1.14 (0.79–1.58) | 1.10 (0.90–1.41) | 1.07 (0.80–1.37) | 0.0068 |
| HDL cholesterol (mmol/L) | 1.38 (0.05) | 1.45 (0.04) | 1.53 (0.05) | 1.66 (0.06) | <0.001 |
| LDL cholesterol (mmol/L) | 3.38 (0.13) | 3.12 (0.11) | 3.54 (0.14) | 3.05 (0.10) | 0.35 |
| Systolic BP (mmHg) | 115.47 (1.82) | 116.34 (2.23) | 111.15 (2.32) | 110.67 (1.95) | 0.014 |
| Diastolic BP (mmHg) | 72.59 (1.18) | 74.72 (1.23) | 71.56 (1.37) | 69.37 (0.96) | 0.011 |
| Glucose (mmol/L) | 5.11 (4.61–5.55) | 4.83 (4.50–5.05) | 4.83 (4.55–5.22) | 4.33 (4.66–4.88) | <0.001 |
| Insulin (pmol/L) | 79.2 (55.6–120) | 62.5 (50.7–87.5) | 56.6 (47.2–72.2) | 45.8 (36.1–63.2) | <0.001 |
| HOMA index | 2.52 (1.67–4.83) | 1.93 (1.55–2.61) | 1.72 (1.42–2.29) | 1.41 (1.09–1.81) | <0.001 |
| CRP (ng/mL) | 5.69 (0.83) | 4.12 (0.60) | 3.02 (0.50) | 2.65 (0.43) | <0.001 |
| Estradiol (pg/mL) | 22.25 (13.85–43.15) | 27.57 (14.55–53.15) | 54.47 (17.05–98.05) | 50.9 (39.95–109.10) | <0.001 |
| FSH (mIU/mL) | 59.77 (6.43) | 56.69 (6.65) | 47.41 (7.02) | 49.28 (5.15) | 0.19 |
| DHEAS (μg/dL) | 126.94 (8.86) | 132.45 (10.32) | 106.83 (8.88) | 119.66 (8.52) | 0.35 |
| Testosterone (ng/dL) | 33.00 (1.57) | 36.18 (2.48) | 27.87 (1.80) | 35.00 (2.32) | 0.58 |
MP = menopausal
Most metabolic variables showed a significant trend towards less healthy values with increasing liver fat, with the exception of LDL cholesterol and diastolic BP (data not shown). Further examination demonstrated that liver attenuation was significantly associated with all glycemic endpoints. Liver fat was strongly associated with insulin (r=−0.411, p<0.001), glucose (r=−0.316, p<0.001), and HOMA values (r=−0.315, p<0.001). These associations with liver fat remained significant even when VAT was accounted for (insulin r=−0.242, p<0.001; glucose r=−0.169, p=0.023; HOMA r=−0.197, p=0.009), with these relationships remaining even when other adiposity measures were adjusted for. Since lower attenuation indicates a more fatty liver, negative associations indicate that fattier livers were associated with higher values of insulin, glucose, and HOMA. Associations were strongest between liver attenuation and insulin, with adjustment for BMI or VAT resulting in the largest diminishing of the associations with liver fat. Accordingly, of all of the adiposity measures, VAT had the strongest association with liver attenuation (r=−0.51, p<0.001; Figure 1A). BMI was also strongly associated (r=−0.43, p<0.001; Figure 1B), however it should be noted that healthy fat-free livers were present in individuals of BMI > 40 kg/m2 and fatty liver was present in individuals that were only moderately overweight. Stage of menopause was not significantly associated with either the amount of VAT or liver fat measured (p=0.93 and 0.17, respectively).
Figure 1.

Association of liver fat content as measured by computed tomography (in Hounsfield units [HU]) and (A) visceral adipose tissue (VAT; r = −0.51, p<0.001) and (B) and body mass index (BMI; r = −0.43, p<0.001). Higher attenuation values in HU indicates less fat content of the liver.
Interaction between SHBG and liver fat on insulin levels
The relationships of SHBG and liver attenuation with glycemic endpoints were assessed using partial correlations adjusted for base covariates, VAT, and each other (Table 3). Insulin was moderately associated with liver attenuation, and weakly associated with SHBG. Adjustment for VAT did not alter these relationships. Neither adjustment of SHBG in the association of estimated liver fat and insulin, nor the adjustment of liver fat in the association of SHBG and insulin, appreciably altered the magnitude of the correlation coefficient, suggesting that liver fat and SHBG may be influencing insulin through separate pathways. Because liver fat and SHBG were both associated with insulin independently of adiposity, we examined the interaction between quartiles of liver attenuation and SHBG (Figure 2). Significant trends were present for both SHBG and liver attenuation. Although the interaction did not reach significance (p=0.09), one interpretation of the data suggests modification of the association between SHBG and insulin by liver fat, because with the inverse effect of SHBG levels on insulin concentrations really only becoming apparent across the higher levels of liver fat (represented as lower attenuation values). This was further supported by calculation of partial correlation coefficients between SHBG and insulin, stratified by quartiles of liver attenuation and adjusted for the factors listed above known to affect metabolic health. The fattier liver quartiles had associations that were moderate (r=−0.29, p=0.06 and r=−0.12, p=0.12 for quartiles 1 and 2 respectively), and healthier livers showed no relationship (r=−0.09, p=0.56 and r=−0.09, p=0.60 for quartiles 3 and 4 respectively) between SHBG and insulin.
Table 3.
Partial correlations of liver fat and SHBG with glycemic indices. The partial correlation coefficient is shown with p-values adjusted for base covariatesa, and regional adipose tissue as indicated.
| HOMA | Insulin | Glucose | ||
|---|---|---|---|---|
| SHBG | Base Modela | − 0.14 (p=0.066) | − 0.18 (p=0.013) | − 0.15 (p=0.045) |
| Base Model+VAT | − 0.13 (p=0.066) | − 0.16 (p=0.030) | − 0.14 (p=0.057) | |
| Base Model+Liver fat | − 0.13 (p=0.080) | − 0.17 (p=0.023) | − 0.14 (p=0.051) | |
| Liver attenuation | Base Modela | − 0.14 (p=0.052) | − 0.25 (p=0.001) | − 0.14 (p=0.051) |
| Base Model+VAT | − 0.14 (p=0.056) | − 0.22 (p=0.002) | − 0.12 (p=0.093) | |
| Base Model+SHBG | − 0.13 (p=0.080) | − 0.23 (p=0.001) | − 0.13 (p=0.072) |
Base model covariates: menopausal status, cycle day of blood draw, education, smoking, race, hormone therapy, alcohol intake, age and BMI.
Figure 2.

Relationship between liver fat and sex hormone binding globulin (SHBG) on fasting insulin levels in healthy, overweight perimenopausal women, by quartiles of liver fat and SHBG.
Discussion
Our results suggest that SHBG and ectopic liver fat may each be important in modulating circulating insulin in healthy peri- and post-menopausal women, as we report independent associations of each with circulating insulin. We report also for the first time the effects of liver fat and endogenous hormonal profile on metabolic endpoints. SHBG levels were consistent across race and menopausal stage, were influenced by liver fat, and were associated with insulin concentrations. Elevated fasting insulin values characterize a prediabetic state (27) and are a consistent feature of patients at risk for MS or prediabetes (28, 29), as well as normoglycemic persons who go on to develop diabetes in the future.
Hepatic steatosis is significant for public health because it is associated with insulin resistance and type 2 diabetes development (4–6, 30, 31). We report that in perimenopausal women, liver fat was associated with all glycemic endpoints, even after adjustment for VAT and other adiposity measures. Hepatic fat content is comparable in perimenopausal-aged women and men (11) and the specific contribution of liver fat to whole body insulin sensitivity has been demonstrated in small studies of obese men and women matched on fat depots. No differences in insulin sensitivity between variably obese patients matched on hepatic triglyceride content have been seen (5); while in contrast, obese patients who were matched on VAT demonstrated that high liver fat had dramatically lower hepatic and whole body insulin sensitivity (4). In other investigations, liver fat has been a highly significant and independent predictor of circulating insulin even after adjustment for BMI (11). In a reverse association study, insulin and alanine transferase levels (representing liver injury) were predictive of fatty liver (8). Further supportive evidence is found in lipoatrophic humans, and lipoatrophic animal models, where other fat depots are absent, but ectopic fat in the liver is still present and insulin resistance is an important phenotype (32).
Lipogenic factors, such as simple carbohydrates, have recently been shown to decrease SHBG specifically in the liver, through reduced hepatic nuclear factor 4α. This hepatocyte signaling pathway is independent of insulin and has a rapid time course, with changes in plasma SHBG concentrations occurring within days of increasing or decreasing monosaccharide exposure (22). The same signaling pathway is implicated in response to thyroid hormone, which increases SHBG secretion from the liver; this may be a direct effect or secondary to reduced liver fat that results from thyroid hormone exposure (21). Thus both in vitro and animal studies show that the more liver fat that is present, the less SHBG is secreted into the circulation. A larger prospective study that quantified changes in liver fat, insulin sensitivity and SHBG in men and women also showed a strong correlation between changes in liver fat and SHBG concentration (15). Our data support this concept, as we report a strong association between SHGB and liver fat that is almost identical in magnitude to associations seen in patients populations who had liver fat determined by the more sensitive magnetic resonance imaging (MRI) method (33, 34). Despite the influence of liver fat on SHBG levels, our results demonstrated that SHBG was associated with insulin independently of liver fat.
Fat accumulation in the liver was also associated with insulin independently of SHBG. Accumulation of adipose tissue during the menopausal transition has been considered a central cause for increased cardiometabolic disease risk in aging women. In longitudinal data from SWAN, early stages of menopause were associated with increasing waist circumference and risk for MS (12), and the magnitude of weight gain across the transition determined the risk for development of insulin resistance (28). This risk is related to decreasing estrogen and SHBG (10, 12). In large randomized clinical trials, estrogen-containing hormone therapy reduced diabetes incidence (35, 36), which has been considered the result, in part, of increased SHBG concentrations. Estrogen has no in vitro effect on SHBG (37), but estrogen therapy has significant effects on liver triglyceride content in the absence of changes in total body weight (38). This is consistent with our results regarding the interaction of liver fat and SHBG and the observation that estrogen and liver fat were associated, however SHBG and not estrogen was associated with any of the measured glycemic variables (data not shown). In our study of healthy women, we did not see differences in specific fat depots or SHBG, and their associations, across menopausal stages. We found significant relationships between fat depots and SHBG and further, SHBG and liver fat were associated with circulating insulin across the transition. Therefore, we propose that the menopausal transition may not result in changes in insulin sensitivity if adipose accumulation is avoided and SHBG levels maintained, as has been suggested by Guthrie et al. (28) and Akin et al. (20).
The mechanism by which lower SHBG decreases insulin sensitivity is largely unknown although the association between insulin resistance and SHBG, independent of body weight or BMI, is seen consistently in postmenopausal women and men (14, 19, 29). SHBG is able to bind directly to cellular receptors independently of the estrogen or androgen it is transporting in the circulation. The actual receptor is not fully elucidated but is known to be from the G-coupled superfamily, with induction of cyclic adenosine monophosphate upon binding, potentially leading to glucose uptake and improved insulin sensitivity (16). Alternatively, SHBG may interfere with normal cytokine signaling via soluble glycoprotein 130 (39). Concentrations of SHBG approximating 30% that of healthy controls (or a difference of 16–17 nmol/L) have been estimated as the difference between normal and insulin resistant or diabetic individuals (17, 18). This represents the approximate difference between the lowest quartile of SHBG that we report and the overall SHBG average reported for the entire SWAN cohort (14). Women in this lowest quartile were notably more insulin resistant (as indicated by HOMA-IR, fasting insulin and glucose), than the rest of the women included in this report.
A working model relating, liver fat, SHBG and insulin sensitivity is presented in Figure 3. In this proposed model, most women gain and redistribute body fat to VAT and other ectopic depots with age. Increasing body weight will result in some fat partitioning to the liver. Our data suggests that higher levels of liver fat possibly reduces the production of SHBG (4, 22) and impair hepatic and whole body insulin sensitivity. An early response to reduced insulin sensitivity is production of more insulin to maintain normoglycemia; however, high insulin concentrations are initially secreted into the portal circulation where hepatocytes are the first cells exposed. Insulin extraction from the portal circulation by the liver causes insulin receptor activation and lipogenic effects, which further drives fat accumulation and potential reductions in SHBG. The contribution of SHBG to peripheral insulin sensitivity is unknown, however our data and epidemiological evidence suggests it may have a role independent of it being a signal for liver fat. With relative nutrient excess, this negative cycling of liver and peripheral insulin sensitivity continues over time until eventual consequences such as MS, diabetes, or steatohepatitis develop. The suggestion that SHBG is proximate in effect to changes in insulin sensitivity is supported by dietary interventions which show that in response to short-term reduced dietary fat and total calories, plasma SHBG concentrations increase without changing circulating insulin (40).
Figure 3.
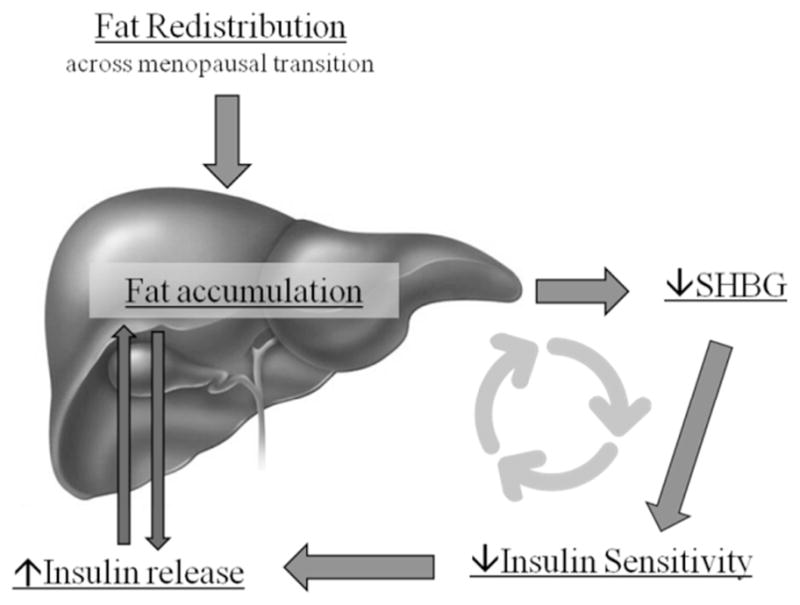
Proposed working model for the interplay between ectopic liver fat and sex hormone binding protein (SHBG) and its effects on insulin release and insulin sensitivity.
A limitation of hepatic steatosis assessment by CT is that at present there is no consensus regarding the attenuation value that constitutes a diagnosis of fatty liver. In this study, when results are divided into quartiles of liver fat, it is likely that only the first quartile represents women with fatty liver, or liver predicted to have greater than 20% content as TG (25). This quartile included women that were less healthy by most metabolic indices, and was where SHBG seemed to have an effect on insulin levels. Determination of liver fat by CT attenuation also has limited sensitivity at lower grades of hepatic steatosis (<20%), however has comparable or better specificity than MRI (33). Our liver fat and SHBG association agrees almost perfectly with a report of MRI data and SHBG in a cohort of 114 patients and confers greater confidence in the outcomes reported from the current study. Other limitations to our study include the relatively small sample size and limited ethnicities represented. The cross-sectional study design does not allow causal relationships to be deduced. We also did not include dietary factors in our models, both of may have been a mediating factor for liver fat in this population of women. However, this study includes the measurement of multiple fat depots in a well-characterized group of women undergoing the menopausal transition.
Despite the relative good health of these women, we report that increasing liver fat specifically relates to insulin resistance, as indicated by circulating insulin concentrations. Liver fat was associated with SHBG, which also in part determined insulin levels, but this relationship was not the primary pathway through which liver fat influenced circulating insulin. Liver fat and SHBG appear to independently influence insulin levels, although the possibility that an interaction between these factors when high liver fat is present does exist, as our data suggest that SHBG may play a more prominent role in women with fattier livers. In conclusion, these data suggest that hyperinsulinism and related insulin resistance are related to SHBG levels and liver fat in midlife women and thus decreased SHBG and increased liver fat have the potential to be used as biomarkers of increasing metabolic disease seen in post-menopausal women.
Acknowledgments
Kavanagh is supported by K01AG 033641. The Study of Women’s Health Across the Nation (SWAN) has grant support from the National Institutes of Health (NIH), DHHS, through the National Institute on Aging (NIA), the National Institute of Nursing Research (NINR) and the NIH Office of Research on Women’s Health (ORWH) (Grants NR004061; AG012505, AG012535, AG012531, AG012539, AG012546, AG012553, AG012554, AG012495). The SWAN Heart Study was supported by the National Heart, Lung, and Blood Institute (Grants HL065581 and HL065591). The Chicago site of the SWAN Heart Study is also supported by the Charles J. and Margaret Roberts Trust. The content of this article is solely the responsibility of the authors and does not necessarily represent the official views of the NIA, NINR, ORWH or the NIH.
Clinical Centers: University of Michigan, Ann Arbor – Siobán Harlow, PI 2011, MaryFran Sowers, PI 1994–2011; Massachusetts General Hospital, Boston, MA – Joel Finkelstein, PI 1999 – present; Robert Neer, PI 1994 – 1999; Rush University, Rush University Medical Center, Chicago, IL – Howard Kravitz, PI 2009 – present; Lynda Powell, PI 1994 – 2009; University of California, Davis/Kaiser – Ellen Gold, PI; University of California, Los Angeles – Gail Greendale, PI; Albert Einstein College of Medicine, Bronx, NY – Carol Derby, PI 2011, Rachel Wildman, PI 2010 – 2011; Nanette Santoro, PI 2004 – 2010; University of Medicine and Dentistry – New Jersey Medical School, Newark – Gerson Weiss, PI 1994 – 2004; and the University of Pittsburgh, Pittsburgh, PA – Karen Matthews, PI.
NIH Program Office: National Institute on Aging, Bethesda, MD – Sherry Sherman 1994 – present; Marcia Ory 1994 – 2001; National Institute of Nursing Research, Bethesda, MD – Program Officers.
Central Laboratory: University of Michigan, Ann Arbor – Daniel McConnell (Central Ligand Assay Satellite Services).
Coordinating Center: University of Pittsburgh, Pittsburgh, PA – Kim Sutton-Tyrrell, PI 2001 – present; New England Research Institutes, Watertown, MA - Sonja McKinlay, PI 1995 – 2001.
Steering Committee: Susan Johnson, Current Chair
Chris Gallagher, Former Chair
We thank the study staff at each site and all the women who participated in SWAN.
References
- 1.McKimmie RL, Daniel KR, Carr JJ, Bowden DW, Freedman BI, Register TC, et al. Hepatic steatosis and subclinical cardiovascular disease in a cohort enriched for type 2 diabetes: the Diabetes Heart Study. Am J Gastroenterol. 2008 Dec;103(12):3029–35. doi: 10.1111/j.1572-0241.2008.02188.x. [DOI] [PMC free article] [PubMed] [Google Scholar]
- 2.Sookoian S, Pirola CJ. Non-alcoholic fatty liver disease is strongly associated with carotid atherosclerosis: a systematic review. J Hepatol. 2008 Oct;49(4):600–7. doi: 10.1016/j.jhep.2008.06.012. [DOI] [PubMed] [Google Scholar]
- 3.Bellentani S, Scaglioni F, Marino M, Bedogni G. Epidemiology of non-alcoholic fatty liver disease. Dig Dis. 2010;28(1):155–61. doi: 10.1159/000282080. [DOI] [PubMed] [Google Scholar]
- 4.Fabbrini E, Magkos F, Mohammed BS, Pietka T, Abumrad NA, Patterson BW, et al. Intrahepatic fat, not visceral fat, is linked with metabolic complications of obesity. Proc Natl Acad Sci U S A. 2009 Sep 8;106(36):15430–5. doi: 10.1073/pnas.0904944106. [DOI] [PMC free article] [PubMed] [Google Scholar]
- 5.Magkos F, Fabbrini E, Mohammed BS, Patterson BW, Klein S. Increased whole-body adiposity without a concomitant increase in liver fat is not associated with augmented metabolic dysfunction. Obesity (Silver Spring) 2010 Aug;18(8):1510–5. doi: 10.1038/oby.2010.90. [DOI] [PMC free article] [PubMed] [Google Scholar]
- 6.Nguyen-Duy TB, Nichaman MZ, Church TS, Blair SN, Ross R. Visceral fat and liver fat are independent predictors of metabolic risk factors in men. Am J Physiol Endocrinol Metab. 2003 Jun;284(6):E1065–71. doi: 10.1152/ajpendo.00442.2002. [DOI] [PubMed] [Google Scholar]
- 7.Szczepaniak LS, Nurenberg P, Leonard D, Browning JD, Reingold JS, Grundy S, et al. Magnetic resonance spectroscopy to measure hepatic triglyceride content: prevalence of hepatic steatosis in the general population. Am J Physiol Endocrinol Metab. 2005 Feb;288(2):E462–8. doi: 10.1152/ajpendo.00064.2004. [DOI] [PubMed] [Google Scholar]
- 8.Williams CD, Stengel J, Asike MI, Torres DM, Shaw J, Contreras M, et al. Prevalence of nonalcoholic fatty liver disease and nonalcoholic steatohepatitis among a largely middle-aged population utilizing ultrasound and liver biopsy: a prospective study. Gastroenterology. 2011 Jan;140(1):124–31. doi: 10.1053/j.gastro.2010.09.038. [DOI] [PubMed] [Google Scholar]
- 9.Bedogni G, Miglioli L, Masutti F, Castiglione A, Croce LS, Tiribelli C, et al. Incidence and natural course of fatty liver in the general population: the Dionysos study. Hepatology. 2007 Nov;46(5):1387–91. doi: 10.1002/hep.21827. [DOI] [PubMed] [Google Scholar]
- 10.Janssen I, Powell LH, Kazlauskaite R, Dugan SA. Testosterone and visceral fat in midlife women: the Study of Women’s Health Across the Nation (SWAN) fat patterning study. Obesity (Silver Spring) 2010 Mar;18(3):604–10. doi: 10.1038/oby.2009.251. [DOI] [PMC free article] [PubMed] [Google Scholar]
- 11.Westerbacka J, Corner A, Tiikkainen M, Tamminen M, Vehkavaara S, Hakkinen AM, et al. Women and men have similar amounts of liver and intra-abdominal fat, despite more subcutaneous fat in women: implications for sex differences in markers of cardiovascular risk. Diabetologia. 2004 Aug;47(8):1360–9. doi: 10.1007/s00125-004-1460-1. [DOI] [PubMed] [Google Scholar]
- 12.Janssen I, Powell LH, Crawford S, Lasley B, Sutton-Tyrrell K. Menopause and the metabolic syndrome: the Study of Women’s Health Across the Nation. Arch Intern Med. 2008 Jul 28;168(14):1568–75. doi: 10.1001/archinte.168.14.1568. [DOI] [PMC free article] [PubMed] [Google Scholar]
- 13.Janssen I, Powell LH, Kazlauskaite R, Dugan SA. Testosterone and Visceral Fat in Midlife Women: The Study of Women’s Health Across the Nation (SWAN) Fat Patterning Study. Obesity (Silver Spring) 2009 Aug 20; doi: 10.1038/oby.2009.251. [DOI] [PMC free article] [PubMed] [Google Scholar]
- 14.Sutton-Tyrrell K, Wildman RP, Matthews KA, Chae C, Lasley BL, Brockwell S, et al. Sex-hormone-binding globulin and the free androgen index are related to cardiovascular risk factors in multiethnic premenopausal and perimenopausal women enrolled in the Study of Women Across the Nation (SWAN) Circulation. 2005 Mar 15;111(10):1242–9. doi: 10.1161/01.CIR.0000157697.54255.CE. [DOI] [PubMed] [Google Scholar]
- 15.Peter A, Kantartzis K, Machann J, Schick F, Staiger H, Machicao F, et al. Relationships of circulating sex hormone-binding globulin with metabolic traits in humans. Diabetes. 2010 Dec;59(12):3167–73. doi: 10.2337/db10-0179. [DOI] [PMC free article] [PubMed] [Google Scholar]
- 16.Heinlein CA, Chang C. The roles of androgen receptors and androgen-binding proteins in nongenomic androgen actions. Mol Endocrinol. 2002 Oct;16(10):2181–7. doi: 10.1210/me.2002-0070. [DOI] [PubMed] [Google Scholar]
- 17.Ding EL, Song Y, Malik VS, Liu S. Sex differences of endogenous sex hormones and risk of type 2 diabetes: a systematic review and meta-analysis. JAMA. 2006 Mar 15;295(11):1288–99. doi: 10.1001/jama.295.11.1288. [DOI] [PubMed] [Google Scholar]
- 18.Jayagopal V, Kilpatrick ES, Jennings PE, Hepburn DA, Atkin SL. The biological variation of testosterone and sex hormone-binding globulin (SHBG) in polycystic ovarian syndrome: implications for SHBG as a surrogate marker of insulin resistance. J Clin Endocrinol Metab. 2003 Apr;88(4):1528–33. doi: 10.1210/jc.2002-020557. [DOI] [PubMed] [Google Scholar]
- 19.Akin F, Bastemir M, Alkis E, Kaptanoglu B. SHBG levels correlate with insulin resistance in postmenopausal women. Eur J Intern Med. 2009 Mar;20(2):162–7. doi: 10.1016/j.ejim.2007.09.023. [DOI] [PubMed] [Google Scholar]
- 20.Akin F, Bastemir M, Alkis E. Effect of insulin sensitivity on SHBG levels in premenopausal versus postmenopausal obese women. Adv Ther. 2007 Nov-Dec;24(6):1210–20. doi: 10.1007/BF02877767. [DOI] [PubMed] [Google Scholar]
- 21.Selva DM, Hammond GL. Thyroid hormones act indirectly to increase sex hormone-binding globulin production by liver via hepatocyte nuclear factor-4alpha. J Mol Endocrinol. 2009 Jul;43(1):19–27. doi: 10.1677/JME-09-0025. [DOI] [PubMed] [Google Scholar]
- 22.Selva DM, Hogeveen KN, Innis SM, Hammond GL. Monosaccharide-induced lipogenesis regulates the human hepatic sex hormone-binding globulin gene. J Clin Invest. 2007 Dec;117(12):3979–87. doi: 10.1172/JCI32249. [DOI] [PMC free article] [PubMed] [Google Scholar]
- 23.Sowers M. Design, survey sampling and recruitment methods of SWAN: a multi-cetner, multi-ethnic community-based cohort study of women and the menopausal transition. In: Lobos RMR, Kelsey JL, editors. Menopause: biology and pathobiology. San Diego: Academic Press; 2000. pp. 175–88. [Google Scholar]
- 24.Vega GL, Adams-Huet B, Peshock R, Willett D, Shah B, Grundy SM. Influence of body fat content and distribution on variation in metabolic risk. J Clin Endocrinol Metab. 2006 Nov;91(11):4459–66. doi: 10.1210/jc.2006-0814. [DOI] [PubMed] [Google Scholar]
- 25.Kodama Y, Ng CS, Wu TT, Ayers GD, Curley SA, Abdalla EK, et al. Comparison of CT methods for determining the fat content of the liver. AJR Am J Roentgenol. 2007 May;188(5):1307–12. doi: 10.2214/AJR.06.0992. [DOI] [PubMed] [Google Scholar]
- 26.Davidson LE, Kuk JL, Church TS, Ross R. Protocol for measurement of liver fat by computed tomography. J Appl Physiol. 2006 Mar;100(3):864–8. doi: 10.1152/japplphysiol.00986.2005. [DOI] [PubMed] [Google Scholar]
- 27.Tabak AG, Jokela M, Akbaraly TN, Brunner EJ, Kivimaki M, Witte DR. Trajectories of glycaemia, insulin sensitivity, and insulin secretion before diagnosis of type 2 diabetes: an analysis from the Whitehall II study. Lancet. 2009 Jun 27;373(9682):2215–21. doi: 10.1016/S0140-6736(09)60619-X. [DOI] [PMC free article] [PubMed] [Google Scholar]
- 28.Guthrie JR, Ball M, Dudley EC, Garamszegi CV, Wahlqvist ML, Dennerstein L, et al. Impaired fasting glycaemia in middle-aged women: a prospective study. Int J Obes Relat Metab Disord. 2001 May;25(5):646–51. doi: 10.1038/sj.ijo.0801569. [DOI] [PubMed] [Google Scholar]
- 29.Jansson PA, Eliasson B, Lindmark S, Eriksson JW. Endocrine abnormalities in healthy first-degree relatives of type 2 diabetes patients--potential role of steroid hormones and leptin in the development of insulin resistance. Eur J Clin Invest. 2002 Mar;32(3):172–8. doi: 10.1046/j.1365-2362.2002.00963.x. [DOI] [PubMed] [Google Scholar]
- 30.Hanley AJ, Williams K, Festa A, Wagenknecht LE, D’Agostino RB, Jr, Kempf J, et al. Elevations in markers of liver injury and risk of type 2 diabetes: the insulin resistance atherosclerosis study. Diabetes. 2004 Oct;53(10):2623–32. doi: 10.2337/diabetes.53.10.2623. [DOI] [PubMed] [Google Scholar]
- 31.Vozarova B, Stefan N, Lindsay RS, Saremi A, Pratley RE, Bogardus C, et al. High alanine aminotransferase is associated with decreased hepatic insulin sensitivity and predicts the development of type 2 diabetes. Diabetes. 2002 Jun;51(6):1889–95. doi: 10.2337/diabetes.51.6.1889. [DOI] [PubMed] [Google Scholar]
- 32.Reitman ML, Arioglu E, Gavrilova O, Taylor SI. Lipoatrophy revisited. Trends Endocrinol Metab. 2000 Dec;11(10):410–6. doi: 10.1016/s1043-2760(00)00309-x. [DOI] [PubMed] [Google Scholar]
- 33.Bohte AE, van Werven JR, Bipat S, Stoker J. The diagnostic accuracy of US, CT, MRI and 1H-MRS for the evaluation of hepatic steatosis compared with liver biopsy: a meta-analysis. Eur Radiol. 2011 Jan;21(1):87–97. doi: 10.1007/s00330-010-1905-5. [DOI] [PMC free article] [PubMed] [Google Scholar]
- 34.Stefan N, Schick F, Haring HU. Sex hormone-binding globulin and risk of type 2 diabetes. N Engl J Med. 2009 Dec 31;361(27):2675–6. doi: 10.1056/NEJMc0910143. author reply 7-8. [DOI] [PubMed] [Google Scholar]
- 35.Kanaya AM, Herrington D, Vittinghoff E, Lin F, Grady D, Bittner V, et al. Glycemic effects of postmenopausal hormone therapy: the Heart and Estrogen/progestin Replacement Study. A randomized, double-blind, placebo-controlled trial. Ann Intern Med. 2003 Jan 7;138(1):1–9. doi: 10.7326/0003-4819-138-1-200301070-00005. [DOI] [PubMed] [Google Scholar]
- 36.Margolis KL, Bonds DE, Rodabough RJ, Tinker L, Phillips LS, Allen C, et al. Effect of oestrogen plus progestin on the incidence of diabetes in postmenopausal women: results from the Women’s Health Initiative Hormone Trial. Diabetologia. 2004 Jul;47(7):1175–87. doi: 10.1007/s00125-004-1448-x. [DOI] [PubMed] [Google Scholar]
- 37.Crave JC, Lejeune H, Brebant C, Baret C, Pugeat M. Differential effects of insulin and insulin-like growth factor I on the production of plasma steroid-binding globulins by human hepatoblastoma-derived (Hep G2) cells. J Clin Endocrinol Metab. 1995 Apr;80(4):1283–9. doi: 10.1210/jcem.80.4.7536204. [DOI] [PubMed] [Google Scholar]
- 38.Kavanagh K, Davis MA, Zhang L, Wilson MD, Register TC, Adams MR, et al. Estrogen decreases atherosclerosis in part by reducing hepatic acyl-CoA: cholesterol acyltransferase 2 (ACAT2) in monkeys. Arterioscler Thromb Vasc Biol. 2009 Oct;29(10):1471–7. doi: 10.1161/ATVBAHA.109.191825. [DOI] [PMC free article] [PubMed] [Google Scholar]
- 39.Nikolajuk A, Kowalska I, Karczewska-Kupczewska M, Adamska A, Otziomek E, Wolczynski S, et al. Serum soluble glycoprotein 130 concentration is inversely related to insulin sensitivity in women with polycystic ovary syndrome. Diabetes. 2010 Apr;59(4):1026–9. doi: 10.2337/db09-1316. [DOI] [PMC free article] [PubMed] [Google Scholar]
- 40.Blouin K, Robitaille J, Belanger C, Fontaine-Bisson B, Couture P, Vohl MC, et al. Effect of a six-week national cholesterol education program step 1 diet on plasma sex hormone-binding globulin levels in overweight premenopausal women. Metab Syndr Relat Disord. 2007 Spring;5(1):22–33. doi: 10.1089/met.2006.0005. [DOI] [PubMed] [Google Scholar]