Abstract
In a previous study, we reported the upper limit of Young’s modulus of the unprotected protein at the dentin/adhesive interface to be 2 GPa. In this study, to obtain a more exact value of the moduli of the components at the d/a interface, we used demineralized dentin collagen with and without adhesive infiltration. The prepared samples were analyzed using micro-Raman spectroscopy (µRS) and scanning acoustic microscopy (SAM). Using an Olympus UH3 SAM (Olympus Co., Tokyo), measurements were recorded with a 400 MHz burst mode lens (120° aperture angle; nominal lateral resolution, 2.5 µm). A series of calibration curves were prepared using the relationship between the ultrasonically measured elastic moduli of a set of known materials and their SAM response. Finally, both the bulk and bar wave elastic moduli were computed for a set of 13 materials, including polymers, ceramics, and metals. These provided the rationale for using extensional wave measurements of the elastic moduli as the basis for extrapolation of the 400 MHz SAM data to obtain Young’s moduli for the samples: E = 1.76 ± 0.00 GPa for the collagen alone; E = 1.84 ± 0.65 GPa for the collagen infiltrated with adhesive; E = 3.4 ± 1.00 GPa for the adhesive infiltrate.
Keywords: scanning acoustic microscopy, Young’s modulus, demineralized dentin collagen, dentin adhesive, calibration curves
INTRODUCTION
Micro-raman technique
In the broadest sense the Raman effect involves the scattering of light as a result of its interaction with matter. When monochromatic light from a laser strikes a sample, almost all of the light is scattered elastically. This is known as Rayleigh scattering and certainly is the strongest component of the scattered radiation. A small fraction of the light is scattered inelastically; that is, there is an energy transfer between the incident light and the scattering molecules. This change in energy or frequency between the incident and scattered light corresponds to an excitation of the molecular system, most often in a vibrational mode. The Raman spectrum represents the intensity of the scattered photons as a function of the difference in frequency. It is similar to an infrared spectrum in that it provides a “fingerprint” of the molecules present within the sample and can be used for qualitative identification and quantitative determination.1,2
By combining spectroscopy with microscopy, Raman microspectroscopy (µRS) can be used to detect and quantify the molecular chemistry of microscopic samples. Using this technique, an investigator can detect compound-specific molecules from a sample without spectral interference from H2O and at a lateral spatial resolution of approximately 1 µm.3 Samples can be analyzed directly, in air or water, at room temperature and pressure, wet or dry, without being destroyed. It is an exceptional tool for investigating the chemistry of material/tissue interfaces because it does not rely on homogenization, extraction, or dilution, but rather each structure is analyzed in situ. We have used µRS to quantify the diffusion of single-bottle adhesives into the “wet” demineralized dentin matrix4,5 to determine for the first time the molecular structure of acid-etched smear layers6 and smear debris,7 and to quantify demineralization in hydrated dentin specimens.6
Scanning acoustic microscopy technique
Scanning acoustic microscopy (SAM) is a powerful experimental tool for examining the acoustic, and thus the elastic, properties of materials at resolutions approaching fractions of a micron. We have used this technique in collaboration with µRS to determine the micromechanics and molecular structure of unprotected protein at the dentin/adhesive interface.8
The elastic modulus for dentin ranged from 13 GPa (partially demineralized) to 28 GPa (fully mineralized) and for unprotected collagen at the interface, <2 GPa. The elastic modulus of the adhesive was 5 GPa; this was measured on a sample composed solely of Single Bond adhesive.8 The data from the dentin/adhesive interface were correlated with the µRS results, with the lowest value corresponding with the region of the interface that is spectroscopically dominated by features associated with type I collagen from the demineralized dentin matrix (Fig. 1).
Figure 1.
Light micrograph and corresponding Raman spectra of the dentin/Single Bond adhesive interface. The spectra were recorded from sites corresponding to the demarcations noted on the light micrograph.
The combination of optical, µRS and SAM provided the means for correlating morphology characteristics and molecular structure with the elastic properties of the d/a interface.8,9 The distinct advantages of the juxtaposition of these techniques include the capacity to determine elastic properties without destroying the specimen, the ability to determine these properties at an interface at a resolution comparable to optical microscopy, and the capability of determining these properties on not only the same specimen but the same small region of the dentin/adhesive interface.
A unique advantage of SAM in a study of the elastic properties of biologic tissues is that a liquid couplant must be used to transmit the acoustic signal from the lens system to the specimen being studied. The liquid couplant inhibits desiccation and heat generation in the biologic tissue during measurement; both of these factors, that is, drying and heating, may change the properties of biologic tissues. Thus with this technique, it is possible to obtain the micromechanical properties of fresh as well as embedded specimens.
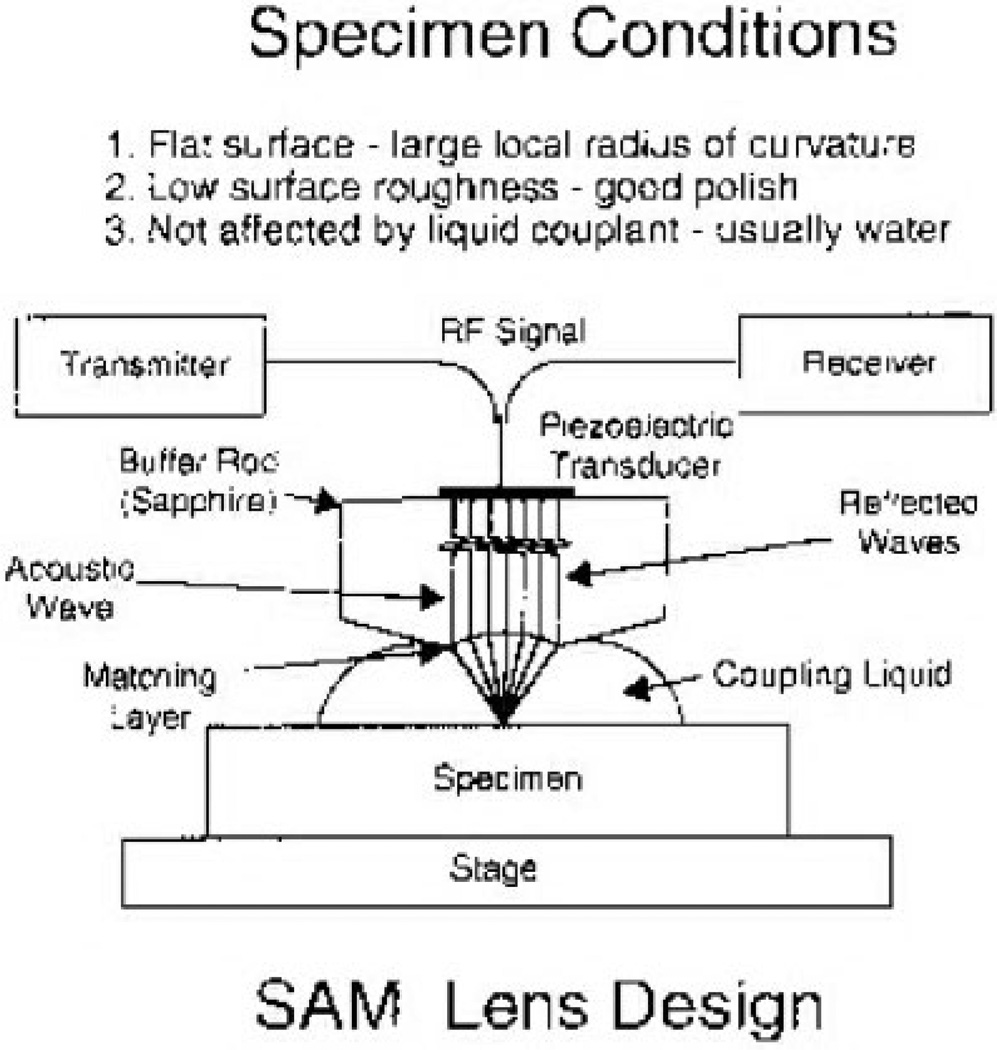
SAM differs from traditional bulk wave propagation techniques in that the heart of the system is a focusing lens (see Fig. 2). A radio frequency (RF) signal generated by the transmitter excites a piezoelectric transducer mounted on the top end of a high-quality sapphire single-crystal buffer rod. The piezoelectric transducer converts the RF signal into an acoustic wave that is made to converge by the lens and propagate onto the sample through the liquid couplant (see Fig. 2).
Figure 2.
Lens design for SAM, illustrating method of operation.8
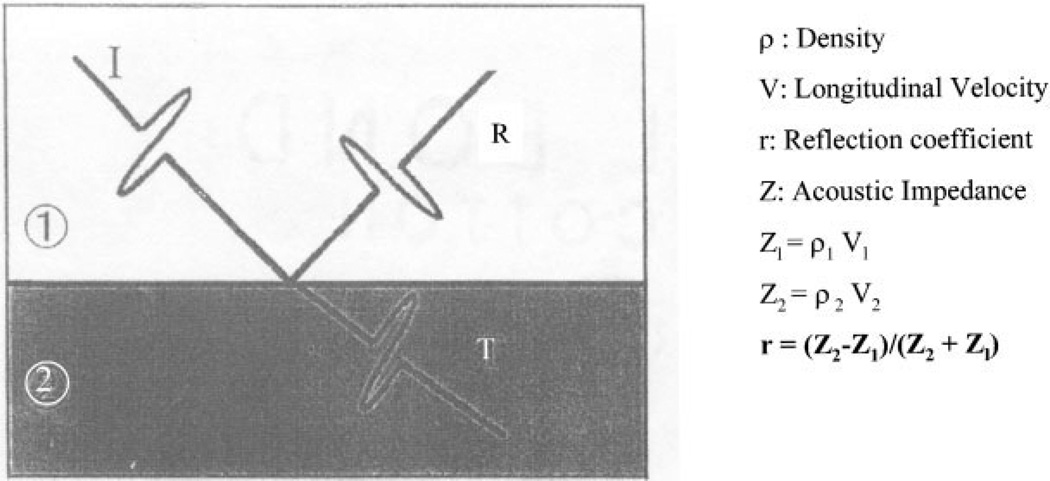
Upon reaching the liquid/sample interface, a portion of the acoustic signal is reflected back to the lens, now acting as a receiver, which transforms the acoustic signal back into a voltage (V) proportional to the signal (see Fig. 3). This voltage is stored in memory and displayed on a monitor as a pixel of a given gray level proportional to V.
Figure 3.
Illustration showing the relationship between acoustic impedance, Z, and reflection coefficient, υ. I represents the incident ultrasonic wave, R the reflected wave, and T the transmitted wave.8
The lens is then rastered over the sample, repeating the process pixel by pixel to obtain an acoustic image of the desired area. The SAM acoustic wave penetrates the surface of the specimen a fraction of a micron. The acoustic parameter that determines the voltage, and thus the gray level, is a dimensionless number, less than 1, the reflection coefficient, r, where r = (Z2 − Z1)/(Z2 + Z1).
Z is the acoustic impedance (AI). The acoustic impedance is the product of the local density (ρ) at the point on the material and υ the longitudinal (dilatational) velocity; thus Z = ρv (Fig. 3); AI is measured in Rayls. For example, water at 0°C has a value Z = 1.40 Mrayl, while at body temperature, 37°C, Z = 1.51 Mrayl. This difference is due to the variation in water’s acoustic properties with temperature. Dentin has an AI of Z = ≈7.5 Mrayl, which calculates to a reflection coefficient of r = 0.67 in water at 37°C. It is the r value at each point measured on the sample that determines the shade of gray at the corresponding pixel on the monitor. A dark gray level represents a lower value of AI (and thus of Young’s modulus, E) at the point being measured; correspondingly, a bright gray level represents a higher AI value (and thus a higher value of E).
The previous study8 of the dentin/adhesive interface was done using an Olympus UH3 SAM (Olympus, Co., Tokyo) operating with a burst mode lens at 400 MHz (120° aperture angle; nominal lateral resolution, 2.5 µm). The burst mode is an acoustic signal made up of several cycles at a given frequency. The SAM micrograph of the same sample represented by the optical image (Fig. 1) and correlated µ-Raman spectra are presented in Figure 4. While the SAM provides a high-resolution acoustic image of the sample, it does not provide quantitative values directly of the acoustic property it is measuring, that is, the reflection coefficient, r, and thus of the AI value, Z.
Figure 4.
Four hundred MHz burst mode SAM image (x-scan width is 250 µm) of the dentin/adhesive interface represented in Figure 1. Tubules in the dentin area on the left can be seen clearly. The dark narrow band to the right of the dentin represents the unprotected protein; the variation in gray level, increasing in brightness into the dentin, reflects the range of demineralization as it decreases. The gray level band to the right of the unprotected protein represents the adhesive.8
In order to obtain quantitative values of Z, and thus eventually of Young’s modulus, E, a calibration method must be used. Acoustic velocities and densities are measured for a set of known materials, including polyethylene, PMMA, Durango apatite, aluminum, titanium and stainless steel. Young’s modulus, E, then can be calculated as E = ρv2. These same materials also are imaged on the SAM in order to obtain their r values. The voltages corresponding to these r values are plotted on a graph of r versus V. This leads eventually to a Z versus E graph for the known sample materials. Eventually, we can obtain Young’s Moduli for materials under study by an interpolation sequence on these graphs of the known materials.
Unfortunately, interpolation was limited to polyethylene, the polymer with the lowest Young’s modulus of the known materials used in this calibration process. Therefore it would not be possible to obtain a specific Young’s modulus for any material that exhibited gray levels darker, that is, a lower r value, than that of the lowest polymer, polyethylene. This was the case in a previous study of the unprotected protein at the dentin/adhesive interface.8 In this study, the unprotected protein did exhibit gray levels darker than that of the lowest polymer. Thus, while we were able to calculate Young’s moduli for the dentin and the adhesive, we were able to estimate only the upper limit for the unprotected protein as 2 GPa.8
In order to obtain definitive values of Young’s modulus for the materials at the dentin/adhesive interface rather than just an upper limit, the following experiments and additional calibration procedures were undertaken. First, demineralized dentin collagen samples were prepared, one with and one without Single Bond (3 M Corp., St. Paul, MN) adhesive infiltration. These samples were analyzed using µ-Raman spectroscopy in the manner previously reported by Spencer and others.4 Second, in order to show that extrapolation below the lowest polymer value on the Z versus E curve is valid, Young’s moduli for 13 materials, including polymers, glasses, ceramics, and metals, were calculated for both bar (extensional longitudinal) acoustic wave and bulk (shear and dilatational longitudinal) acoustic waves.
MATERIALS AND METHODS
Demineralization/infiltration procedure
Demineralized dentin collagen
Extracted unerupted human third molars stored at 4°C in 0.9% w/v NaCl containing 0.002% sodium azide were used in this study. The occlusal one-third of the crown was sectioned perpendicular to the long axis of the tooth by means of a water-cooled low-speed diamond saw (Buehler). Parallel cuts, 1 to 2 mm deep, were made perpendicular to this surface using a diamond saw. The final cut was about 2 mm below the flat surface. The final dimensions of these slabs were 10 mm long, 2 mm high, and 1.5 mm wide. The 10 × 2 × 1.5-mm slabs were demineralized using the following protocol. Each slab was placed in a vial containing 10 mL of 0.5M of EDTA (pH 7.3). This solution was changed on alternate days and the demineralization process was continued for 7 days. At the end of 1 week a Raman spectrum of each specimen was acquired. The absence of spectral features associated with the mineral (P-O band at 960 cm−1) indicated that the demineralization process was complete.
Infiltration of demineralized dentin collagen with adhesive
The demineralized dentin collagen was dehydrated through an ascending series of ethanols. Specifically, the specimens were dehydrated for 12 h in each of the following: 70, 95, and 100% ethanol. The total dehydration time was 36 h. Following dehydration, the specimens were immersed in Single Bond adhesive. The demineralized dentin collagen/adhesive specimens were placed in a dark room for 72 h. After 72 h, the specimens were polymerized with visible light (Spectrum light, Dentsply, Milford, DE). No effort was made to remove residual ethanol solvent.
Micro-raman methods
The experimental apparatus used to collect the Raman spectra was a Jasco NRS 2000 Raman spectrometer equipped with Olympus lenses and a liquid nitrogen-cooled CCD detector. The optical microscope allowed for visual identification of the position at which the Raman spectrum was obtained. The excitation source was an Argon laser, operating at 514.5 nm. The estimated power of the laser was 100 mW; after passing through the bandpass filter and condensing optics, approximately 3 mW of the power laser were incident upon the sample. Instrument fluctuation was evaluated by comparison of spectra from standards such as silicon, and each spectrum was frequency calibrated and corrected for chromatic variations in spectrometer system detection.
Raman spectra of demineralized dentin collagen with and without adhesive infiltration were acquired from a minimum of 6–8 different sites on each sample. Spectra were obtained at a resolution of ≈6 cm−1 over the spectral region of 875–1785 cm−1 and with an integration time of 60 s. The specimens of demineralized dentin infiltrated with adhesive were placed at the focus of a 60× water immersion lens, and spectra were acquired at randomly selected positions within the intertubular dentin. Similarly, spectra were acquired from randomly selected sites on the demineralized dentin collagen specimens. Following data collection, each sample was visually inspected for any signs of degradation. No significant differences in the Raman spectra from different compositions in a given sample were seen, nor was any evolution evident in the spectra over the period of acquisition.
Scanning acoustic microscopy/calibration methods
The same technique used in the previous study8 was applied to both samples described above. The samples were placed on the Olympus UH3 SAM and analyzed using the 400 MHz burst mode lens (120° aperture angle; nominal lateral resolution, 2.5 µm). Voltage values, corresponding to the respective gray levels at 10 different points on the SAM micrographs, were measured and averaged for both the demineralized dentin collagen and the demineralized dentin collagen samples infiltrated with Single Bond adhesive. The same calibration procedure used in our previous study9 was used here as well.
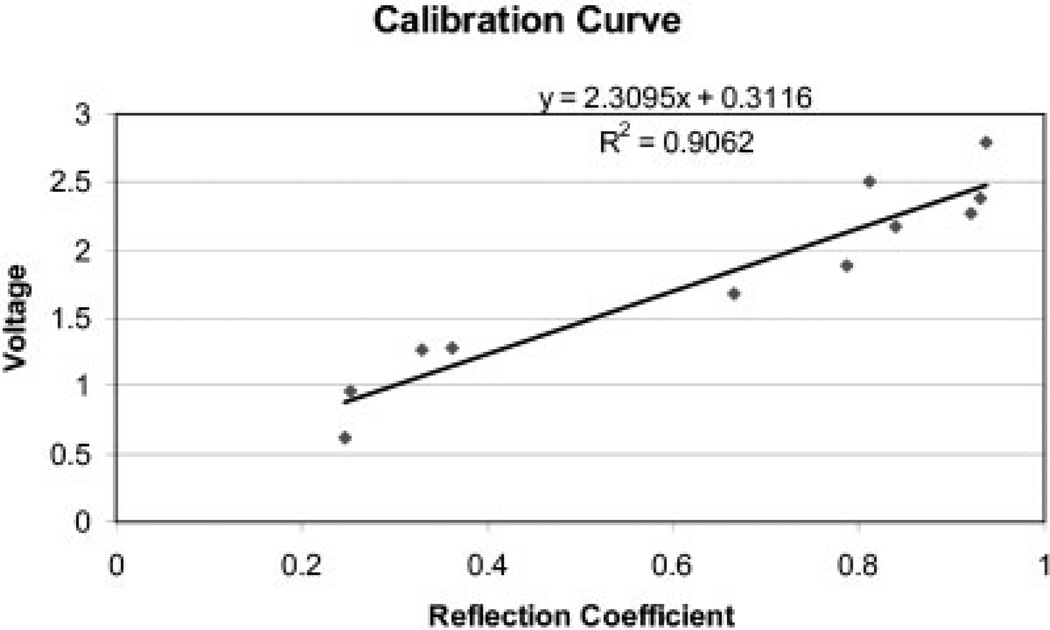
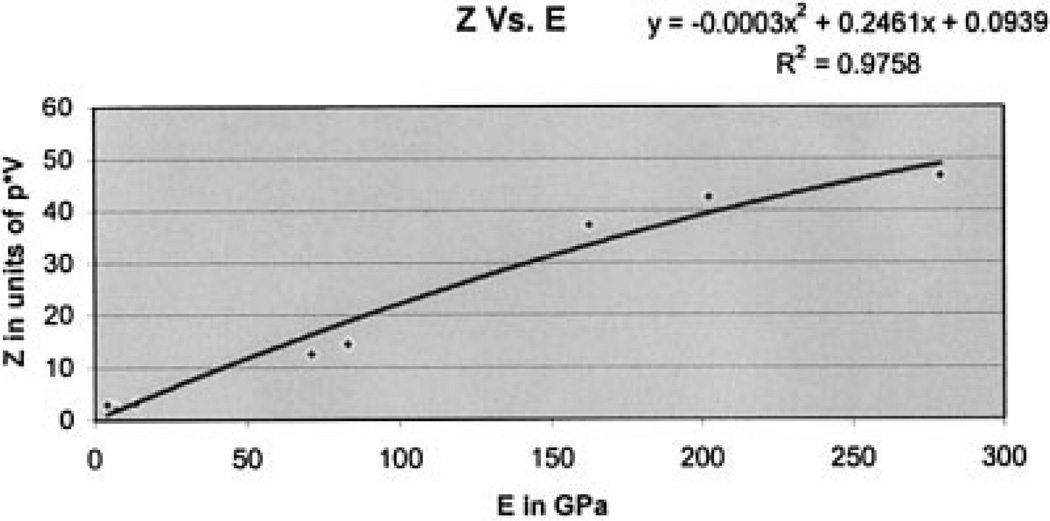
These calibration curves, represented in Figures 5 through 7, are based on known materials: PMMA, polypropylene, polystyrene, Teflon, dentin, Pyrex, glass, enamel, brass, copper, and steel. Figure 5 is the graph of reflection coefficient, r, versus stored voltage, V; Figure 6 is the graph of V versus the AI, Z; and Figure 7 is the graph of Z versus Young’s modulus, E. Note the good R2 value for each graph, indicating the validity of the interpolation procedure. As in our previous study,8 the gray levels for the collagen on both samples were below the lowest values on the calibration curves based on known materials.
Figure 5.
Graph of reflection coefficient, r, versus stored voltage, V, for 11 standard materials.
Figure 7.
Graph of Z versus Young’s modulus, E.
Figure 6.
Graph of reflection coefficient, r, versus acoustic impedance, Z.
In order to obtain moduli for the interface more closely approximating its definitive values, an additional calculation has been introduced. The additional calculation supports the calibration procedure described above as well as ensures that extrapolation also is valid for the properties of unknown materials whose reflection coefficients fall below the lowest values on the graphs, for example, the collagen in the respective SAM micrographs obtained in this study. The density, ρ, extensional longitudinal velocity, υL, shear velocity, υt, and dilatational longitudinal velocity, υl, for 13 calibration materials, covering the range from low-modulus polymers to high-modulus metals, were obtained from the literature (see Table I).
TABLE I.
Densities and Bar Longitudinal (Extensional) VL, and Bulk Longitudinal (Dilatational) V1 and Transverse (Shear) Vt, Velocities for 13 Known Materials
| Material | Density (ρ) gm/cc |
VL m/sec |
V1 m/sec |
Vt m/sec |
|---|---|---|---|---|
| Aluminum (rolled) | 2.7 | 5000 | 6420 | 3040 |
| Brass (70% Cu, 30% Zn) | 8.6 | 3480 | 4700 | 2110 |
| Copper (rolled) | 8.93 | 3750 | 5010 | 2270 |
| Nickel | 8.9 | 4900 | 6040 | 3000 |
| Steel (347 Stainless) | 7.9 | 5000 | 5790 | 3100 |
| Titanium | 4.5 | 5080 | 6070 | 3125 |
| Zinc (rolled) | 7.1 | 3850 | 4210 | 2440 |
| Fused silica | 2.2 | 5760 | 5968 | 3764 |
| Glass (Pyrex) | 2.32 | 5170 | 5640 | 3280 |
| PMMA (Lucite) | 1.18 | 1840 | 2680 | 1100 |
| Nylon (6.6) | 1.11 | 1800 | 2620 | 1070 |
| Polyethylene | 0.90 | 920 | 1950 | 540 |
| Polystyrene | 1.06 | 2240 | 2350 | 1120 |
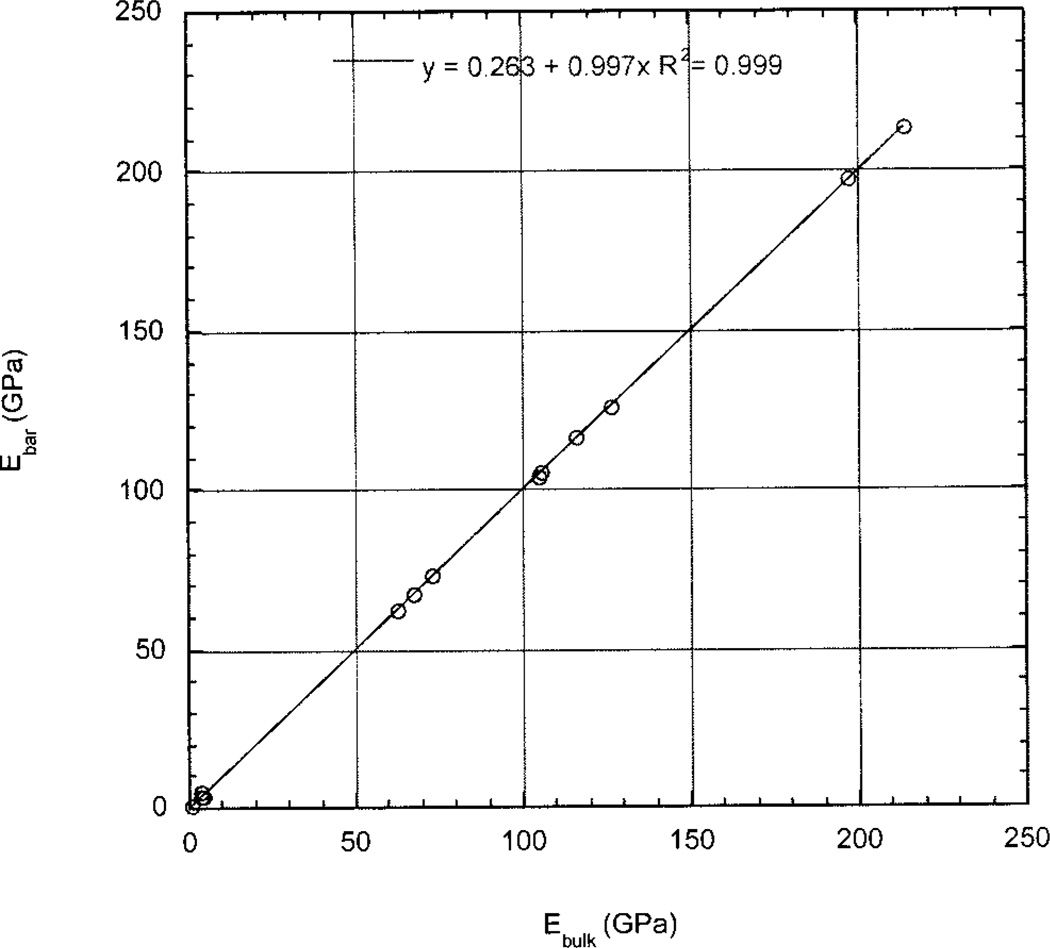
Young’s modulus for the lower acoustic frequency (bar wave) measurements, E(Bar), was calculated for each of the 13 materials as E(Bar) = ρvL2 (see Table II). Similarly Young’s modulus for the higher acoustic frequency (bulk wave) measurements, E(Bulk), was calculated as E(Bulk) = 9KG/(3K + G) for all 13 materials (see Table II), where the shear modulus, , and the bulk modulus, . Figure 8 is the graph of E(Bar) versus E(Bulk).
TABLE II.
Elastic Modulus for Bulk Wave and Bar Wave
| Material | E = ρV2 | E = 9KG/(3K + G) |
|---|---|---|
| Aluminum, rolled | 67.5 | 67.6 |
| Brass (70Cu, 30Zn) | 104.1 | 105.2 |
| Copper, rolled | 125.6 | 126.1 |
| Nickel | 213.7 | 214.1 |
| Steel, 347 Stainless | 197.5 | 197.2 |
| Titanium | 116.1 | 115.9 |
| Zinc, rolled | 105.2 | 105.5 |
| Fused silica | 73 | 73 |
| Glass, pyrex | 62 | 62.2 |
| Lucite | 4 | 4 |
| Nylon 6,6 | 3.6 | 3.55 |
| Polyethylene | 0.76 | 0.76 |
| Polystyrene | 5.3 | 3.5 |
Figure 8.
Graph of bar wave modulus versus bulk wave modulus for 13 standard materials, based on data in Table II.
RESULTS
Micro-raman analyses
The Raman spectrum of dentin type I collagen, prepared by complete demineralization of a dentin disc in 0.5M of EDTA (pH 7.3), is presented in Figure 9. The spectral features include the amide I (C=O stretching vibration) and III (C-N stretching, C-N-H in plane bending) modes, with sharp and strong bands at 1667 and 1245 cm−1, respectively; these groups tend to be sensitive to the nature of the polypeptide chains.10 The position and intensity of these bands are typical of collagen fibril with triple-helical structure. In addition, a strong band appeared at 1454 cm−1, attributed to the (CH2)(CH3) bending deformation mode.
Figure 9.
Raman spectrum of demineralized dentin collagen.
The Raman spectrum of intertubular demineralized dentin collagen infiltrated with Single Bond adhesive is presented in Figure 10. Spectral features characteristic of collagen and adhesive are clearly evident in this figure. The bands associated with the adhesive occur at 1609 cm−1 (phenyl C=C) and 1113 cm−1 (C-O-C) while the amide I (C=O stretching vibration) associated with collagen occurs at 1667 cm−1.
Figure 10.
Raman spectrum of intertubular demineralized dentin collagen infiltrated with Single Bond dentin adhesive.
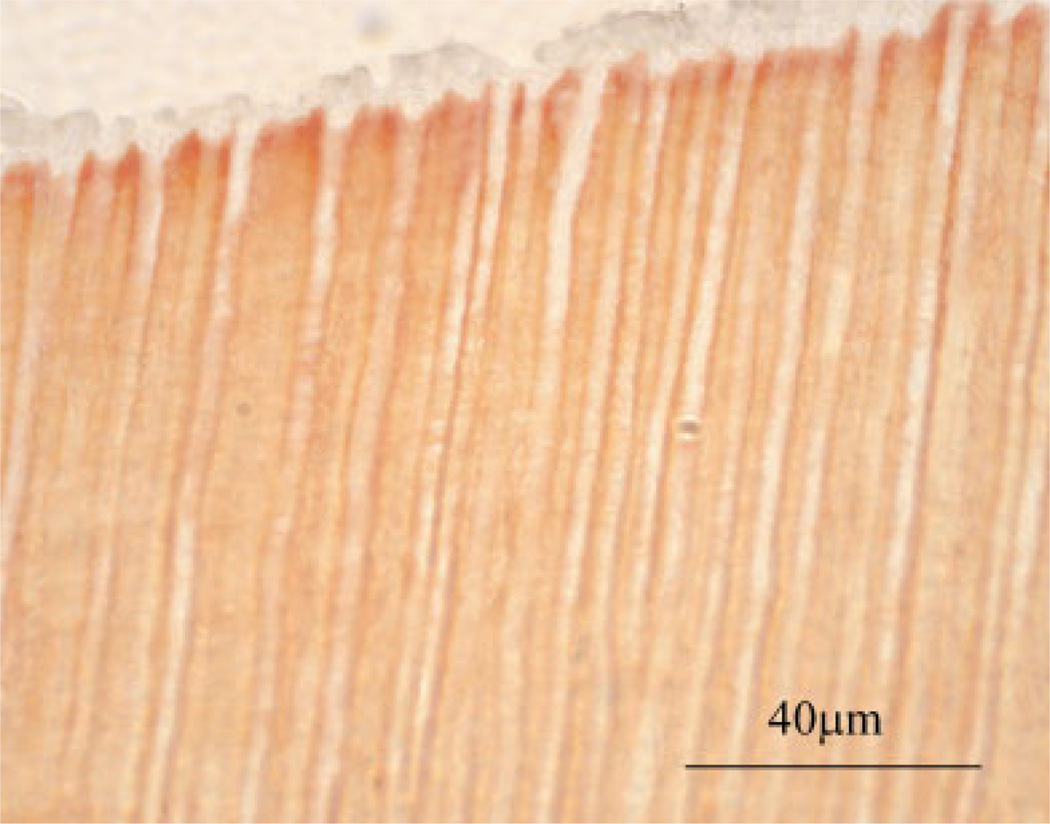
The corresponding light micrograph of this specimen, stained with Goldner’s trichrome, is presented in Figure 11. Goldner’s trichrome stains exposed collagen red/orange; thus this micrograph suggests that the adhesive infiltrate has not eliminated the porosity. The orange stain suggests that there is exposed collagen in the intertubular region that is available for reaction with the stain. The results with this stain suggest that the collagen was not completely encapsulated by the adhesive resin. The Single Bond adhesive appears pearl gray in this micrograph. Dentin tubules that have been infiltrated with adhesive are clearly visible.
Figure 11.
Corresponding light micrograph of specimen represented in Figure 10. This demineralized dentin collagen specimen was infiltrated with Single Bond adhesive and stained with Goldner’s trichrome. In this specimen, which was polymerized before removal of ethanol solvent, the ≈4-µm-in-diameter adhesive tags appeared clear while the intertubular regions stained light orange.
Scanning acoustic microscopy/calibration analyses
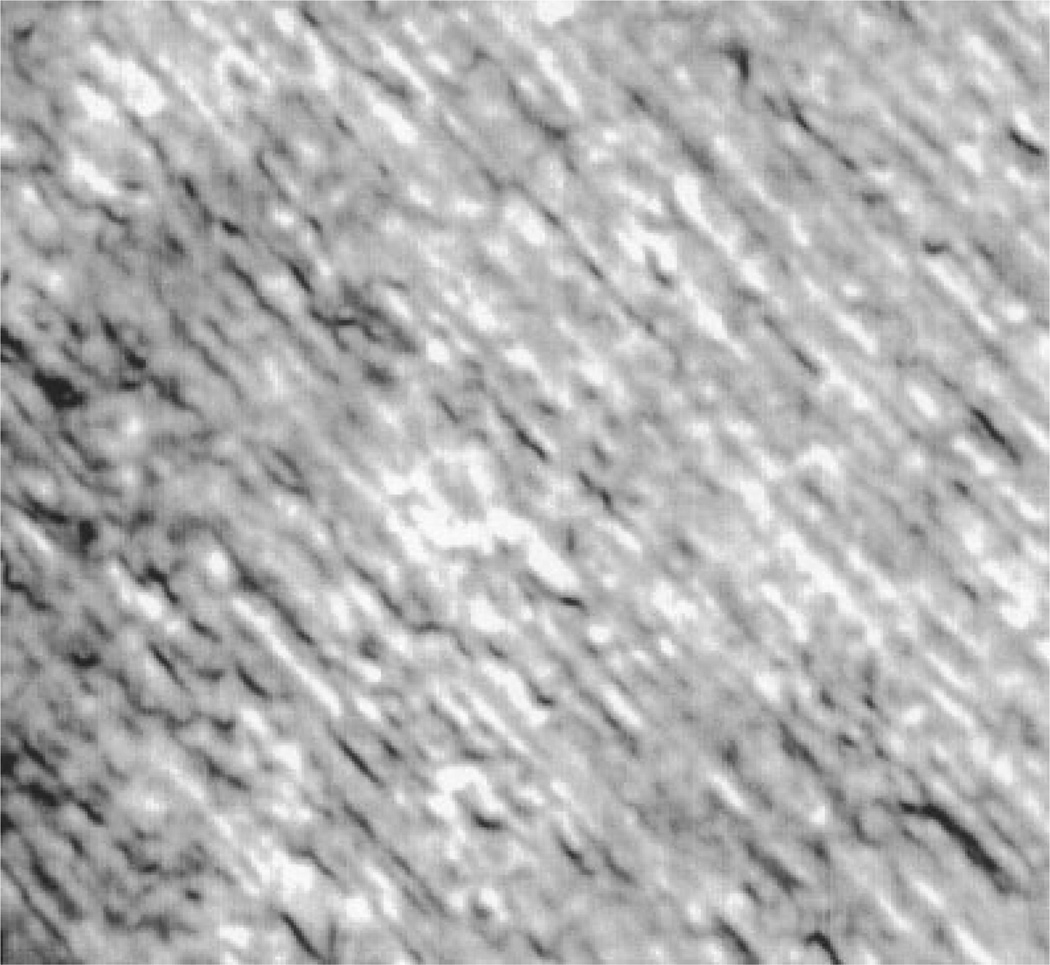
Figure 12 is the SAM micrograph for the demineralized dentin collagen without adhesive infiltration. Note the uniform gray level of the collagen. As the collagen matrix has spaces, during the scanning there are reflections from the glass slide on which the sample is mounted. These openings in the collagen matrix account for the few bright regions located randomly in this figure.
Figure 12.
Four hundred MHz SAM image of the demineralized dentin collagen without adhesive infiltration. (x-scan width is 250 µm.) Bright regions are reflections from the glass slide on which the sample is mounted.
This is in contrast with what is depicted in Figure 13, the SAM micrograph of the demineralized dentin collagen infiltrated with Single Bond. Here, interspersed in the spaces between the collagen fibers, are a significant number of uniform brighter images; these are the locations where the Single Bond adhesive has infiltrated the pores in the collagen network. This is identified by the higher Z (and, correspondingly, the higher E) value of Single Bond, that is, the brighter the image the greater the reflection coefficient, r, and thus the greater the AI value, Z. The collagen fibril orientation and thickness are random; thus it is not possible during sample preparation to provide a specimen that is in the same focal plane. Therefore the black regions overlaying some of the tubule structures are artifacts caused by differences in height relative to the rest of the specimen. That is, these regions are out of the focal plane.
Figure 13.
Four hundred MHz SAM image of the demineralized dentin collagen infiltrated with Single Bond dentin adhesive. (x-scan width is 250 µm.) The black regions overlaying some of the tubule structures are artifacts resulting from differences in height relative to the rest of the specimen; that is, these regions are out of the focal plane.
Voltage values, corresponding to the respective gray levels at 10 different points, were measured and averaged for both the as-is and the Single Bond-infiltrated collagen samples. As in our previous study,8 the gray levels for the collagen on both samples are below the lowest values on the calibration curves based on known materials. In order to obtain valid values for both the as-is and the Single Bond-infiltrated collagen samples from the SAM scans, the measurements were interpreted using the values represented in Table II and the relationships presented in Figure 8.
Figure 8, as does Table II, shows the equality between Young’s modulus for the higher (Bulk) acoustic waves and Young’s modulus for the lower (Bar) acoustic waves for each calibration material, with the exception of PMMA. These data show that these 12 materials do not exhibit dispersion over this range of frequencies. Thus a good approximation of Young’s moduli for the gray levels for the collagen displayed on both SAM micrographs can be obtained by extending the above calibration process to extrapolation below the lowest polymer values.
Values of E for the collagen from both samples and the Single Bond from the infiltrated sample are given in Table III. The elastic modulus of a sample composed solely of Single Bond adhesive is presented for comparison.
TABLE III.
Elastic Moduli of Dentin/Adhesive Interface Components
| Component | Elastic Moduli (GPa) |
|---|---|
| Collagen | 1.76 ± 0.00 |
| Collagen infiltrated with adhesive | 1.84 ± 0.65 |
| Adhesive infiltrate | 3.40 ± 1.00 |
| Dentin | 28a |
| Adhesive | 5a |
See Reference 8: Katz et al. 2001.
DISCUSSION AND CONCLUSIONS
In our previous publication,8 we indicated that we could provide an upper limit of only 2 GPa for Young’s modulus, E, of the unprotected protein at the dentin/adhesive interface. This was due to the fact that for the several polymers used in that study, the lowest values of r versus V on our calibration curve (Figs. 5–7) were above those measured for the unprotected protein at the interface. Also, there was the question of dispersion, that is, the dependence of E on frequency for viscoelastic materials, such as the polymers and the unprotected protein. This led to the present SAM study of the properties of the demineralized dentin collagen both with and without the infusion of the Single Bond adhesive. In addition, we extended our calibration procedure to include the effects of frequency on Young’s modulus (see Tables I and II and Figure 8).
Extensional longitudinal ultrasonic wave propagation is essentially a low-frequency technique, often described as a bar wave. The velocity measured, υL, provides a direct measurement of Young’s modulus, E= ρυL2, where ρ is the density. This value is equivalent to that measured in quasi-static mechanical stress–strain experiments, except for dispersive materials, where it generally will be higher.
Shear wave velocities, υt, and dilatational longitudinal wave velocities, υl, are measured at higher frequencies and provide values of the Lamé constants, that can be used to obtain the shear, G, and bulk, B, moduli in order to calculate Young’s modulus, E = 9KG/(3K + G). This often is designated the bulk wave modulus. Figure 8 and Table II show the strong correlation between E(Bar) and E(Bulk), including even the polymers used in this calibration.
This does not indicate what dispersive effects there may be for moduli measured by the quasi-static (very low strain rate) mechanical measurements and the bar wave ultrasonic measurements for these polymers or the interface material. However, at worst, it does provide a reasonable measure of the values for these former materials over a wide range of ultrasonic frequencies. Of even greater importance, this analysis provides a rational basis for extrapolating below the lowest known measurable materials used in the calibration process in order to obtain tighter limits of the moduli, that is, more realistic values of the (probable) upper value for the collagen samples analyzed here as well as for the unprotected protein at the interface.
Additional support for this calibration procedure is provided by analyzing the relationship between shear wave velocities, υt, and dilatational longitudinal wave velocities, υl (see Table I). The average value of the ratio, υt/υl, for the 13 materials used in this calibration is 0.48 ± 0.09. This confirms the final stage in the calibration procedure of obtaining Young’s modulus by correlating the high frequency SAM measurements for the known materials with their measured bar wave values. The values of both the as-is and the infiltrated demineralized dentin collagen provided in Table III were based on this extensive calibration procedure.
We do not consider the difference between 1.76 GPa measured for the as-is demineralized dentin collagen specimen and 1.84 GPa for the demineralized dentin collagen specimen that has been infused with adhesive to be significant. These specimens were different, so there is no guarantee that the collagen thicknesses and orientations were comparable. Small differences in those factors could be responsible for the 4.3% difference between the two values. Since the acoustic-beam width, although quite narrow, is finite, an additional possibility is that the thin film of adhesive, of higher modulus, surrounding the collagen has affected the measurement. As these values are obtained directly from the fibrils themselves, they are compatible with the value of 3 GPa for the Young’s modulus of tendon collagen molecules obtained by X-ray diffraction measurements of the changes in their D period when strained in tension.11
The extremely low values of demineralized dentin collagen matrices measured by mechanical testing12,13 are on porous meshes and do not directly reflect the properties of either the molecules or the fibrils. It is well known that the modulus of such soft materials lessens considerably with an increase in porosity.
The lower modulus of the adhesive infiltrate, as compared to the value recorded for the adhesive sample, may be related to several factors. As a result of residual solvent and/or water, the degree of monomer/polymer conversion in the adhesive infiltrate may have been less than the sample composed solely of adhesive. The lower modulus of elasticity of the infiltrate may reflect less polymerization and/or crosslinking of the material that infiltrated the wet demineralized dentin matrix as compared to the separate adhesive sample.
The value for the adhesive infiltrate, however, was within the range reported by previous investigators. For example, using tensile stress–strain tests, Sano et al.14 obtained moduli of elasticity for resin-infiltrated demineralized dentin ranging from 2–3.6 GPa. With a modified AFM nanoindenter, previous investigators have reported the modulus of elasticity of Single Bond-infiltrated dentin from 1.3–5.1 GPa, depending upon the degree of hydration of the substrate.15
In a recent meta-analysis of bond strength, results published between 1992 and 1996, the authors concluded that although conventional tests are simple and fast, they have many drawbacks.16 The bond strength tests measure d/a reactions primarily at the point of fracture. They do not provide mechanical data at a resolution that would permit the identification of interfacial defects, where failure likely initiates. Using conventional testing techniques, an investigator cannot identify the initial flaw nor can the investigator directly correlate this flaw with the structure and chemistry of the substrate or the bonded assembly.
As described in our recent publications,8,9 by combining the unique capabilities of µRS, SAM, and optical microscopy, we can perform chemical, mechanical, and morphologic characterization over the same small region of the d/a interface. These complementary technologies provide direct nondestructive in situ detection of the interfacial molecular structure, micromechanics, and morphologic features of the bonded assembly. This is exemplified by the corresponding patterns recorded in the optical image and the SAM image of the demineralized dentin collagen infiltrated with adhesive. The data collected from these synergistic techniques provide added insight into the potential problems at the weak d/a interface, problems that may be avoided by altering the materials and/or the method of application.
Acknowledgments
The authors gratefully acknowledge 3M, Dental Products Division, for donating the dentin adhesive product used in this study.
Contract grant sponsor: National Institutes of Health, National Institute of Dental and Craniofacial Research; contract grant number: DE12487
References
- 1.Chase B. A new generation of Raman instrumentation. Appl Spectrosc. 1994;48:14A–18A. [Google Scholar]
- 2.Turrell G, Corset J. Raman microscopy—Developments and applications. New York: Academic Press; 1996. pp. 1–12. [Google Scholar]
- 3.Meier RJ. MicroRaman spectroscopy: Application to polymeric and inorganic systems. Int J Electronics. 1995;78:285–288. [Google Scholar]
- 4.Spencer P, Wang Y, Walker MP, Wieliczka DM, Swafford JR. Interfacial chemistry of the dentin/adhesive bond. J Dent Res. 2000;79:1458–1463. doi: 10.1177/00220345000790070501. [DOI] [PubMed] [Google Scholar]
- 5.Wang Y, Spencer P. Quantifying adhesive penetration in adhesive/dentin interface using confocal Raman microspectroscopy. J Biomed Mater Res. 2002;59:46–55. doi: 10.1002/jbm.1215. [DOI] [PubMed] [Google Scholar]
- 6.Spencer P, Wang Y, Walker MP, Swafford JR. Molecular structure of acid-etched dentin smear layers—In situ study. J Dent Res. 2001;80:1802–1807. doi: 10.1177/00220345010800090601. [DOI] [PubMed] [Google Scholar]
- 7.Wang Y, Spencer P. Analysis of acid-treated dentin smear debris and smear layers using confocal Raman microspectroscopy. J Biomed Mater Res. 2002;60:300–308. doi: 10.1002/jbm.10108. [DOI] [PubMed] [Google Scholar]
- 8.Katz JL, Bumrerraj S, Dreyfuss J, Wang Y, Spencer P. Micromechanics of the dentin/adhesive interface. J Biomed Mater Res Appl Biomater. 2001;58:366–371. doi: 10.1002/jbm.1030. [DOI] [PubMed] [Google Scholar]
- 9.Katz JL, Spencer P, Wang Y, Wagh A, Nomura T, Bumrerraj S. Structural, chemical and mechanical characterization of the dentin/adhesive interface. In: Lewandrowski K, Wise D, Trantolo D, Gresser J, Yaszemski M, Altobelli D, editors. Tissue engineering and biodegradable equivalents: Scientific and clinical applications. New York: Marcel Dekker; 2002. pp. 775–793. [Google Scholar]
- 10.Frushour BG, Koenig JL. Raman scattering of collagen, gelatin, and elastin. Biopolymers. 1975;14:379–391. doi: 10.1002/bip.1975.360140211. [DOI] [PubMed] [Google Scholar]
- 11.Sasakik N, Odajima S. Stress–strain curve and Young’s modulus of a collagen molecule as determined by the X-ray diffraction technique. J Biomech. 1996;29:655–658. doi: 10.1016/0021-9290(95)00110-7. [DOI] [PubMed] [Google Scholar]
- 12.Zhang Y, Agee K, Nor J, Carvalho R, Sachar B, Russell C, Pashley DH. Effects of acid-etching on the tensile properties of demineralized dentin matrix. Dent Mater. 1998;14:222–228. doi: 10.1016/s0109-5641(98)00035-9. [DOI] [PubMed] [Google Scholar]
- 13.Balooch M, Wu-Magidi I-C, Balaz A, Lundkvist AS, Marshall SJ, Marshall GW, Siekhaus WJ, Kinney JH. Viscoelastic properties of demineralized human dentin measured in water with atomic force microscope(AFM)-based indentation. J Biomed Mater Res. 1998;40:539–544. doi: 10.1002/(sici)1097-4636(19980615)40:4<539::aid-jbm4>3.0.co;2-g. [DOI] [PubMed] [Google Scholar]
- 14.Sano H, Takatsu T, Ciucchi B, Russell CM, Pashley DH. Ten-sile properties of resin-infiltrated demineralized human dentin. J Dent Res. 1995;74:1093–1102. doi: 10.1177/00220345950740041001. [DOI] [PubMed] [Google Scholar]
- 15.Schulze KA, Oliveira SSA, Marshall GW, Gansky SA, Marshall SJ. Technique sensitivity of a self-etching versus an acid etching system. J Dent Res. 2002;81(947 Sp. Iss.):139. [Google Scholar]
- 16.Leloup G, D’Hoore W, Bouter D, Degrange M, Vreven J. Meta-analytical review of factors involved in dentin adherence. J Dent Res. 2001;80:1605–1614. doi: 10.1177/00220345010800070301. [DOI] [PubMed] [Google Scholar]


