

Abstract
A general method for the non-oxidative functionalization of single-crystal silicon (111) surfaces is described. The silicon surface is fully acetylenylated using two-step chlorination/alkylation chemistry. A benzoquinone-masked primary amine is attached to this surface via Cu(I)-catalyzed Huisgen 1,3-dipolar cycloaddition (“click” chemistry). The benzoquinone is electrochemically reduced, resulting in quantitative cleavage of the molecule and exposing the amine terminus. Molecules presenting a carboxylic acid have been immobilized to the exposed amine sites. X-ray photoelectron spectroscopy (XPS), Fourier transform infrared spectroscopy (FTIR), cyclic voltammetry (CV), and contact angle goniometry were utilized to characterize and quantitate each step in the functionalization process. This work represents a strategy for providing a general platform that can incorporate organic and biological molecules on Si(111) with minimal oxidation of the silicon surface.
Introduction
Semiconductor devices and semiconductor processing are playing an increasingly large role in biotechnology, with applications that include nanowires (NWs)1 and nanocantilevers2,3 for label-free biomolecular sensors, nanofluidics for biomolecular separations,4-7 and a host of microfabricated lab-on-a-chip technologies.8,9 Coupled with these emerging nano- and microtechnologies has been the emergence of mechanical,10-12 chemical, and electrochemical approaches for functionalizing and/or selectively activating surfaces. Electrochemical activation of surfaces is particularly relevant since it is shape conformal and is only limited by the size of electronically addressable features (which can be much denser than what can be spotted with an inkjet, for example). Electrochemical activation of metal surfaces has been pioneered by Mrksich,13-16 and applications of that chemistry towards the biofunctionalization of semiconductor nanowires has been demonstrated by at least two groups.17,18 For Si surfaces, the chemistry is particularly challenging: without protection, Si will form a native oxide that can prevent the use of silicon electrodes for electrochemical functionalization. The native oxide on silicon also has a low isoelectric point, meaning that under physiological conditions (= pH 7.4), SiO2 surfaces are negatively charged.19 These surface charges can potentially limit the sensitivity of certain nanoelectronic biomolecular sensor devices through Debye screening20 of the biomolecular probe/target binding event to be sensed. Furthermore, the native oxide of Si can detrimentally impact carrier recombination rates.21 For high surface area devices, such as Si NWs, this can likely result in a degradation of electrical properties. Thus, the ideal biofunctionalization strategy for electrochemically activating Si surfaces should begin with non-oxidized Si. The approach should also provide continued protection of the Si surface against subsequent oxidation, and should limit the number of surface traps that can increase carrier recombination rates.
Several methods for attaching organic molecules onto non-oxidized Si surfaces have been reported. One class of schemes relies upon the direct covalent attachment of alkene terminated molecules to H-terminated surfaces by thermal induction, ultraviolet (UV) light, or catalysis.22-29 These strategies have not been demonstrated as giving long-term protection to the Si surface against oxidation. Lewis’ group has developed the two-step chlorination/alkylation procedure for Si(111) surfaces that is based upon Grignard chemistry.30-35 A limitation of these approaches is that, thus far, only the methylated Si(111) surface (using Lewis’ chemistry) can be 100% covered.31,36 For example, the coverage that can be achieved through the ethylation of Cl-terminated Si(111) is limited by steric affects and is about 80% of the atop sites.37 For larger organic molecules, surface coverages will most certainly be lower, and resistance to oxidation reduced. In order to fully passivate the Si(111) surface, generate resistance to oxide growth, and provide for a chemically versatile surface, different surface chemistries are needed. It is relevant to note that no surface chemistry has yet been demonstrated that yields protection of the much more technologically relevant Si(100) surface against oxidation.
In this paper we describe a versatile and robust strategy for chemically passivating Si(111) surfaces in a manner that stabilizes the underlying Si against oxidation and allows for both chemical and electrochemical functionalization of the surface. Based upon our previous work on methylated and ethylated Si(111),30-37 we chose to explore the more chemically versatile acetylenylation of chlorine-terminated Si(111). Work by Nemanick38 and Lewis’ group39,40 indicated that the chlorination/alkylation chemistry for acetylenylating Si(111) could proceed to completion. The footprint of the -C≡CH on Si(111) should be as small or smaller than the −CH3 group, and so a high surface coverage should be possible. Equally important is that the -C≡CH group also provides a chemical handle for additional functionalization via the Cu(I) catalyzed Huisgen 1,3-dipolar cycloaddition (‘click’ reaction41,42) between an azide and the surface-bound alkyne. In particular, we designed an azide-functionalized, modified benzoquinone for attachment, via the click reaction, to the surface-bound acetylenyl groups to form a 1,2,3-triazole. The click reaction is useful because azides and acetylenes are synthetically easy to introduce, compatible with a variety of solvents and species, and tolerant against other functionality (highly specific, coupling can only occur between these two groups). Our work here follows recent reports that have demonstrated that different molecules can be clicked onto gold and SiO2 surfaces in a variety of solvent and pH conditions.43-51
We previously reported on the electrochemistry of hydroquinones on Si(111) and Si(100) surfaces, attached via the UV-activation of H-terminated Si.17 In that work, the hydroquinones could be reversibly oxidized to form benzoquinones (the ‘activated’ surface) which could then react by way of either Diels-Alder cycloaddition13,15 or Michael addition chemistries,52,53 leading to a selectively biofunctionalized Si microwire or nanowire surface. However, while the hydroquinone coverage on the Si(111) surface did yield at least some protection for that surface against oxidation, the electrochemical step to oxidize the hydroquinone also led to oxidation of the underlying Si(111). Thus, in this work, we have designed and synthesized a benzoquinone that can be clicked onto the acetylenylated Si surface. The surface-bound benzoquinone may be then activated via electrochemical reduction to produce an amine terminus.14,54,55 We demonstrate that the entire chemical process may be accomplished in a fashion that greatly reduces the oxidation of the underlying Si. We also demonstrate the selective attachment of ferrocene onto an electrochemically activated Si(111) surface, as well as the model biomolecule, biotin.
Experimental Methods
Chemicals
Anhydrous methanol and anhydrous tetrahydrofuran (THF, inhibitor-free) were obtained from Aldrich and exclusively stored and used in a N2(g)-purged glove box. Chlorobenzene, benzoyl peroxide, and sodium acetylide (18 wt% in xylenes/light mineral oil) were purchased from Aldrich and were stored and used in the glove box. Phosphorus pentachloride (PCl5) was acquired from Riedel-de Haën (Seelze, Germany). The 40% NH4F(aq) solution was obtained from Transene Co. (Rowland, MA) and was used as received. The CuSO4·5H2O was obtained from Spectrum Chemical Mfg. Corp. (Gardena, CA). Sodium ascorbate, ferrocene carboxylic acid, and anhydrous N,N-dimethylformamide (DMF) were obtained from Aldrich. N,N’-Diisopropylcarbodiimide (DIC) was purchased from Anaspec (San Jose, CA). Dulbecco’s Phosphate Buffered Saline (DPBS) (2.7 mM KCl, 1.5 mM KH2PO4, 137 mM NaCl, 8 mM Na2HPO4) pH 7.4 was purchased from Sigma. EZ-Link NHS-Biotin was obtained from Pierce Biotechnology, Inc. (Rockford, IL). Nanogold Streptavidin was purchased from Invitrogen (Carlsbad, CA). GoldEnhance-EM kit for Nanogold amplification was bought from Nanoprobes (Yaphank, NY).
Acetylenylation of Si(111)
Scheme 1 shows the strategy used for functionalization of Si(111), using a two-step chlorination/alkylation method followed by Cu(I)-catalyzed click chemistry. The acetylene passivation leads to a high coverage of atop sites on an unreconstructed Si(111) surface (97 ± 5 %), which resists native oxidation of the surface.39,40 Another advantage is the ability to use the terminal alkyne to attach a variety of molecules via click chemistry.
Scheme 1.

Strategy for the functionalization of Si(111).
The starting surfaces used in these experiments were single crystal, polished Si(111) wafers, that were 500-550 μm thick, phosphorus-doped (n-type), with 0.005-0.02 Ω-cm resistivity, and a miscut angle of 3-4° (Montco Silicon Technologies (Spring City, PA)). Prior to use, the Si wafers (1 cm × 1 cm) were cleaned by successive sonications in acetone, methanol, and isopropanol. Substrates were then rinsed with Millipore (18 MΩ) water and then placed into basic piranha solution (5:1:1 = H2O:H2O2:NH4OH warning: caustic!) at 80 °C for 5 min. The samples were removed from piranha solution, rinsed with copious amounts of Millipore water and dried under streaming N2(g). The samples were immediately place in degassed NH4F(aq) solution for 15 min. The samples were subsequently removed from the NH4F(aq), rinsed copiously with water, dried under streaming N2(g), and immediately loaded into a glove box. Chlorination of the Si(111) surfaces (Scheme 1, Step 1) was carried out in a N2(g)-purged glove box, according to published methods.30-37 A saturated solution of PCl5 in chlorobenzene was prepared and heated for one hour before use to ensure complete dissolution of the PCl5. The Si substrate was added with a grain of benzoyl peroxide to this solution and heated to 90 °C for 50 min. Subsequently, the samples were rinsed with anhydrous THF several times and immediately used for the acetylenylation step.
Acetylenylation of the chlorinated Si(111) surfaces (Scheme 1, Step 2) was performed inside the N2(g)-purged glove box. The chlorinated wafers were immersed in a sodium acetylide (18 wt% in xylenes/light mineral oil) suspension and heated to 130 °C for 5 hours.40 After reaction, the samples were removed from solution, rinsed copiously with anhydrous THF, and then rinsed with anhydrous methanol. The samples were then immersed into a fresh volume of anhydrous methanol, taken out of the glove box into air, sonicated for 10 min, and then dried in a stream of N2(g).
Synthesis of electroactive benzoquinone 1
Scheme 2 describes the synthetic procedure for making the electroactive benzoquinone 1 used for all surface click reactions.54 A 2,3,5-trimethylhydroquinone was treated with dimethylacrylic acid to give a lactone (a) by a Friedel-Crafts type addition reaction. The quinone acid (b) was prepared by oxidation of the resulting lactone (a) with aqueous N-bromosuccinimide (NBS). The acid was activated with an N-hydroxysuccinimidyl (NHS) group to give (c), which was then subjected to 3-azidopropylamine to afford 1.
Scheme 2.

Synthesis of electroactive benzoquinone 1.
6-Hydroxy-4,4,5,7,8-peptamethyl-chroman-2-one (a)
2,3,5-Trimethylhydroquinone (2 g, 13.1 mmol) was mixed with 3,3-dimethylacrylic acid (1.45 g, 14.5 mmol) and methanesulfonic acid (10 ml). The mixture was stirred at 85 °C under nitrogen for 3 hrs and then cooled to room temperature. To the mixture was added 100 g of ice with stirring. The precipitate was extracted with ethyl acetate (4 × 50 ml). The combined organic layer was washed with saturated NaHCO3 (2 × 50 ml) and water (2 × 50 ml), and dried over MgSO4. After filtration and evaporation, an obtained residue was recrystallized from hexane and ethyl acetate (2:1, v/v) to give 2.6 g (84%) of the desired product as a white solid. 1H NMR 300 MHz (CDCl3) δ 4.69 (s, 1H), 2.56 (s, 2H), 2.37 (s, 3H), 2.23 (s, 3H), 2.9 (s, 3H), 1.46 (s, 6H).
3-Methyl-3-(2,4,5-trimethyl-3,6-dioxocyclohexa-1,4-dienyl)butanoic acid (b)
To a solution of the lactone a (1.58 g, 6.74 mmol) in a mixture of acetonitrile (15 ml) and water (3 ml) was added N-bromosuccinimide (1.26 g, 7.08 mmol) in portions with stirring at room temperature. After 30 min, the organic solvents were evaporated under reduced pressure, and the remaining solution was extracted with CH2Cl2 (2 × 30 ml). The combined organic layer was dried over MgSO4, and reduced solvent to give 1.65 g (98%) of a yellow oily product, which was used without further purification. 1H NMR 300 MHz (CDCl3) δ 3.04 (s, 2H), 2.15 (s, 3H), 1.96 (m, 3H), 1.94 (m, 3H), 1.45 (s, 6H).
3-Methyl-3-(2,4,5-trimethyl-3,6-dioxocyclohexa-1,4-dienyl)butanoic acid, N-hydroxysuccinimidyl ester (c)
To a solution of acid b (326 mg, 1.30 mmol) and N-hydroxysuccinimide (152 mg, 1.32 mmol) in CH2Cl2 (15 ml), was added 1,3-dicyclohexylcarbodiimide (DCC, 270 mg, 1.31 mmol) portionwise, followed by a catalytic amount of N,N-dimethylaminopyridine (DMAP). The reaction mixture was stirred for 1 hr. The white precipitate was filtered and the filtrate was concentrated. The residue was redissolved in cold ethyl acetate (5 ml) and insoluble impurities were filtered. Solvent was removed to give 419 mg (93%) of a yellow foamy solid product. 1H NMR 300 MHz (CDCl3) δ 3.27 (s, 2H), 2.77 (s, 4H), 2.15 (s, 3H), 1.94 (s, 6H), 1.51 (s, 6H).
N-(3-azidopropyl)-3-methyl-3-(2,4,5-trimethyl-3,6-dioxocyclohexa-1,4-dienyl) butanamide (1)
To a solution of c (443 mg, 1.28 mmol) in DMF (5 ml) was added diisopropylethylamine (DIEA, 523 μl, 3.06 mmol), followed by 3-azidopropylamine (153 mg, 1.53 mmol). The reaction mixture was stirred overnight at 50 °C, diluted with ethyl acetate (30 ml), washed with NH4Cl and brine, and dried over MgSO4. Solvent was reduced and the residue was purified by silica gel chromatography (hex/EtOAc, 2:1) to give 370 mg (87%) of product as a yellow solid. 1H NMR 300 MHz (CDCl3) δ 3.30 (t, J = 6.6, 2H), 3.23 (q, J = 6.6, 2H), 2.81 (s, 2H), 2.12 (s, 3H), 1.96 (m, 3H), 1.94 (m, 3H), 1.70 (quint, J = 6.6, 2H), 1.41 (s, 6H). Mass (ES) m/z 333.0 ([M+1]+).
Click reaction to attach 1 onto acetylene-terminated Si(111)
The click reaction of acetylene-terminated Si(111) (Scheme 1, Step 3) with 1 (Scheme 2) was carried out in anhydrous DMF. Relative to the azide, 20 mol% sodium ascorbate was added, followed by 10 mol% of CuSO4·5H2O, and a 10 mM azide solution of 1 in DMF. The reaction was run for 12 hours in the glove box. After the reaction, the surface was sonicated in DMF for 5 minutes three times and then rinsed with methanol and blow dried under N2(g).
Electrochemical activation to attach ferrocene
1 was attached to acetylene-terminated Si(111) using the Cu(I)-catalyzed click reaction (Scheme 1, Step 3), to form 1s (Scheme 3). Reductive electrochemistry (−800 mV referenced to Ag/AgCl) was performed to convert the modified benzoquinone to hydroquinone in degassed DPBS (pH 7.4). The hydroquinone then underwent an intramolecular cyclization reaction leaving a free amine on the surface (2s) and releasing a lactone species (2l). This amine terminus allows for a variety of subsequent reactions, including amide coupling chemistry, which is commonly utilized to attach biomolecules to surfaces. We first illustrated the use of this electrochemical reduction process to attach ferrocene carboxylic acid to the surface, to form 3s, via amide coupling chemistry. Ferrocene carboxylic acid (0.02 M) and N,N’-diisopropylcarbodiimide (DIC) (0.13 M) in DMF were added to the free amine surface. The amide coupling reaction was run overnight covered in an N2-purged glove box. The surface was then sonicated three times in DMF, then MeOH, and then blown dry.
Scheme 3.

The chemical and electrochemical steps involved in non-oxidatively activating Si(111) surfaces. The molecules or molecular components are colored to highlight their different functions. 1s represents the surface-bound benzoquinone that resulted from the click reaction of 1 to the acetylene-modified Si(111) surface (reacted acetylene group drawn in black). Upon reduction at −800 mV (vs Ag/AgCl) of the benzoquinone to the hydroquinone, an intramolecular cyclization reaction ensues to produce 2l (red lactone leaving group) and 2s (the green triazole ring with an amine terminus). This represents the activated surface. The ferrocene carboxylic acid (orange), a second electrochemically active molecule, is then coupled to the Si(111) surface.
Electrochemical activation to attach biotin
Biotin (0.02 M) and DIC (0.13 M) in DMF were added to the free amine surface 2s. The amide coupling reaction was run overnight in an N2-purged glove box at 50 °C. The surface was then sonicated three times in DMF, then MeOH, and blow dried. Subsequently, the Nanogold streptavidin (10 pM in 0.05% Tween20/DPBS) was introduced for 15 min. The surface was sonicated in 0.05% Tween20/DPBS for 25 min and then water for 5 min. The gold particles were then amplified with gold enhancement reagents for 10 min and then sonicated in water for 5 min.
Surface Characterization Methods
X-ray Photoelectron Spectroscopy
X-ray photoelectron spectroscopy (XPS) was utilized to characterize many of the steps of both Schemes 1 and 3. All XPS measurements were performed in an ultra-high vacuum chamber of an M-probe surface spectrometer that has been previously described.56 All measurements were taken on the center of the sample at room temperature. Monochromatic Al Kα X-rays (1486.6 eV) were incident at 35° from the sample surface and were used to excite electrons from samples. The emitted electrons were collected by a hemispherical analyzer at a take-off angle of 35° from the plane of the sample surface.
ESCA-2000 software was used to collect and analyze the data. To get an overview of the species present in the sample, survey scans were run from 0 to 1000 binding eV (BeV). The Si 2p (97-106 BeV), Cl 2p (196-206 BeV), C 1s (282-292 BeV), N 1s (393-407 BeV), Fe 2p (695-745 BeV), and Au 4f (77-97 BeV) regions were investigated in detail.
Contact Angle Measurements
The sessile contact angle of water on the functionalized Si(111) surface was used to check the fidelity of the monolayer for all surfaces of Schemes 1 and 3 except H- and Cl-terminated Si(111). Contact angle measurements were obtained with an NRL C.A. Goniometer Model #100-00 (Rame-Hart, Inc.) at room temperature. Contact angles, θ, were measured from sessile drops by lowering a 1 μl drop from a syringe needle onto the surface. This was repeated three times and averaged to obtain the θ for the surface.
Electrochemical Characterization of Surface Coverages
Electrochemistry was performed in a custom-made cell using a VMP Multi-Potentiostat (Princeton Applied Research, Oak Ridge, TN) (Figure 3). Dulbecco’s Phosphate Buffered Saline (DPBS) was used as the electrolyte, with silicon as a working electrode, a Pt coil as a counter electrode, and an Ag/AgCl reference electrode. Cyclic voltammetry was carried out at a rate of 100 mV/s. Molecular coverage was obtained by integrating the cathodic peak of the first scan in which all the modified benzoquinone was reduced to hydroquinone.
Figure 3.
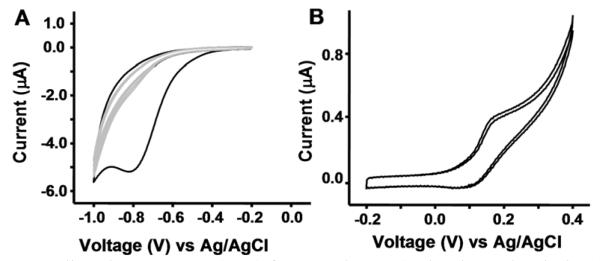
Cyclic voltammograms (CVs) for 1s and 3s. A) The electrochemical activation of 1s to 2s. The black trace is of the first scan, and the grey traces are of two subsequent scans, indicating nearly complete conversion of benzoquinone to hydroquinone during the first scan. B) The reversible oxidation of 3s. Two subsequent scans are shown. CVs were performed at a rate of 100 mV/s with voltages relative to Ag/AgCl.
Infrared Surface Characterization
The H- and H-C≡C-terminated Si(111) surfaces were characterized by Attenuated Total Reflection Fourier Transform Infrared Spectroscopy (ATR-FTIR). The Si(111) surfaces were prepared from single-crystal, polished Si(111), miscut 3-4°, boron-doped (p-type), 500-550 μm thick, and with 4-20 Ω-cm resistivity (Addison Engineering, Inc., San Jose, CA). Samples were cut into (2 cm × 2 cm) pieces. Samples underwent the acetylenylation and click reactions as described above. Samples were mounted on a Germanium ATR crystal (GATR, Harrick Scientific Products, Inc.) for a grazing angle of 65°. The sample was placed in a Vertex 70 FT-IR spectrometer (Bruker Optics Inc.) for measurements. In an air-purged sample chamber, 512 or 1024 scans were taken, with background scans of air subtracted from the spectra. Spectra were fitted with a linear baseline prior to analysis.
Results
XPS Survey Scans and Contact Angle Measurements
XPS survey scans revealed the progression of the acetylenylation and click chemistry steps. For a freshly prepared, H-terminated Si(111) surface (H-[Si(111)]), Si 2p and Si 2s peaks were observed, at 100 BeV and 150 BeV, respectively. Additional small C ls and O ls peaks, corresponding to adventitiously adsorbed carbon and oxygen on the surface, were also detected. After chlorination of H-[Si(111)] by PCl5, two new peaks at 200 BeV and 270 BeV appeared in the XPS spectrum, representing the Cl 2p and Cl 2s electrons, respectively. Upon a treatment with sodium acetylide, the chlorine peaks disappeared and a pronounced C 1s appeared at 285 BeV, verifying that the acetylene-terminated Si(111) surface (H-C≡C-[Si(111)]) has been generated. Other adsorbed carbon can contribute to the C 1s peak intensity for this scan. After the click reaction, a new N 1s peak appears at 400 BeV.
Sessile contact angles were also quantified for the various surface functionalization steps described in Schemes 1 and 3, and those values are listed in Table 1.
Table 1.
Measured contact angles for various Si(111) surfaces.
| Surfaces | Contact Angle (°) |
|---|---|
| H-C≡C-[Si(111)] | 77 ± 2 |
| 1s | 68 ± 2 |
| 2s | 60 ± 2 |
| 3s | 59 ± 2 |
High Resolution XPS Measurements
High resolution XPS measurements were utilized to quantitate the chemical steps of Schemes 1 and 3. In particular, the Si 2p region was used to monitor the growth of silicon oxides as a function of exposure time to air (Figure 1) and as a function of the chemical and electrochemical steps of Scheme 3 (Figure 2A) in two sets of experiments. For both measurements, a Shirley baseline was applied to each spectrum before the peaks were fitted. Peak line shapes for bulk Si 2p3/2 and 2p1/2 were fitted to Voigt functions fixed at 95% Gaussian and 5% Lorentzian, with a 15% asymmetry. The Si 2p1/2 and 2p3/2 peaks were fitted with the two peaks held 0.6 BeV apart, the full width at half maximum (FWHM) was fixed at 1, and the integrated area ratio of the 2p1/2/2p3/2 peaks was fixed at 0.51, as has been previously described.30-32,39 The broad peak between 100 and 104 BeV was assigned as Si+ to Si4+ oxides and was fitted to a third peak. The positions of the three peaks and the width of the third peak were optimized to get the best fit to the experimental spectrum. For very thin oxide layers, the oxide coverage was calculated from the SiOx:Si 2p peak area ratio. This was determined by dividing the area under the third peak by the total area of the Si 2p3/2 and 2p1/2 peaks.32 The SiOx:Si 2p peak area ratio was then divided by a normalization constant of 0.21 for Si(111) to estimate the fraction of surface atoms that were oxidized.30-32 We estimated that there were approximately 0.25 equivalent monolayers of SiOx on the acetylene-terminated Si(111) surface after 6 days exposure to air (Figure 1). This is consistent with other results that have shown stability towards oxidation for as long as 60 days in air.40 Following the formation of 1s and the reduction of 1s to 2s at −800 mV (Scheme 3) in aqueous electrolyte, the amount of SiOx was calculated to be 0.29 and 0.34 equivalent monolayers, respectively.
Figure 1.

XPS data of H-C≡C-[Si(111)], collected in the Si 2p region, and taken after exposure to air for up to 160 hours. The peaks for SiOx species should appear between 100 and 104 BeV. The amount of oxidation of the Si(111) can be estimated from this data to be about 0.25 equivalent monolayers. The Si 2p features are normalized to the same height for all three scans. The 37, 79, 160 hours scans are shown offset from the 0 hours scan to reveal the spectral detail. For the 4 scans, the amount of SiOx, as extracted from fits to the spectra, are 0.0 , 0.18, 0.21, and 0.25 equivalent monolayers, with increasing time.
Figure 2.

High resolution XPS spectra of H-C≡C-[Si(111)], and of that surface following the click reaction to form 1s and the reduction of 1s to 2s. A) Si 2p region revealing the near absence of oxide growth during the Cu(I)-catalyzed click reaction, and during the reductive transformation of 1s to 2s. B) Scan of the C 1s region of H-C≡C-[Si(111)]. The Si-C peak is unique to H-C≡C-[Si(111)] surfaces. The C-C peak contains contributions from the C≡C bond and adventitious carbon from the environment. The C-O peak present also arises from adventitious hydrocarbons. C) Scan of the N 1s region of 1s, validating the click formation of 1s. The area ratio of the three peaks is 1:2:1, respectively. D) Scan of the Fe 2p region showing the formation of 3s via the amide coupling of ferrocene carboxylic acid to 2s. The control plots are of 1s (dark grey) and the H-C≡C-[Si(111)] surface (light grey) after exposure to ferrocene carboxylic acid under the same conditions.
The H-C≡C-[Si(111)] surface was also characterized using high resolution XPS of the C 1s spectrum (Figure 2B). This spectrum was deconvoluted and fitted to three peaks, the silicon-bonded carbon at 283.8 BeV, the carbon-bonded carbon at 284.9 BeV, and the oxygen-bonded carbon at 286.8 BeV. As developed by Nemanick,38,39 peaks were fitted to Voigt functions having 70% Gaussian and 30% Lorentzian line shapes. The peak center-to-center distances were fixed at 1.1 BeV between the Si-C and C-C peaks, and at 2.9 BeV between the Si-C and O-C peaks. To calculate the surface coverage of the acetylene the integrated area under the silicon-bonded carbon peak was ratioed to the total integrated area of the Si 2p3/2 and 2p1/2 peaks and normalized with respect to scan time. The ratio calculated was referenced to a methyl terminated Si(111) surface that was scanned under the same conditions. The effective coverage of acetylene on the Si surface was 97 ± 5 %, consistent with other measurements of such surfaces.40 The statistical uncertainty in this number is largely determined by the signal-to-noise ratio of the XPS data (~30:1).
The high resolution N 1s spectrum of 1s illustrates the attachment of the benzoquinone (1) via click chemistry (Figure 2C). The spectrum was deconvoluted and fitted to three peaks, each composed of 80% Gaussian and 20% Lorentzian line shapes.57 The three peaks correspond to the amide nitrogen at 401.7 BeV, the doubly bonded nitrogen atoms (in the triazole ring) at 400.3 BeV, and the singly bonded nitrogen (in the triazole ring) at 398.2 BeV, respectively. The ratio of peak areas was found to be 1:2:1, consistent with the structure of 1s. After electrochemical cleavage to 2s, the N 1s region remained unchanged.
Figure 2D is a high resolution scan of the Fe 2p region that demonstrates the attachment of ferrocene carboxylic acid onto 2s to form 3s. The Fe 2p3/2 and 2p1/2 peaks occur at 711.3 and 724.8 BeV, respectively. It is difficult to quantify the amount of iron from such data because the peak shape is highly asymmetric and hard to deconvolute with a single Gaussian/Lorentzian function due to the strong multiplet splitting.57 However, as discussed below, the surface coverage of 3s can be estimated from cyclic voltammetry measurements. Figure 2D also shows two control experiments. Although a trace amount of ferrocene residue is detected on the controls, this measurement does confirm that the large majority of ferrocene is the result of the covalent bond formation between carboxylic acid of the ferrocene and the free amine of 2s.
Electrochemical Measurements
Figure 3A depicts the cyclic voltammogram (CV) for 1s. The prominent cathodic peak in the first scan confirms the presence of electroactive benzoquinone and, therefore, that the click reaction proceeded. Molecular coverage was obtained by integrating the cathodic peak of the first scan in which all the modified benzoquinone was reduced to hydroquinone. Complete conversion of 1s to 2s accompanied by the release of 2l (Scheme 3) was achieved at potentials below −0.9 V. Consecutive CV scans show that no detectable benzoquinone remained. For the determination of coverage, the area under the cathodic peak was obtained after subtracting the non-Faradaic current. This area was converted to the number of molecules by a stoichiometric ratio of 2 electrons to 1 electroactive molecule. Then the number of molecules was divided by the electrode surface area and then normalized to the Si atop atom surface density (7.8 × 10¹⁴ /cm2 for Si(111)).17 The coverage calculated for 1s on the H-C≡C-[Si(111)] was 6.7 ± 0.3 %.
Figure 3B represents a CV of 3s, the product of the amide coupling of ferrocene carboxylic acid with 2s. The CV shows reversible Fc0/+ redox behavior, as expected for ferrocene oxidation. The peak spacing confirms that ferrocene is covalently attached (but not adsorbed) onto the surface. The coverage was calculated by integrating the anodic peak after subtracting the non-Faradaic current. The number of molecules was divided by the electrode surface area and normalized to Si atom surface density which is 7.8 × 10¹⁴ /cm2 for Si(111).17 The coverage calculated for 3s was 0.5%. We do not fully understand the low coverage of ferrocene molecules. A likely possibility is that the time and/or temperature conditions for the coupling reaction were not optimal. It is also possible that degradation of the surface by oxidative potential treatments might also reduce the coverage of ferrocene.
Discussion
The coverage values for H-C≡C-[Si(111)], surface 1s, and surface 3s are summarized in Table 2, calculated with respect to all atop sites on an unreconstructed Si(111) surface.
Table 2.
The measured molecular surface coverages for various Si(111) surfaces, as measured by XPS or electrochemistry (EC).
| Surfaces | Coverage (%) |
|---|---|
| H-C≡C-[Si(111)] | 97 ± 5 (XPS) |
| 1s – benzoquinone | 6.7 ± 0.3 (EC) |
| 3s – ferrocene | 0.5 (EC) |
The 97% coverage of the H-C≡C-[Si(111)] surface is consistent with the Si 2p XPS in Figure 1 (and other studies40) that indicated little surface-bound SiOx. The acetylene carbons are sp-hybridized, implying a perpendicular attachment to the Si(111) surface. The atomic radius for C is smaller than that for Si (0.70 Å versus 1.10 Å), and there is a 3.8-Å spacing between atop sites on Si(111). These values support the notion that a 100% passivation of Si(111) surfaces can be achieved using the approach we described here.
Additional support for 100% acetylenylation of Si(111) comes from the ATR-FTIR measurements of H-[Si(111)] and H-C≡C-[Si(111)] (Figure 4; black and grey traces, respectively). Whereas XPS allows analysis of the elemental composition of surfaces, infrared spectroscopy (IR) gives information about the types of chemical functionality on a surface. The spectra shown in Figure 4 are expanded to highlight the region containing the signature Si-H (2083 cm−1) stretching frequency that is observed for the H-[Si(111)]. The Si-H stretch is strong and sharp, indicating that the surface sites are passivated with one hydrogen atom per atop site. This is expected for a H-[Si(111)] freshly prepared by an NH4F(aq) etch.58 For H-C≡C-[Si(111)], the 2083 cm−1 vibration has quantitatively disappeared, again consistent with 100% acetylenylation and with other work.40 A weak C≡C stretch might be expected in this region (2120-2175 cm−1),40,46 although we have not observed it. When H-[Si(111)] is ethylated through a similar chlorination/alkylation procedure, the coverage of ethyl groups on the atop sites of the Si(111) surface is limited by steric interactions to be approximately 80%.37 Following the Grignard alkylation of Si(111), no Cl is detected on the surface,30 and FTIR data indicates that the remaining Si(111) atop sites are hydrogenated.59 For the ethylated surface, the 2083 cm−1 feature is broadened, shifted (to 2070 cm−1) and reduced in intensity to 14% of that observed for the H-[Si(111)] surface.59
Figure 4.

ATR-FTIR characterization of a H-[Si(111)] and H-C≡C-[Si(111)], in the region of the 2083 cm−1 Si-H mode.
The coverage of the electroactive benzoquinone 1 on Si(111) to form 1s was calculated to be ~7% of all available Si(111) atop sites. We previously reported on electrochemically activating Si(111) and Si(100) surfaces through the use of protected hydroquinones that were attached to H-terminated Si surfaces via UV activation.17 For those molecules, coverages of up to 23% were achievable on Si(111), although bulkier protection groups on the hydroquinone led to slightly reduced surface coverages, implying steric interactions played at least some role in limiting coverage. It is likely that steric interactions play a dominating role in determining the efficiency of the click reaction to form 1s. While the acetylene footprint may be approximated by the van der Waals radius of the carbon atom, the triazole ring formed upon the click reaction will obviously be much larger. In fact, it is possible that the click chemistry is only effective at the step edges of the Si(111) surface. We have extensively characterized various Si(111) surfaces that have been alkylated using the two-step chlorination/alkylation chemistry using high-resolution Scanning Tunneling Microscopy (STM). For both methylated31,36 and ethylated37 Si(111), we find that about 10% of the Si surface atoms lie at step edges. This arises from etch pits that are apparently formed during the chlorination step, implying that the H-C≡C-[Si(111)] surface likely has a similar morphology. In that case, acetylene groups located at step edges would not have the steric constraints that would limit the formation of the triazole ring. It is interesting that the 7% coverage of 2s is similar to the number of Si atop sites that would reside at step edges. We are currently investigating the H-C≡C-[Si(111)] and 1s surfaces using high resolution STM in an effort to test this hypothesis.
We observed that minimal oxide growth on an acetylenylated surface even after 6 days’ exposure to air, indicating nearly 100% passivation of the surface (Figure 1). Following the formation of 1s and electrochemical reduction of 1s to 2s at to reveal the free amine, the amount of SiOx was slightly increased to 0.29 and 0.34 equivalent monolayers, respectively. The oxidation growth observed was due to the click chemistry on acetylenylated surfaces that were minimally exposed to air during cleaning and preparation for reaction, and the electrochemistry which was carried out in an ambient (and aqueous) environment. It is notable that the limited oxide growth on the silicon even after all surface modifications afforded well-behaved electrodes.
There have been several reported examples of click reactions on metal surfaces, although relatively few papers have attempted to report quantitative coverage values. Chidsey’s group48-50 has reported on coverages of up to 55% of ferrocene molecules clicked onto N3-(CH2)n-S-[Au] SAMs. On gold, each organic group has approximately twice the area available to it (21.4 Å2/molecule for gold and 12.8 Å2/molecule for Si(111))17,60,61 as compared with the area available to each acetylene group on Si(111). However, even for the much more loosely packed SAM, steric interactions were attributed as the reason for the incomplete (55%) yield of the click reaction.
The stated goal of this work was to develop a general strategy for electrochemically directing the biofunctionalization of Si(111) surfaces without oxidizing the underlying Si(111). To this end, we demonstrated the electrochemical activation and subsequent attachment of the model biomolecule, biotin, using a modification of the chemistry described in Scheme 3 (see Experimental Methods). To detect surface-bound biotin, we utilized Au nanoparticle-labeled streptavidin (strept-Au) and followed through with electroless amplification of the Au to produce particles that were imaged using Scanning Electron Microscopy (SEM). Representative data from this experiment, shown in Figure 5, indicates that the selectivity for attachment of strept-Au onto 2s is about 100-fold greater than on two control surfaces, H-C≡C-[Si(111)] and 1s, both of which were also treated with biotin and exposed to strept-Au.
Figure 5.

Demonstration of bioattachment to acetylenylated Si(111) through reductive formation of 2s followed by the amide coupling of biotin. A) XPS of the biotinylated Si(111) surface following exposure to strept-Au, but prior to the electroless Au amplification. The Au 4f region is comprised of two spin-orbit coupled peaks: Au 4f7/2 (~84 BeV) and Au 4f5/2 (~88 BeV). The dotted trace is from H-C≡C-[Si(111)], and the grey trace is from 1s, each exposed to biotin and strept-Au as controls. The three SEM images (B, C, and D) are of the activated and biofunctionalized surface, plus two controls. All images were taken following the electroless amplification step. The scale bar is 1 μm. B) 2s, incubated with biotin, and exposed to strept-Au. C) H-C≡C-[Si(111)] incubated with biotin, and exposed to strept-Au. D) 1s incubated with biotin, and exposed to strept-Au. There are at least 500 Au nucleation sites on B, 5 on C, and 7 on D.
Conclusions
Acetylenylation of the Si(111) surface via the two-step chlorination/alkylation procedure was combined with click chemistry to provide a non-oxidative approach for adding chemical functionality to a silicon surface. Si(111) surfaces can be nearly 100% passivated with acetylene groups. A specifically designed, electroactive benzoquinone molecule has been immobilized to the H-C≡C-[Si(111)] surface. A 7% coverage of the benzoquinone was found, which suggests that the click reaction may have occurred at step edges on the H-C≡C-[Si(111)] surface. The attachment of an electroactive benzoquinone was highly selective and was accomplished with only a minimal amount of oxidation of the underlying Si(111). The electroactive benzoquinone was reduced and cleaved from the surface to produce an amine terminus. In separate experiments, ferrocene carboxylic acid and biotin were selectively and covalently immobilized to the electrochemically activated surface.
We believe this approach can be used as a general platform to prepare functional surfaces for various applications and can be extended towards the selective biopassivation of arrays of various types of nanomechanical and/or nanoelectronic sensor devices.
Acknowledgments
R.D.R. thanks the Bill and Melinda Gates Foundation. H.D.A. is supported by the National Science Foundation Graduate Research Fellowship. We acknowledge support from the National Cancer Institute and a subcontract from the MITRE Corporation for support of this research. The XPS measurements were carried out at the Molecular Materials Research Center of the Beckman Institute at Caltech. We thank Professor Nate Lewis, Dr. Pat Hurley, and Dr. Joe Nemanick for kind advice and help regarding the acetylenylation of Si(111).
References
- 1.Zheng G, Patolsky F, Cui Y, Wang WU, Lieber CM. Nature Biotechnol. 2005;23:1294. doi: 10.1038/nbt1138. and references therein. [DOI] [PubMed] [Google Scholar]
- 2.Beckmann N, Zahnd C, Huber F, Bietsch A, Plückthun A, Lang H-P, Güntherodt H-J, Hegner M, Gerber C. Proc. Natl. Acad. Sci. USA. 2005;102:14587. doi: 10.1073/pnas.0504917102. [DOI] [PMC free article] [PubMed] [Google Scholar]
- 3.Yue M, Lin H, Dedrick DE, Satyanarayana S, Majumdar A, Bedekar AS, Jenkins JW, Sundaram S. J. Microelectromech. Syst. 2004;13:290. [Google Scholar]
- 4.Reccius CH, Mannion JT, Cross JD, Craighead HG. Phys. Rev. Lett. 2005;95:268101. doi: 10.1103/PhysRevLett.95.268101. [DOI] [PubMed] [Google Scholar]
- 5.Stavis SM, Edel JB, Li YG, Samiee KT, Luo D, Craighead HG. J. Appl. Phys. 2005;98:044903. [Google Scholar]
- 6.Fan R, Karnik R, Yue M, Li DY, Majumdar A, Yang PD. Nano Lett. 2005;5:1633. doi: 10.1021/nl0509677. [DOI] [PubMed] [Google Scholar]
- 7.Karnik R, Castelino K, Fan R, Yang P, Majumdar A. Nano Lett. 2005;5:1638. doi: 10.1021/nl050966e. [DOI] [PubMed] [Google Scholar]
- 8.Craighead HG, James CD, Turner AMP. Curr. Opin. Solid State Mater. Sci. 2001;5:177. [Google Scholar]
- 9.Jung DR, Kapur R, Adams T, Giuliano KA, Mrksich M, Craighead HG, Taylor DL. Crit. Rev. Biotechnol. 2001;21:111. doi: 10.1080/20013891081700. [DOI] [PubMed] [Google Scholar]
- 10.Piner RD, Zhu J, Xu F, Hong S, Mirkin CA. Science. 1999;283:661. doi: 10.1126/science.283.5402.661. [DOI] [PubMed] [Google Scholar]
- 11.Lee K-B, Park S-J, Mirkin CA, Smith JC, Mrksich M. Science. 2003;295:1702. doi: 10.1126/science.1067172. [DOI] [PubMed] [Google Scholar]
- 12.Jung H, Dalal CK, Kuntz S, Shah R, Collier CP. Nano Lett. 2004;4:2171. [Google Scholar]
- 13.Yousaf M, Mrksich M. J. Am. Chem. Soc. 1999;121:4286. [Google Scholar]
- 14.Hodneland CD, Mrksich M. J. Am. Chem. Soc. 2000;122:4235. [Google Scholar]
- 15.Yeo W-S, Yousaf MN, Mrksich M. J. Am. Chem. Soc. 2003;125:14994. doi: 10.1021/ja038265b. [DOI] [PubMed] [Google Scholar]
- 16.Yeo W-S, Mrksich M. Adv. Mater. 2004;16:1352. [Google Scholar]
- 17.Bunimovich YL, Ge G, Beverly KC, Ries RS, Hood L, Heath JR. Langmuir. 2004;20:10630. doi: 10.1021/la047913h. [DOI] [PubMed] [Google Scholar]
- 18.Curreli M, Li C, Sun Y, Lei B, Gundersen MA, Thompson ME, Zhou C. J. Am. Chem. Soc. 2005;127:6922. doi: 10.1021/ja0503478. [DOI] [PubMed] [Google Scholar]
- 19.Hu K, Fan F-RF, Bard AJ, Hillier AC. J. Phys. Chem. B. 1997;101:8298. [Google Scholar]
- 20.Israelachvili J. Intermolecular and Surface Forces. Academic Press; London: 1985. [Google Scholar]
- 21.Yablonovitch E, Allara DL, Chang CC, Gmitter T, Bright TB. Phys. Rev. Lett. 1986;57:249. doi: 10.1103/PhysRevLett.57.249. [DOI] [PubMed] [Google Scholar]
- 22.Sung MM, Kluth GJ, Yauw OW, Maboudian R. Langmuir. 1997;13:6164. [Google Scholar]
- 23.Sieval AB, Demirel AL, Nissink JWM, Linford MR, van der Maas JH, de Jeu WH, Zuilhof H, Sudhölter EJR. Langmuir. 1998;14:1759. [Google Scholar]
- 24.Effenberger F, Gotz G, Bidlingmaier B, Wezstein M. Angew. Chem. Int. Ed. 1998;37:2462. doi: 10.1002/(SICI)1521-3773(19981002)37:18<2462::AID-ANIE2462>3.0.CO;2-R. [DOI] [PubMed] [Google Scholar]
- 25.Boukherroub R, Wayner DDM. J. Am. Chem. Soc. 1999;121:11513. [Google Scholar]
- 26.Linford MR, Fender P, Eisenberger PM, Chidsey CED. J. Am. Chem. Soc. 1995;117:3145. [Google Scholar]
- 27.Cicero RL, Linford MR, Chidsey CED. Langmuir. 2000;16:5688. [Google Scholar]
- 28.Buriak JM, Allen MJ. J. Am. Chem. Soc. 1998;120:1339. [Google Scholar]
- 29.Stewart MP, Buriak JM. J. Am. Chem. Soc. 2001;123:7821. doi: 10.1021/ja011116d. [DOI] [PubMed] [Google Scholar]
- 30.Webb LJ, Nemanick EJ, Biteen JS, Knapp DW, Michalak DJ, Traub MC, Chan ASY, Brunschwig BS, Lewis NS. J. Phys. Chem. B. 2005;9:3930. doi: 10.1021/jp047199c. [DOI] [PubMed] [Google Scholar]
- 31.Yu HB, Webb LJ, Ries RS, Solares SD, Goddard WA, Heath JR, Lewis NS. J. Phys. Chem. B. 2005;109:671. doi: 10.1021/jp047672m. [DOI] [PubMed] [Google Scholar]
- 32.Webb LJ, Lewis NS. J. Phys. Chem. B. 2003;107:5404. [Google Scholar]
- 33.Bansal A, Li XL, Yi SI, Weinberg WH, Lewis NS. J. Phys. Chem. B. 2001;105:10266. [Google Scholar]
- 34.Royea WJ, Juang A, Lewis NS. Appl. Phys. Lett. 2000;77:1988. [Google Scholar]
- 35.Bansal A, Lewis NS. J. Phys. Chem. B. 1998;102:4058. [Google Scholar]
- 36.Solares SD, Yu H, Webb LJ, Lewis NS, Heath JR, Goddard WA., III J. Am. Chem. Soc. 2006;128:3850. doi: 10.1021/ja055408g. [DOI] [PubMed] [Google Scholar]
- 37.Yu H, Webb LJ, Heath JR, Lewis NS. Appl. Phys. Lett. 2006 in press. [Google Scholar]
- 38.Nemanick EJ. Caltech Ph.D. Thesis. 2005. Chemical and Electrical Passivation of Single Crystal Silicon Surfaces through Covalently Bound Organic Monolayers. [Google Scholar]
- 39.Nemanick EJ, Hurley PT, Brunschwig BS, Lewis NS. J. Phys. Chem. B. 2006 doi: 10.1021/jp057070i. in press. [DOI] [PubMed] [Google Scholar]
- 40.Hurley PT, Nemanick EJ, Brunschwig BS, Lewis NS. submitted.
- 41.Kolb HC, Finn MG, Sharpless KB. Angew. Chem. Int. Ed. 2001;40:2004. doi: 10.1002/1521-3773(20010601)40:11<2004::AID-ANIE2004>3.0.CO;2-5. [DOI] [PubMed] [Google Scholar]
- 42.Bock VD, Hiemstra H, van Maarseveen JH. Eur. J. Org. Chem. 2006:51. and references therein. [Google Scholar]
- 43.Zhang Y, Luo S, Tang Y, Yu L, Hou K-Y, Cheng JP, Zeng X, Wang PG. Anal. Chem. 2006;78:2001. doi: 10.1021/ac051919+. [DOI] [PubMed] [Google Scholar]
- 44.Lummerstorfer T, Hoffmann H. J. Phys. Chem. B. 2004;108:3963. [Google Scholar]
- 45.Lee JK, Chi YS, Choi IS. Langmuir. 2004;20:3844. doi: 10.1021/la049748b. [DOI] [PubMed] [Google Scholar]
- 46.Li H, Cheng F, Duft AM, Adronov A. J. Am. Chem. Soc. 2005;127:14518. doi: 10.1021/ja054958b. [DOI] [PubMed] [Google Scholar]
- 47.Zirbs R, Kienberger F, Hinterdorfer P, Binder WH. Langmuir. 2005;21:8414. doi: 10.1021/la051387s. [DOI] [PubMed] [Google Scholar]
- 48.Collman JP, Devaraj NK, Chidsey CED. Langmuir. 2004;20:1051. doi: 10.1021/la0362977. [DOI] [PMC free article] [PubMed] [Google Scholar]
- 49.Collman JP, Devaraj NK, Eberspacher TPA, Chidsey CED. Langmuir. 2006;22:2457. doi: 10.1021/la052947q. [DOI] [PMC free article] [PubMed] [Google Scholar]
- 50.Devaraj NK, Dinolfo PH, Chidsey CED, Collman JP. J. Am. Chem. Soc. 2006;128:1794. doi: 10.1021/ja058380h. [DOI] [PMC free article] [PubMed] [Google Scholar]
- 51.Devaraj NK, Miller GP, Ebina W, Kakaradov B, Collman JP, Kool ET, Chidsey CED. J. Am. Chem. Soc. 2005;127:8600. doi: 10.1021/ja051462l. [DOI] [PMC free article] [PubMed] [Google Scholar]
- 52.Giovanelli D, Lawrence NS, Jiang L, Jones TGJ, Compton RG. Anal. Lett. 2003;36:2941. [Google Scholar]
- 53.Rousell C, Rohner TC, Jensen H, Girault HH. ChemPhysChem. 2003;4:200. doi: 10.1002/cphc.200390031. [DOI] [PubMed] [Google Scholar]
- 54.Zheng A, Shan D, Binghe W. J. Org. Chem. 1999;64:156. doi: 10.1021/jo981528d. [DOI] [PubMed] [Google Scholar]
- 55.Yeo W-S, Hodneland CD, Mrksich M. ChemBioChem. 2001:590. doi: 10.1002/1439-7633(20010803)2:7/8<590::AID-CBIC590>3.0.CO;2-D. [DOI] [PubMed] [Google Scholar]
- 56.Haber JA, Lewis NS. J. Phys. Chem. B. 2002;106:3639. [Google Scholar]
- 57.Babić-Samardžija K, Lupu C, Hackerman N, Barron AR, Luttge A. Langmuir. 2005;21:12187. doi: 10.1021/la051766l. [DOI] [PubMed] [Google Scholar]
- 58.Dumas P, Chabal YJ, Higashi GS. Phys. Rev. Lett. 1990;65:1124. doi: 10.1103/PhysRevLett.65.1124. [DOI] [PubMed] [Google Scholar]
- 59.Webb LJ, Rivillon S, Michalak DJ, Chabal YJ, Lewis NS. J. Phys. Chem. B. 2006;110:7349. doi: 10.1021/jp054618c. [DOI] [PubMed] [Google Scholar]
- 60.Strong L, Whitesides GM. Langmuir. 1988;4:546. [Google Scholar]
- 61.Chidsey CED, Bertozzi CR, Putvinski TM, Mujsce AM. J. Am. Chem. Soc. 1990;112:4301. [Google Scholar]