Abstract
Field induced droplet ionization mass spectrometry (FIDI-MS) comprises a soft ionization method to sample ions from the surface of microliter droplets. A pulsed electric field stretches neutral droplets until they develop dual Taylor cones, emitting streams of positively and negatively charged submicrometer droplets in opposite directions, with the desired polarity being directed into a mass spectrometer for analysis. This methodology is employed to study the heterogeneous ozonolysis of 1-palmitoyl-2-oleoyl-sn-phosphatidylglycerol (POPG) at the air–liquid interface in negative ion mode using FIDI mass spectrometry. Our results demonstrate unique characteristics of the heterogeneous reactions at the air–liquid interface. We observe the hydroxyhydroperoxide and the secondary ozonide as major products of POPG ozonolysis in the FIDI-MS spectra. These products are metastable and difficult to observe in the bulk phase, using standard electrospray ionization (ESI) for mass spectrometric analysis. We also present studies of the heterogeneous ozonolysis of a mixture of saturated and unsaturated phospholipids at the air–liquid interface. A mixture of the saturated phospholipid 1,2-dipalmitoyl-sn-phosphatidylglycerol (DPPG) and unsaturated POPG is investigated in negative ion mode using FIDI-MS while a mixture of 1,2-dipalmitoyl-sn-phosphatidylcholine (DPPC) and 1-stearoyl-2-oleoyl-sn-phosphatidylcholine (SOPC) surfactant is studied in positive ion mode. In both cases FIDI-MS shows the saturated and unsaturated pulmonary surfactants form a mixed interfacial layer. Only the unsaturated phospholipid reacts with ozone, forming products that are more hydrophilic than the saturated phospholipid. With extensive ozonolysis only the saturated phospholipid remains at the droplet surface. Combining these experimental observations with the results of computational analysis provides an improved understanding of the interfacial structure and chemistry of a surfactant layer system when subject to oxidative stress.
Introduction
Lung disease is the third leading cause of death in the United States and lung disease death rates are still increasing.1 A unique feature of the lungs is that they are constantly exposed to airborne environmental insults. Both short- and long-term exposure of lungs to pathogens, air pollutants, and other irritants can be a major cause of acute distress and contribute to chronic injuries such as cardiopulmonary mortality and lung cancer.1–3 Recently, Jerret et al. reported a significant increase in the risk of death from respiratory causes in association with air pollution which includes an increase in ozone (O3) concentration.4
Pulmonary surfactant is a lipid–protein mixture that lines the air–liquid interface of alveolae.5 The pulmonary surfactant comprises ~90% phospholipids and ~10% apoproteins by mass.6 Dipalmitoylphosphatidylcholine (DPPC) is the principal phospholipid component, which achieves very low surface tension (~0 mN/m) upon compression.7,8 However, it adsorbs and spreads at the air–liquid interface very slowly (0.5 μm2/s) at the physiological temperature (37 °C), which is below the temperature (Tm) for its gel-to-liquid crystalline-phase transition (41 °C).7,8 Unsaturated phospholipids, owing to their higher fluidity, improve adsorption and spreading properties of surfactant at the air–liquid interface.9 However, they cannot produce sufficiently low surface tensions when surfactant layers are compressed.8,10
An increasing number of studies have focused on the heterogeneous chemistry of small molecules at the air–liquid interface, mainly using mass spectrometric11 and spectroscopic12 techniques, as well as theoretical methods.13 Recently, real time monitoring of surface activity of fatty acids has been reported by two research groups.12,14 Voss et al. have reported competitive air/liquid interfacial activities involving palmitic acid and oleic acid utilizing broad-bandwidth, sum frequency generation spectroscopy.12 They observed that a mixed monolayer of the fatty acids was dominated by oleic acid, with palmitic acid becoming predominant when exposure to ozone results in oxidation of the oleic acid to more hydrophilic products. Using a single droplet, Gonzalez-Labrada et al. also reported a decrease in air/liquid interface activity of oleic acid after exposure to a monolayer to ozone.14 Related studies of biologically relevant systems have only just begun, despite their importance. For example, Colussi and co-workers recently reported heterogeneous reactions of O3 with ascorbic acid15 and uric acid,16 which are components of the pulmonary epithelial lining fluid, using ESI mass spectrometry.
Field-induced droplet ionization mass spectrometry (FIDI-MS) comprises a soft ionization method to sample ions from the surface of microliter droplets. FIDI-MS subjects neutral droplets to a strong electric field, leading to formation of dual Taylor cones in which streams of positively and negatively charged submicrometer droplets are emitted in opposite directions, forming what is essentially a dual electrospray ion source.11,17–19 It is ideally suited to monitor time dependent heterogeneous reactions at the air–liquid interface. Previously, our laboratory demonstrated probing time-resolved ozonolysis of oleic acid and oleoyl-L-α-lysophosphatidic acid using FIDI-MS.11 In practice, a quiescent hanging droplet is formed on the end of a capillary and then exposed to gas-phase reactants for a variable period of time, followed by FIDI-MS sampling of molecular species present in the interfacial layer (Figure 1).
Figure 1.
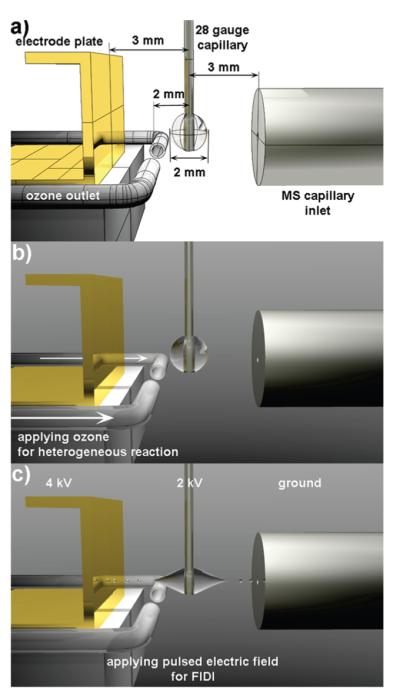
(a) Schematic illustration of FIDI-MS setup for heterogeneous reaction study. (b) Quiescent hanging droplet of analyte-containing solution on the end of a capillary is exposed to gas-phase reactants for a variable period of time. (c) After a suitable reaction time, a pulsed electric field stretches neutral droplets until they emit streams of positively and negatively charged submicrometer droplets in opposite directions. The reactants and products ions of heterogeneous reactions enter the capillary inlet of the mass analyzer.
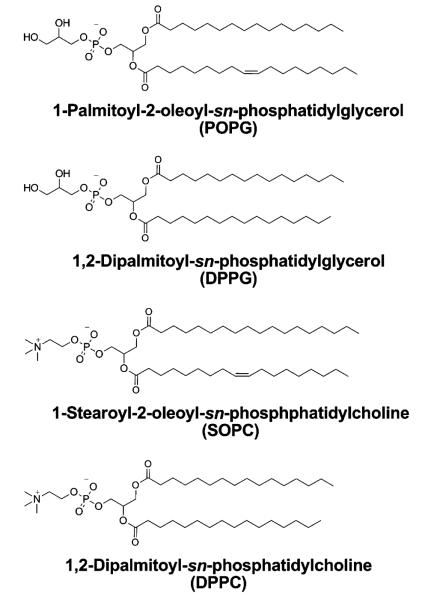
In this study, we utilize FIDI-MS for probing air–liquid interfacial oxidation by O3 of 1-palmitoyl-2-oleoyl-sn-phosphatidylglycerol (POPG), representative of the major unsaturated anionic lipids in lung surfactant. Sampling droplets with an interfacial layer of POPG exposed to O3 gas over a range of reaction times reveals the progress of distinct air–liquid interfacial chemistry. The competition of phospholipids subjected to a heterogeneous ozonolysis at the air–liquid interface is also studied using FIDI-MS. A mixture of the saturated phospholipid 1,2-dipalmitoyl-sn-phosphatidylglycerol (DPPG) and unsaturated POPG is investigated in negative ion mode using FIDI-MS. A mixture of 1,2-dipalmitoyl-sn-phosphatidylcholine (DPPC) and 1-stearoyl-2-oleoyl-sn-phosphatidylcholine (SOPC) surfactant is also studied to understand the air–liquid interfacial competition of phospholipids with different polar head groups in positive ion mode. Our results demonstrate that the relatively more hydrophilic products formed by oxidation of the unsaturated phospholipid dissolve back in the aqueous phase, leaving only saturated lipids at the interface. A detailed picture of the interfacial oxidation of unsaturated lipids by O3 is provided by molecular dynamic (MD) simulations to support our interpretation of the experimental results. Solvation energetics of reactants and products are also evaluated by means of computational modeling. Structures of phospholipids investigated in this study are shown in Scheme 1.
SCHEME 1.
Structures of POPG, DPPG, SOPC, and DPPC Investigated in This Study
Experimental Section
Chemicals and Reagents
Sodium salts of DPPC, DPPG, POPG, and SOPC were purchased from Avanti Polar Lipid (Alabaster, AL). All solvents (water and methanol) were purchased from EMD Chemicals Inc. (Gibbstown, NJ).
Online FIDI-MS Technique and Heterogeneous Oxidation by O3
The FIDI-MS instrument used in this investigation was based on the design previously described by Grimm et al.11 A ~ 2 mm o.d. droplet of analyte solution is suspended from the end of a 28-gauge stainless steel capillary (Small Parts Inc.), which is located between the atmospheric sampling inlet of a Thermo Finnigan LCQ Deca mass spectrometer and a parallel plate electrode. The droplet is centered between the plate electrode and the MS inlet, which are separated by 6 mm. A flow of air containing O3 is directed at both sides of the droplet by a paired ~1.6 mm (0.063 in.) id pyrex tubes located 1 mm from the droplet. Ozonolysis reactions occur between 0 and 30 s after a quiescent droplet is achieved (~1–2 s). Sampling is affected by pulsed voltages of 4 and 2 kV applied to the parallel plate electrode and supporting capillary, respectively. These voltages are tuned to be just above threshold for initiating FIDI. The high-voltage initiates FIDI and direct submicrometer sized charged progeny droplets into the LCQ for mass analysis. POPG and DPPG are monitored in negative ion mode and DPPC and SOPC are monitored in positive ion mode. The FIDI-MS spectra reported in this study were obtained by averaging five to ten individually acquired spectra from separately prepared droplets.
A pencil-style UV calibration lamp (model 6035, Oriel) generates ~20 ppm O3, measured spectrophotometrically using an absorption cell with 10 cm path length and calculated with Beer’s Law using the molar absorption coefficient of 1.15 × 10⁻¹⁷ cm2 molecule−1, in air that continually bathes the droplet at 1500 mL min−1. POPG (100 μM) or mixtures of 50 μM unsaturated phospholipid (POPG or SOPC) and 50 μM saturated phospholipid (DPPG or DPPC) in 1:1 (by volume) water and methanol feed the droplet source. A recent study of DPPC monolayer on the surface of a water–methanol mixture reported a decrease of the lipid density in the monolayer due to the gradual incorporation of methanol molecules in the monolayer without significant difference of structural and electrical property of the monolayer.20 In our study, we assume that the structures of the lipid surfactant layers on water–methanol mixtures are similar to their structures on water by itself.
Computational Modeling
The MD simulations were performed with the all-atom CHARMM PARAM2721 force field using the LAMMPS (large-scale atomic/molecular massively parallel simulator) code.22 To describe water, we used a flexible TIP3P potential, which incorporates additional Hooke’s constants, K, of 900 (kcal/mol)/Å2 for the OH bond and 110 (kcal/mol)/rad2 for the HOH angle to improve the three site rigid TIP3P model.21 The particle–particle particle-mesh method23 was employed to compute the electrostatic interactions using an accuracy criterion of 10−4.
The initial structures for the lipid monolayer–water systems were prepared with 48 hexagonally packed lipids on the 3168, 3264, 3744, and 4464 water molecules for the 55, 60, 65, and 70 Å2/lipid surface densities, respectively. A potential of the form, E = ε[2/15(σ/r)9 – (σ/r)3], where ε = 0.1521 kcal/mol and σ = 3.1538 Å with cutoff distance of 2.7071 Å, was applied at z = 0 to prevent water from diffusing in the negative z-direction. The dimensions of the simulation cells used were (55.21 × 47.82 × 200.0 Å) for the 55 Å2/lipid, (57.67 × 49.94 × 200.0 Å) for the 60 Å2/lipid, (60.02 × 51.98 × 200.0 Å) for the 65 Å2/lipid, and (62.28 × 53.94 × 200.0 Å) for the 70 Å2/lipid surface densities. The systems were equilibrated for 0.5 ns using 300KNVTMD simulations by applyinga Nose–Hoover thermostat with a temperature damping relaxation time of 0.1 ps. Then, 2.0 ns NVT MD simulations were performed, and these trajectories are employed for the analysis of the atomic profiles.
The solvation energy, ΔEsolv, of the DPPG, POPG, and oxidative products of POPG (aldehyde and carboxylic acid) were evaluated using the Poisson–Boltzmann model,24,25 which is implemented in the Jaguar V 7.5 package (Schrödinger, Inc., Portland, OR). To simplify considerations of the effect of functional groups on the solvation energies, analogous extended conformations of all species were employed for the calculations. DFT calculations were performed with the Becke three-parameter functional (B3)26 combined with the correlation functional of Lee, Yang, and Parr (LYP),27 using the 6-31G** basis set. To describe the water solvation, solvent probe radius and solvent dielectric constant were set as 1.4 Å and 80.4, respectively.
Results and Discussion
Interfacial Reaction of POPG with O3
The cis-double bond of an unsaturated phospholipid reacts with O3 yielding aldehyde and carboxylic acid products directly from primary ozonide (POZ) or through energetic Criegee intermediates (CI), while saturated phospholipids such as DPPG and DPPC remain intact. In this study we have investigated the heterogeneous reaction of O3 with POPG as a representative unsaturated phospholipid in the PS system.
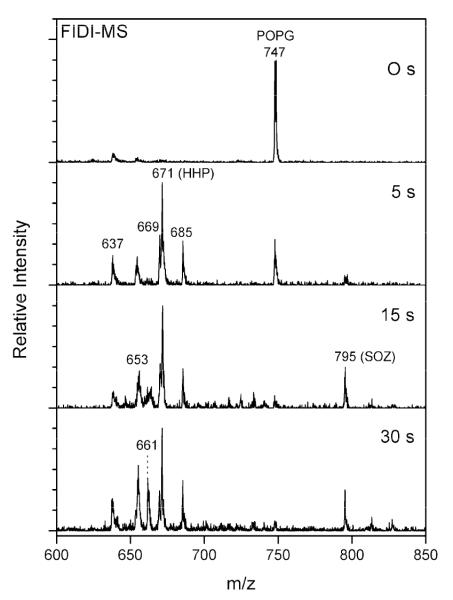
The negative ion FIDI-MS spectra for ozonolysis of POPG in a water/methanol (1:1 by volume) droplet are shown in Figure 2. Singly deprotonated POPG, observed at m/z 747, is seen as a dominant species in the FIDI-MS spectrum before O3 application. Products resulting from ozonolysis of POPG appear at least as early as 5 s after exposing the droplet to O3. The aldehyde and carboxylic acid products are observed at m/z 637 and m/z 653, respectively. In addition, hydroxyhydroperoxide (HHP), methoxyhydroperoxide (MHP), and what we assume to be the secondary ozonide (SOZ) are also observed as products of POPG ozonolysis at m/z 671, m/z 685, and m/z 795, respectively. The relative abundance of the reactant POPG decreases dramatically after 15 s of exposure, and the FIDI-MS spectrum is dominated by ozonolysis products after 30 s.
Figure 2.
Heterogeneous reaction of POPG with O3 as a function of time. In the absence of ozone, the negative ion FIDI-MS spectrum of POPG is dominated by the singly deprotonated POPG peak at m/z 747. POPG is depleted after 15 s of the exposure and oxidation products are dominated by deprotonated HHP at m/z 671. The aldehyde, carboxylic acid, and methoxyhydroperoxide products are observed at m/z 637, m/z 653, and m/z 685, respectively. The SOZ and sodiated alcohol products show up in the spectra at m/z 795 and m/z 661, respectively. The structure of each product is shown in Scheme 1.
The formation of primary ozonide (POZ), which is the first step in the ozonolysis of POPG at the air–liquid interface, is described as
| (1) |
The ozone concentration is assumed to be constant during the reaction, which allows calculating the reaction rate using the pseudofirst order rate constant k2 ) k1[O3], where k1 ) 4.5 × 10⁻¹⁶ cm3 molecule−1 s−1 adopted from ozonolysis of OPPC on NaCl.28 The applied ozone concentration is ~5 × 10¹⁴ molecules cm−3 (20 ppm). The reaction rate is expressed as
| (2) |
Solving eq 2 gives
| (3) |
For 90% and 99% depletion of POPG at the air–liquid interface, it takes ~10 and ~20 s, respectively. This agrees well with the experimental observation of this study.
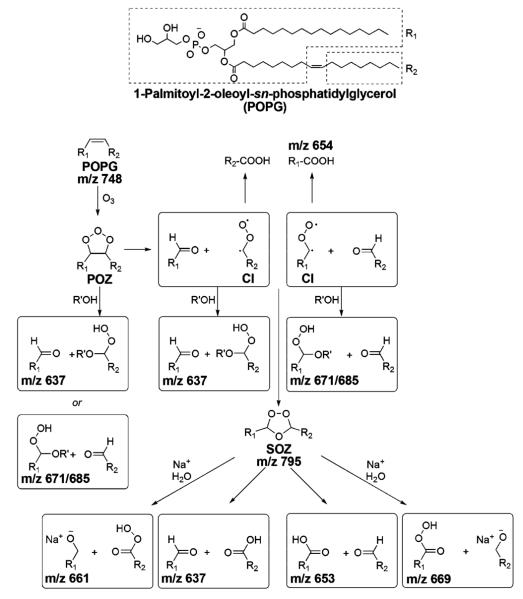
It is noteworthy that hydroxyhydroperoxide (HHP), methoxyhydroperoxide (MHP), and the SOZ, which are known to be metastable species in the bulk phase, are observed as major products of POPG ozonolysis in the FIDI-MS spectra (Figure 2).28 To yield HHP, a Criegee intermediate (CI) or a POZ is required to react with a water molecule.28,29 Rapid decomposition of HHP through proton transfers from water molecules yields ROS,29 which makes it difficult to observe HHP directly in the bulk phase. The water density at the air–liquid interfacial region is significantly lower than in the bulk phase.30 In addition, water molecules in a lipid layer at the air–liquid interface are observed to be localized within the lipid headgroup region due to the strong interactions with polar head groups.31 These conditions allow HHP to be abundant in the lipid layer at the air–liquid interface, which is a characteristic of the heterogeneous reaction of POPG compared to the homogeneous reaction.29 The observed MHP originates from the reaction of a CI or POZ with a methanol molecule in the droplet. The proposed reaction mechanisms are shown in Scheme 2.
SCHEME 2.
Summary of Heterogeneous Oxidation of POPG with O3 at the Air–Liquid Interfacea
a R’ is H for water and CH3 for methanol.
A significant abundance of SOZ is observed in the FIDI-MS spectra after exposing the droplet to O3 for 15 s. The structure of SOZ (m/z 795) is confirmed by low energy collision induced dissociation (CID), which yields the aldehyde (m/z 637) and carboxylic acid (m/z 653) fragments (Figure S1 in Supporting Information). The peak corresponding to SOZ continues to build up in the spectrum as the POPG lipid is depleted. We infer that the observed SOZ is not formed by direct rearrangement of POZ but rather by recombination of the CI with aldehydes (Scheme 2).28,32 In the bulk phase, however, faster reaction with water molecules prevents the CI from reacting with aldehyde to form SOZ.33 A significant amount of the sodiated alcohol product (m/z 661) is observed after exposing the droplet to O3 for 30 s. This product is due to the dissociation of SOZ followed by the association with sodium cation. This suggests that after SOZ is produced in an anhydrous environment, the newly formed hydrophilic molecule interacts with sodium cation in the liquid phase to yield the sodiated alcohol product. These SOZ and sodiated alcohol products are characteristic of specific air–liquid interface chemistry during POPG ozonolysis.
Interfacial Reaction of a POPG and DPPG Mixture with O3
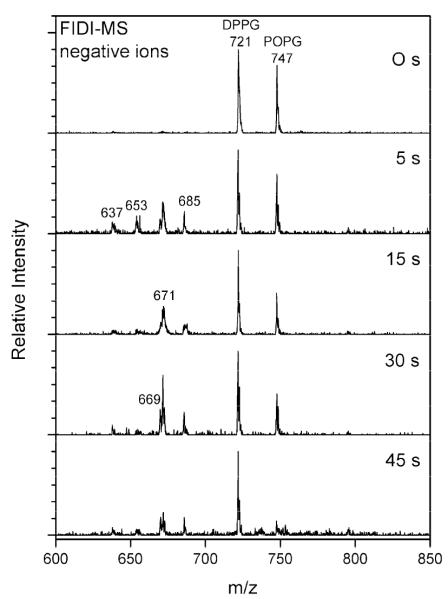
Figure 3 shows negative ion FIDI-MS spectra for the heterogeneous ozonolysis at several reaction times of a mixture of DPPG and POPG at the air–liquid interface. Conditions employed are identical to those used to obtain the data shown in Figure 2. Singly deprotonated DPPG and POPG, observed at m/z 721 and m/z 747, respectively, dominate the FIDI-MS spectrum before O3 application, suggesting that the pulmonary surfactants DPPG and POPG form a mixed interfacial layer. The products resulting from the ozonolysis of POPG appear at least as early as 5 s after exposing the droplet to O3. All products, including aldehyde (m/z 637), carboxylic acid (m/z 653), HHP (m/z 671), and MHP (m/z 685), are observed to result from ozonolysis of POPG in the mixed surfactant system. The relative abundance of the reactant POPG decreases by half after 15 s of exposure, while the product abundance continues to increase after up to 30 s of exposure. The FIDI-MS spectrum is dominated by DPPG after 45 s.
Figure 3.
Heterogeneous reaction of a 1:1 mixture of POPG and DPPG with O3 as a function of time. In the absence of ozone, the negative ion FIDI-MS spectrum is dominated by singly deprotonated POPG and DPPG at m/z 747 and m/z 721, respectively. The oxidation products of POPG including aldehyde (m/z 637), carboxylic acid (m/z 653), HHP (m/z 671), and MHP (m/z 685) are observed after 5 s of O3 exposure. Singly deprotonated DPPG dominates the FIDI-MS spectrum after 45 s.
The absence of any ozonolysis products from the saturated lipid DPPG indicates that only the unsaturated lipid POPG reacts with ozone. Several differences are observed from the heterogeneous ozonolysis of the DPPG and POPG mixture compared to the ozonolysis of POPG alone. First, with extensive ozonolysis, the products disappear from the surface of the droplet, leaving only DPPG at the interface. The ozonolysis products of POPG are expected to be more hydrophilic than the precursor (Scheme 2). The data in Figure 3 suggest that these hydrophilic products diffuse into the aqueous droplet, leaving only hydrophobic DPPG in the interfacial surfactant layer. Comparison of the results in Figures 2 and 3 indicate that the overall ozonolysis reaction of POPG, including the depletion of POPG on the surface of the droplet, is slower in a mixture with DPPG.
The lipid tails of DPPG adopt a highly ordered arrangement in a surfactant monolayer.34 In the mixture of a DPPG and POPG, the saturated acyl chains of DPPG may act to shield POPG, limiting the approach of O3 to the unsaturated carbons of POPG, with a corresponding slower reaction compared to POPG alone. Note also that a significant abundance of SOZ is not observed in the FIDI-MS spectrum of a mixture of DPPG and POPG (Figure 3). As discussed earlier, SOZ is formed by the recombination of the CI with aldehyde under an anhydrous environment (Scheme 2).28,32 In the mixed surfactant layer, competition on the droplet surface is expected between hydrophobic DPPG and the relatively hydrophilic nascent products of POPG ozonolysis. This accounts for the observed predominance of DPPG in the FIDI-MS data at long times.
Interfacial Reaction of a SOPC and DPPC Mixture with O3
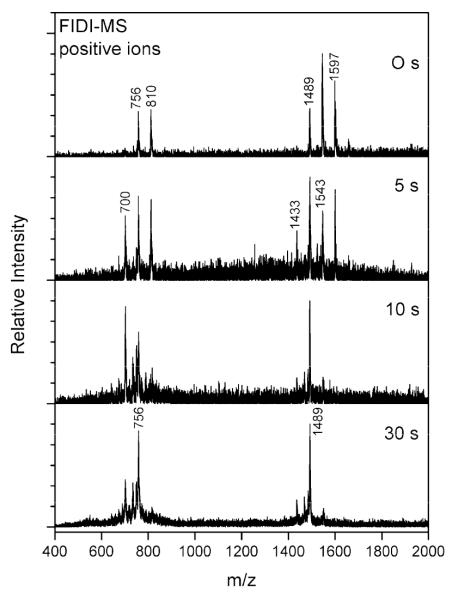
We also investigated the heterogeneous reaction of O3 with a mixture of saturated and unsaturated lipids using SOPC and DPPC in the positive ion mode (Figure 4). In contrast to phosphatidylglycerol (PG), the positive ion mode FIDI-MS spectra of phosphatidylcholine (PC) show additional dimeric complexes along with monomers as sodiated species. The sodiated DPPC and SOPC monomers are observed at m/z 756 and m/z 810, respectively. The sodiated complexes at m/z 1489 and m/z 1597 are DPPC dimer and SOPC dimer, respectively. The heterogeneous dimeric complex of DPPC and SOPC is observed at m/z 1543. The measured intensity of the homogeneous and heterogeneous dimeric complexes are not very different from the statistical ratio (1:2:1), indicating that DPPC and SOPC form a well-mixed interfacial layer. The FIDI-MS spectrum reveals the ozonolysis products after 5 s of O3 exposure. The product at m/z 700 corresponds to the sodiated aldehyde product of SOPC. The sodiated complex of intact SOPC and the aldehyde product of SOPC are observed at m/z 1543. With extensive ozonolysis (15 s), SOPC is depleted, and eventually the aldehyde products also disappear from the spectrum, suggesting that only DPPC remains in the surfactant layer.
Figure 4.
Heterogeneous reaction of a 1:1 mixture of SOPC and DPPC with O3 as a function of time. In the absence of ozone, the positive ion FIDI-MS spectrum shows the singly charged sodiated DPPC and SOPC monomoers at m/z 756 and m/z 810, respectively. The singly charged monosodiated DPPC and SOPC homodimers are observed at m/z 1489 and m/z 1597, respectively. The singly sodiated heterogeneous dimer of DPPC and SOPC appears at m/z 1543. The oxidation products of SOPC including monomeric aldehyde product (m/z 700) and the complex of DPPC and aldehyde product (m/z 1433) are observed after 5 s of O3 exposure. Sodiated DPPC monomers and dimers of DPPC dominate the FIDI-MS spectrum after 30 s.
In contrast to the negative FIDI-MS spectra of POPG, only aldehyde products are observed from the ozonolysis of SOPC. The only significant difference between the two lipids is the nature of the polar headgroup, which is acidic in the case of the phosphatidylglycerol lipid and amphoteric (zwitterionic) in the case of the phosphatidylcholine lipid. However, it is not obvious how this might influence the observed difference in ozonolysis products. The two mixtures are similar in that at long times the more hydrophilic oxidation products disappear from the spectra as they are dissolved into the aqueous phase.
Note also that depletion of SOPC oxidation products occurs more rapidly from ozonolysis of the mixture of SOPC and DPPC compared to ozonolysis of the POPG and DPPG mixture. In forming a surfactant layer the fatty acid chains of the saturated phospholipid DPPC exhibit less-orderly packing compared to those of DPPG.34 More random orientation of DPPC fatty acid chains may cover unsaturated carbons of SOPC less effectively compared to DPPG, allowing SOPC to react with ozone more easily.
Water Density at the Position of Unsaturated Carbons in a Lipid Monolayer
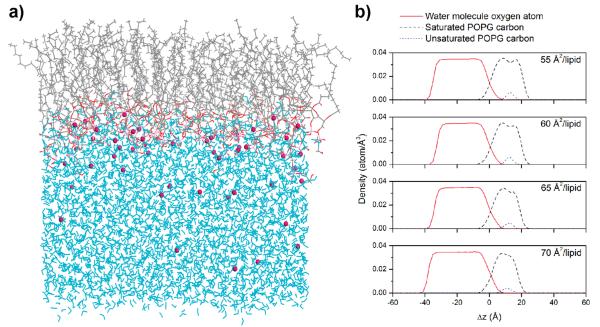
As discussed above, the unique low water density environment of the air–liquid interface may allow us to observe metastable HHP and POZ in the heterogeneous ozonolysis of POPG. To develop a more detailed picture of the interfacial environment, we carried out MD simulations for the POPG monolayer in a water box for 2.0 ns with four different surface densities (55, 60, 65, and 70 Å2/lipid). These surface densities are reported as a proper density range for pulmonary surfactant function from previous theoretical studies.34–36 The final snapshot in Figure 5a shows the POPG monolayer at the air–liquid interface monolayer with 60 Å2/lipid surface density as a representative case. Figure 5b shows the atomic density profiles of oxygen atoms of water molecules, saturated carbon atoms, and unsaturated carbon atoms of lipid acyl chains along ±Δz, which is z-direction relative to the averaged position of the phosphorus atom of POPG. The interaction between POPG and water occurs in the region of overlapping density. The lipid headgroup is solvated, reflecting the strong ion–dipole interactions between the POPG phosphate group and water molecules. However, the water density at the double bond of POPG (5–20 Å) is ~0.0005 atom/Å3, which is ~70 times less dense than in the bulk phase (~0.035 atom/Å3) when the POPG monolayer has 60 Å2/lipid surface density. This indicates that a limited number of water molecules are involved when ozone interacts with the double bond of POPG. A single water molecule is required to form a HHP from a CI or a POZ.28,29 Further reactions with water molecules result in formation of ROS (Scheme 2).29 The low water concentrations around the double bond allow HHP to survive sufficiently long to be observed in the FIDI-MS Spectra. It is noteworthy that SOZ appears after POPG is depleted on the surface of the droplet (Figure 2). The fast reaction with water inhibits formation of SOZ from CI when water molecules are accessible.33 Depletion of the limited number of water molecules in the hydrophobic portion of the ordered lipid allows SOZ to form and accumulate in the surfactant layer.
Figure 5.
(a) Final snapshot after 2.0 ns of MD simulation of a POPG monolayer at 60 Å2/lipid. Water molecules and chloride ions are shown in cyan and purple, respectively. (b) Atomic density profiles of POPG monolayer systems as a function of Δz, where the air/liquid interface is 0 (negative values are toward the water layer, and positive values are toward the lipid). The lipid surface densities are 55, 60, 65, and 70 Å2/lipid. Red solid lines denote that of unsaturated carbons of lipid acyl chains, black dashed lines denote that of saturated carbons of lipid acyl chains, and blue dotted lines denote the density profiles of oxygen atoms of water molecules.
Solvation Energy of Phospholipids and Ozonolysis Products
We observe composition changes in the lipid surfactant layer resulting from ozonolysis of saturated and unsaturated phospholipid mixtures using time-resolved FIDI-MS (Figures 3 and 4). To understand the surface activity of phospholipids and their oxidized products, DFT calculations were performed to compute the solvation energy, ΔEsolv, for DPPG, POPG, and two products (carboxylate and aldehyde) from the ozonolysis of POPG. The calculated ΔEsolv indicates the energy difference between the gas phase and the solution phase. Lower values of ΔEsolv would be expected to correlate with higher surface activity of molecules at the air–liquid interface. In addition, ΔEsolv provides a measure of the relative hydrophobicities of similar molecules. These results provide a reasonable explanation of the observed disappearance of the ozonolysis products from the surface of the droplet over time. Calculations were performed for both neutral and anionic states of the phosphatidylglycerol group. Table 1 lists the calculated ΔEsolv values of DPPG, POPG, and the ozonolysis products of POPG. The solvation of a singly charged anion is energetically favored compared to the corresponding neutral lipid by ~58 kcal/mol. Both anionic and neutral DPPG and POPG exhibit similar stability in the solution phase. This supports our hypothesis, based on the observed lipid distribution in the FIDI-MS spectrum shown in Figure 3, that both DPPG and POPG are colocated at the surface of the droplet. Carboxylic acid products are more stable in the solution phase compared to intact DPPG and POPG by ~8 kcal/mol. Once the carboxylic acid dissolves in the solution phase, further stability can be achieved by deprotonation of carboxyl group. The ΔEsolv of an aldehyde product is calculated as ~4.5 kcal/mol less than that of an intact POPG. However, it is ~3.7 kcal/mol higher than the ΔEsolv of a carboxylic acid product. This indicates that aldehyde products have higher surface activity than carboxylic acid products at the surface of the droplet. This agrees well with the positive ion mode FIDI-MS spectra, in which aldehyde is the predominant observed product from the ozonolysis of unsaturated phospholipids (Figure 4).
TABLE 1.
Calculated Solvation Energies of Phospholipids and Ozonolysis Products
| solvation energy (kcal/mol) | ||
|---|---|---|
| lipid | neutral | anionic |
| DPPG | −32.9 | −91.5a |
| POPG | −33.6 | −91.7a |
| aldehyde product | −38.3 | −96.2a |
| carboxylate product | −41.8 | −100,a −184b |
Singly charged anion with deprotonated phosphatidylglycerol group.
Doubly charged anion with deprotonated phosphatidylglycerol and carboxylate groups.
Conclusions
The FIDI-MS technique is well suited to analyze chemical reactions of phospholipids at the air–liquid interface. In FIDI-MS spectra, ozonolysis products distinct from those formed in both the bulk phase and the gas phase are observed from an interfacial phospholipid surfactant layer. MD simulations correlate well with experimental observations and provide additional insights into the interactions between lipids and water molecules in the interfacial region. In these simulations the low water density around unsaturated carbons of the lipid acyl chain provides a rationalization for the experimental observation of metastable products resulting from ozonolysis of unsaturated phospholipids.
In the lung, oxidation of pulmonary surfactant causes surfactant dysfunction in adsorption and respreading process, as well as reduction of surface tension.37,38 Once O3 traverses the air–liquid interface, it decays rapidly concomitant with the formation of ROS in regions with high water densities.39 However, due to the high reactivity with PS at the interface, it has been thought that little or none of the O3 can penetrate the PS monolayer to attack the epithelium cells below.40 Instead of direct attack by O3 and its derivative ROS, secondary oxidized products of PS, such as HHP, have been expected to yield cellular damage.40 Our FIDI-MS data indicate that more than 60% of the heterogeneous oxidation products of POPG by O3 are peroxides. These products, which are more water-soluble than the lipid precursors, eventually dissolve into the bulk liquid where they form ROS29 that can lead to cellular damage.
These findings provide mechanistic details for the reaction of ozone with unsaturated phospholipids, leading to possible damage of the pulmonary system by ROS or direct ozone exposure. Further studies with more elaborate model systems comprising surfactant proteins and various lipids could further clarify the effect of environmental exposures on the lung surfactant system. We have reported one such study, demonstrating that phospholipid surfactants have a profound effect in moderating the reactions of the important surfactant protein B with ozone.19
Supplementary Material
Acknowledgment
The research described in this paper was carried out at the Beckman Institute and the Noyes Laboratory of Chemical Physics at the California Institute of Technology, the Computational NanoBio Technology Laboratory at the Georgia Institute of Technology, and the Jet Propulsion Laboratory under a contract with the National Aeronautics and Space Administration and funded through the Director’s Research and Development Fund. We gratefully acknowledge financial support provided by National Science Foundation (NSF) under grant No. CHE-0416381 (JLB, PI) and the Beckman Institute Mass Spectrometry Resource Center. H.K. and W.A.G. acknowledge support from the WCU (World Class University) program through the National Research Foundation of Korea funded by the Ministry of Education, Science and Technology (R31-2008-000-10055-0). Y.S.S. and J.R.H. acknowledge the support of the National Cancer Institute under grant No. 5U54 CA119347 (JRH, PI).
Footnotes
Supporting Information Available: FIDI-MS2 spectrum of SOZ at m/z 795 and complete ref 21. This material is available free of charge via the Internet at http://pubs.acs.org.
References and Notes
- (1).Stansfield A, Jump Z, Sodlosky S, Rappaport S, Edelman N, Haldorsen J, Javed T, Martin C, Margulies E. Lung disease data: 2008. American Lung Association National Headquarters; Washington, DC: 2008. [Google Scholar]
- (2).Anseth J, Goffin A, Fuller G, Ghio A, Kao P, Upadhyay D. Am. J. Respir. Cell Mol. Biol. 2005;33:161. doi: 10.1165/rcmb.2004-0365OC. [DOI] [PMC free article] [PubMed] [Google Scholar]
- (3).Halliwell B, Gutteridge J. Biochem. J. 1984;219:1. doi: 10.1042/bj2190001. [DOI] [PMC free article] [PubMed] [Google Scholar]
- (4).Jerrett M, Burnett RT, Pope CA, Ito K, Thurston G, Krewski D, Shi YL, Calle E, Thun M. N. Engl. J. Med. 2009;360:1085. doi: 10.1056/NEJMoa0803894. [DOI] [PMC free article] [PubMed] [Google Scholar]
- (5).Vangolde LMG, Batenburg JJ, Robertson B. Physiol. Rev. 1988;68:374. doi: 10.1152/physrev.1988.68.2.374. [DOI] [PubMed] [Google Scholar]
- (6).Vangolde L, Batenburg J, Robertson B. Physiol. Rev. 1988;68:374. doi: 10.1152/physrev.1988.68.2.374. [DOI] [PubMed] [Google Scholar]
- (7).Schram V, Hall SB. Biophys. J. 2004;86:3734. doi: 10.1529/biophysj.10x.037630. [DOI] [PMC free article] [PubMed] [Google Scholar]
- (8).Hawco MW, Davis PJ, Keough KMW. J. Appl. Physiol. 1981;51:509. doi: 10.1152/jappl.1981.51.2.509. [DOI] [PubMed] [Google Scholar]
- (9).Hawco M, Davis P, Keough K. J. Appl. Physiol. 1981;51:509. doi: 10.1152/jappl.1981.51.2.509. [DOI] [PubMed] [Google Scholar]
- (10).Perez-Gil J. Biol. Neonate. 2002;81:6. doi: 10.1159/000056765. [DOI] [PubMed] [Google Scholar]
- (11).Grimm RL, Hodyss R, Beauchamp JL. Anal. Chem. 2006;78:3800. doi: 10.1021/ac0601922. [DOI] [PubMed] [Google Scholar]
- (12).Voss LF, Hadad CM, Allen HC. J. Phys. Chem. B. 2006;110:19487. doi: 10.1021/jp062595b. [DOI] [PubMed] [Google Scholar]
- (13).Mundy CJ, Kuo IFW. Chem. Rev. 2006;106:1282. doi: 10.1021/cr040375t. [DOI] [PubMed] [Google Scholar]
- (14).Gonzalez-Labrada E, Schmidt R, DeWolf CE. Phys. Chem. Chem. Phys. 2007;9:5814. doi: 10.1039/b707890k. [DOI] [PubMed] [Google Scholar]
- (15).Enami S, Hoffmann MR, Colussi AJ. Proc. Natl. Acad. Sci. U.S.A. 2008;105:7365. doi: 10.1073/pnas.0710791105. [DOI] [PMC free article] [PubMed] [Google Scholar]
- (16).Enami S, Hoffmann MR, Colussi AJ. J. Phys. Chem. B. 2008;112:4153. doi: 10.1021/jp712010k. [DOI] [PubMed] [Google Scholar]
- (17).Grimm RL, Beauchamp JL. J. Phys. Chem. B. 2003;107:14161. [Google Scholar]
- (18).Grimm RL, Beauchamp JL. J. Phys. Chem. B. 2005;109:8244. doi: 10.1021/jp0450540. [DOI] [PubMed] [Google Scholar]
- (19).Kim HI, Kim HJ, Shin YS, Beegle LW, Jang SS, Neidholdt EL, Goddard WA, Heath JR, Kanik I, Beauchamp JL. J. Am. Chem. Soc. 2010;132:2254. doi: 10.1021/ja908477w. [DOI] [PMC free article] [PubMed] [Google Scholar]
- (20).Weis M, Kopani M, Jakubovsky J, Danihel L. Appl. Surf. Sci. 2006;253:2425. [Google Scholar]
- (21).MacKerell AD, et al. J. Phys. Chem. B. 1998;102:3586. doi: 10.1021/jp973084f. [DOI] [PubMed] [Google Scholar]
- (22).Plimpton S. J. Comput. Phys. 1995;117:1. [Google Scholar]
- (23).Hockney RW, Eastwood JW. Computer simulation using particles. McGraw-Hill; New York: 1981. [Google Scholar]
- (24).Tannor DJ, Marten B, Murphy R, Friesner RA, Sitkoff D, Nicholls A, Ringnalda M, Goddard WA, Honig B. J. Am. Chem. Soc. 1994;116:11875. [Google Scholar]
- (25).Marten B, Kim K, Cortis C, Friesner RA, Murphy RB, Ringnalda MN, Sitkoff D, Honig B. J. Phys. Chem. 1996;100:11775. [Google Scholar]
- (26).Becke AD. J. Chem. Phys. 1993;98:5648. [Google Scholar]
- (27).Lee CT, Yang WT, Parr RG. Phys. Rev. B. 1988;37:785. doi: 10.1103/physrevb.37.785. [DOI] [PubMed] [Google Scholar]
- (28).Karagulian F, Lea AS, Dilbeck CW, Finlayson-Pitts BJ. Phys. Chem. Chem. Phys. 2008;10:528. doi: 10.1039/b712715d. [DOI] [PubMed] [Google Scholar]
- (29).Santrock J, Gorski RA, Ogara JF. Chem. Res. Toxicol. 1992;5:134. doi: 10.1021/tx00025a023. [DOI] [PubMed] [Google Scholar]
- (30).Rivera JL, Starr FW, Paricaud P, Cummings PT. J. Chem. Phys. 2006;125:8. doi: 10.1063/1.2345063. [DOI] [PubMed] [Google Scholar]
- (31).Ghosh A, Smits M, Bredenbeck J, Bonn M. J. Am. Chem. Soc. 2007;129:9608. doi: 10.1021/ja073130h. [DOI] [PubMed] [Google Scholar]
- (32).Lai CC, Yang SH, Finlayson-Pitts BJ. Langmuir. 1994;10:4637. [Google Scholar]
- (33).Pryor WA. Am. J. Clin. Nutr. 1991;53:702. doi: 10.1093/ajcn/53.3.702. [DOI] [PubMed] [Google Scholar]
- (34).Kaznessis YN, Kim ST, Larson RG. Biophys. J. 2002;82:1731. doi: 10.1016/S0006-3495(02)75525-2. [DOI] [PMC free article] [PubMed] [Google Scholar]
- (35).Kaznessis YN, Kim S, Larson RG. J. Mol. Biol. 2002;322:569. doi: 10.1016/s0022-2836(02)00774-x. [DOI] [PubMed] [Google Scholar]
- (36).Baoukina S, Monticelli L, Risselada HJ, Marrink SJ, Tieleman DP. Proc. Natl. Acad. Sci. U.S.A. 2008;105:10803. doi: 10.1073/pnas.0711563105. [DOI] [PMC free article] [PubMed] [Google Scholar]
- (37).Gilliard N, Heldt GP, Loredo J, Gasser H, Redl H, Merritt TA, Spragg RG. J. Clin. Invest. 1994;93:2608. doi: 10.1172/JCI117273. [DOI] [PMC free article] [PubMed] [Google Scholar]
- (38).Rodriguez-Capote K, Manzanares D, Haines T, Possmayer F. Biophys. J. 2006;90:2808. doi: 10.1529/biophysj.105.073106. [DOI] [PMC free article] [PubMed] [Google Scholar]
- (39).von Gunten U. Water Res. 2003;37:1443. doi: 10.1016/S0043-1354(02)00457-8. [DOI] [PubMed] [Google Scholar]
- (40).Pryor WA. Free Radic. Biol. Med. 1992;12:83. doi: 10.1016/0891-5849(92)90060-t. [DOI] [PubMed] [Google Scholar]
Associated Data
This section collects any data citations, data availability statements, or supplementary materials included in this article.


