Abstract
The neuroimmunological and behavioral consequences of a high-fat diet (HFD) are not well delineated. This is especially true when short term (24 h) fasting is used as a physiologic stressor. In this study, we examined the impact of a HFD on learning and memory and depressive-like behaviors to understand how fasting impacts neuroimmunity and if obesity modulates the response. Mice were fed diets containing either 10% (LFD mice) or 60% (HFD mice) calories from fat for 10-12 wks. Gene transcripts for 26 pro-/anti-inflammatory cytokines and markers of macrophage activation were examined in adipose tissue and whole brain. Mouse learning and memory (spontaneous alternation, novel object) and depressive like behaviors (saccharin preference, burrowing, forced swim) were studied in the fed and fasted state as were gene transcripts for F4/80, CD11b, IL-1alpha, IL-1beta, IL-1R1, IL-1R2, IL-1RA, IL-6 and TNF-alpha in cortex, hippocampus and hypothalamus. In the fed state, HFD mice compared to LFD mice had reduced locomotor activity, were adverse to saccharin and burrowed less. After fasting, LFD mice verse HFD mice lost 18% vs 5% of their body weight, respectively. In addition, HFD mice failed to down-regulate gene transcripts for the myeloid-cell associated proteins F4/80, CD11b and IL-1alpha in the brain, failed to appropriately explore a novel object, failed to reduce locomotor activity and had increased saccharin consumption and burrowing. These data indicate that fasting induces an anti-inflammatory effect on the neuroimmune system which a HFD prevents. This breakdown appears linked to the IL-1 system because of the association of this cytokine with memory and learning.
Keywords: obesity, high-fat diet, starvation, neuroimmunity, depressive like behaviors, learning, memory
Introduction
The ever increasing prevalence of obesity is a key human health concern (1) that epidemiologically impacts and modifies a wide array of clinical diseases and disorders. Increased intake of dietary fat appears to play a role in the human overweight/obese state (2) and has been modeled extensively in rodents using a diet-induced obesity approach via high-fat diets (HFDs) (3). A key phenomenon of HFD-induced obesity in rodents is the development of inflammation that is especially prevalent in white adipose tissue (4) and liver (5). In addition, serum markers of low-grade chronic inflammation are evident as indicated by elevations of acute-phase reactants like serum amyloid A (SAA). In mouse models of obesity, one of the strongest inflammation-dependent diseases is T2D causally linked to obesity through generation of insulin resistance (6). Both obesity and T2D are linked in humans to cognitive decline (7) and depression (8), but these associations are somewhat vague mechanistically and poorly defined in rodents models.
As we have recently reviewed, inflammation can mediate sickness symptoms, memory deficits and depression through the brain cytokine system, which can diffusely impact the neuronal circuits and neurotransmitters that organize physiologic and pathologic behavior (9). Therefore, a straightforward connection should exist between the obese state and adverse biobehaviors. Currently, however, there are no clearly articulated or agreed upon “behavioral complications” of obesity nor are the neuroimmunological or immunobehavioral consequences of a HFD defined in rodents. We have previously shown that the sickness symptom of social withdrawal is not impacted by a HFD (10). Here we sought to examine if a HFD impacted learning and memory (novel object recognition and spontaneous alternation) and/or depressive-like behaviors (saccharin preference, burrowing and forced swim). In addition, we wanted to determine if the physiologic stress of fasting modulated these behaviors.
Calorie restriction (CR) and alternate-day fasting (ADF) have been shown to induce weight loss in both humans and rodents (11). While such interventions are regularly used agriculturally and clinically in humans (12) little is known how they impact neuroimmunity especially in the overweight/obese state. Microbe- or microbial-derived bioactive-dependent activation of the neuroimmune system is a well-known suppressor of appetite (9). Furthermore, we have shown that obesity and T2D modify neuroimmunity in response to these aforementioned exogenous innate immune activators (13) (14) (10) especially within the IL-1 arm of the neuroimmune system (14). The impact of starvation on immunity appears detrimental. In starved bumblebee workers for instance, activation of the immune system with LPS significantly reduced survival (15) as did administering a lethal dose of LPS to mice (16). Thus, food and/or the fed state seems critical to immune system function and underscores the importance of examining how the overweight/obese state impacts the neuroimmune system in the native state and when fasting is used as a physiologic stressor.
Methods
Materials
All reagents and chemicals were purchased from Sigma-Aldrich except as noted. All primers were purchased from Applied Biosystems.
Animals
Animal use was conducted in accordance with Institutional Animal Care and Use Committee (IACUC) approved protocols at the University of Illinois. C57BL/6J male mice were purchased from Jackson Laboratories post weaning (3-wk old mice). Mice were group housed (4 × cage) in standard shoebox cages (length 28 cm; width 17 cm; height 12.5 cm) and allowed water and food ad libitum. Housing temperature (72°F) and humidity (45-55%) were controlled as was a 12/12 h reversed dark-light cycle (2000-0800 h). Video recording of animal behavior was performed under red light using a Night Shot capable video camera (Sony HDR-XR500V).
Diets, fasting, blood glucose and blood cytokines
Mice were fed open source uniform-base diets containing either 10% calories from fat (D12450B, Research Diets) or 60% calories from fat (D12492, Research Diets). Diets were administered to mice for 10-12 wks. When 24 h fasting was performed, mice to be fasted and control (fed) mice were transferred to a new cage and singularly housed. Fasted mice were provided water ad libitum. Mouse weight was recorded using an Adventurer Pro digital scale (Ohaus). Mouse tail blood glucose was recorded using a FreeStyle Freedom blood glucose monitor (Abbott) after the tail was cleaned with 70% ethanol and lanced with a sterile 18 gauge hypodermic needle (BD). Serum IL-1RA (MRA00), IL-1β (MLB00B) and leptin (MOB00) were measured by ELISA (R&D systems) as we have previously described (10)(17) from blood derived from the inferior vena cava after CO2 asphyxiation.
Quantitative PCR (qPCR)
RNA isolation from tissues was performed as we have described (18). Adipose tissue was harvested from the epididymal region. Where brain was used ,olfactory bulbs were excluded and the brain was perfused to eliminate contaminating blood. RNA was reverse transcribed using the High-Capacity cDNA Reverse Transcription Kit (PN 4368813) (Applied Biosystems). The TaqMan Gene Expression primers used were: arginase 1 (Mm01190441_g1), caspase 1 (Mm00438023_m1), MCP-1 (Mm99999056_m1), YM-1 (Mm00657889_mH), CXCL9 (Mm00434946_m1), F4/80 (Mm00802529_m1), IFNγ (Mm99999071_m1), IL-10 Mm99999062_m1), IL-12α (Mm00434169_m1), IL-13 (Mm99999190_m1), IL-18 (Mm00434226_m1), IL-1α (Mm99999060_m1), IL-1β (Mm99999061_mH), IL-1R1 (Mm00434237_m1), IL-1R2(Mm00439622_m1), IL-1RA (Mm01337566_m1), IL-33 (Mm00505403_m1), IL-4 (Mm00445259_m1) IL-5 (Mm99999063_m1), IL-6 (Mm01210733_m1), CD11b (Mm00434455_m1), CD11c (Mm00498698_m1), leptin (Mm00434759_m1), mannose receptor 1 (Mm01329362_m1), iNOS, (Mm01309897_m1), TGFβ, (Mm03024053_m1) and TNFα (Mm00443258_m1). qPCR was performed on a 7900 HT Fast Real-Time PCR System (Applied Biosystems) using TaqMan Universal PCR Master Mix (Applied Biosystems). To compare gene expression, a parallel amplification of endogenous β actin (Mm00607939_s1) was performed. Reactions with no reverse transcription and no template were included as negative controls. Relative quantitative evaluation of target gene to β actin was performed by comparing ΔCts, where Ct is the threshold concentration.
Alternation
Spontaneous alternation is a test of spatial memory where decreases and increases in perfect alternations reflect degraded or improved memory, respectively. Alternation utilized a symmetrical 3-arm, clear Plexiglas Y maze (arms = 40 cm in length × 9 cm in width × 16 cm wall height with an arm angle of 120°). Maze bottom was blue. Arm side walls were decorated with either: black triangles, black circles or black diagonal lines. To initiate testing, the subject mouse was randomly placed in one of the arms. Movement was recorded for 5 min and evaluated from the video record using EthoVision XT 7 (Noldus Information Technology). Mice were tested at the same time daily for 4 days. Day 1 testing was performed in the fed or fasted state. Day 2-4 testing was performed in the fed state. Results are presented as perfect alternations. Perfect alternations were defined as exploration of two novel arms sequentially prior to a return to the start arm independent of a right or left arm choice at initiation. To have entered an arm, the mouse was required to have all four legs in the arm. Testing occurred 2 h after the beginning of the dark cycle.
Novel object
Novel object recognition is a test of memory where decreases and increases in percent exploration of a novel versus a familiar object reflect degraded or improved memory, respectively. Training involved removing the subject mouse from its home cage and placing it for 5 min in a novel arena (home cage sized with light bedding) containing two identical objects placed 10 cm apart at the short-side wall end 5 cm from the short side wall and 6.5 cm from the long-side wall. Objects used were a smooth glass stone, a metal hexagonal nut and a metal S hook each of approximately similar size (4 cm in greatest dimension). Objects were assigned randomly. The subject mouse was returned to its home cage for 1 h then testing was initiated by returning the subject mouse to the arena where one of the identical objects (familiar object) was replaced (randomized to right or left) by an unfamiliar object (novel object). Exploratory behavior was video recorded for 5 min and evaluated from the video record using EthoVision XT 7 (Noldus Information Technology). Object exploration was defined as the mouse placing its nose within the software-defined zone surrounding the object. This zone was defined as 1 cm from the object edge. Percent investigation was calculated by dividing the time spent examining each object by the total time spent investigating both objects. Testing occurred 4 h after the beginning of the dark cycle.
Movement
Mice were examined in their home cage by video recording for 5 min. Movement was quantified using EthoVision XT 7 (Noldus Information Technology). Testing occurred 3 hr after the beginning of the dark cycle.
Saccharin preference
Saccharin preference testing is a test of depressive-like behavior where decreased interest in a sweet solution relative to water reflects anhedonia. Three days prior to saccharin preference testing, mice were singly housed in standard cages adapted for two bottle water access. At the beginning of the dark cycle, testing was initiated by replacing one of the waters (randomized to right verses left) with a 0.4% sodium saccharin solution (Sigma-Aldrich, CN 4-7839). Water and saccharin consumption were recorded after 24 h and was determined by weight of the bottle and fluid before and after testing.
Burrowing
Burrowing reflects depressive/anxiety-like behavior where decreased burrowing supports greater depression/anxiety. Burrows were constructed of 20.3 cm long ASTM D2665 polyvinyl chloride (PVC) pipe fitted at one end with an ASTM D2665 PVC pipe cap (closed end). The open end was raised 1.3 cm on twin steel legs. To acclimatize mice to the burrow, mice were singly housed in standard cages with burrow present for 24 h prior to testing. Testing was initiated 3 h prior to the dark cycle by transferring mice to a clean cage with thin bedding and by adding 200 g of food pellets to the burrow. Prior to replacing the burrow filled with food (burrow + food) back into the cage the burrow +food was weighed. The burrow was then placed horizontal to the cage long-side wall with the closed end against the cage short-side wall. Water was provided ad libitum but food was only available from the burrow. Mice were allowed to dig and or eat the food out of the burrow for 24 h. Amount burrowed was calculated by subtracting the burrow + food weight before and after the 24 h period of burrowing
Swim test
The forced swim test is a test of depressive-like behavior where increased immobility reflects loss of motivation. For the time points indicated, testing was initiated by individually transferring mice from their home cage to a clean novel white cylindrical PVC container (diameter 16 cm; height 31 cm) containing 15 cm of water maintained at 25 ± 1° C. Total swim duration was 6 min and immobility was evaluated from the video record using EthoVision XT 7 (Noldus Information Technology) encompassing the final 5 min of the swim. After testing, mice were allowed to dry in a warmed environment (28 ± 1° C) for 10 min then returned to their home cage. Testing occurred 2 hr after the beginning of the dark cycle.
Statistical analysis
Data analysis was conducted using Sigma Plot 11.2 (Systat Software). Data were subjected to either 1-way or 2-way ANOVA, depending on response variable, to determine the main effects of diet (LFD or HFD) and physiological state (fed or fasted) and the diet × physiological state interaction. A completely randomized design was used for all response variables. Mouse Y-maze data were collected over multiple days and were therefore subjected to a 2-way (diet × time) repeated measures ANOVA. Saccharin preference data were collected from 2 separate groups of mice and therefore, these data were analyzed as a 1-way ANOVA (main effect of diet). Cytokine mRNA abundance in cortex, hippocampus, and hypothalamus were analyzed separately using 2-way ANOVA (diet, physiological state). In all instances, post hoc means separation was performed using a Tukey adjustment. Statistical significance was assumed at p<0.05 and all data are presented as means ± SEM.
Results
HFD induces an up-regulation of pro-inflammatory cytokines and markers of alternative macrophage activation in adipose tissue but not in brain
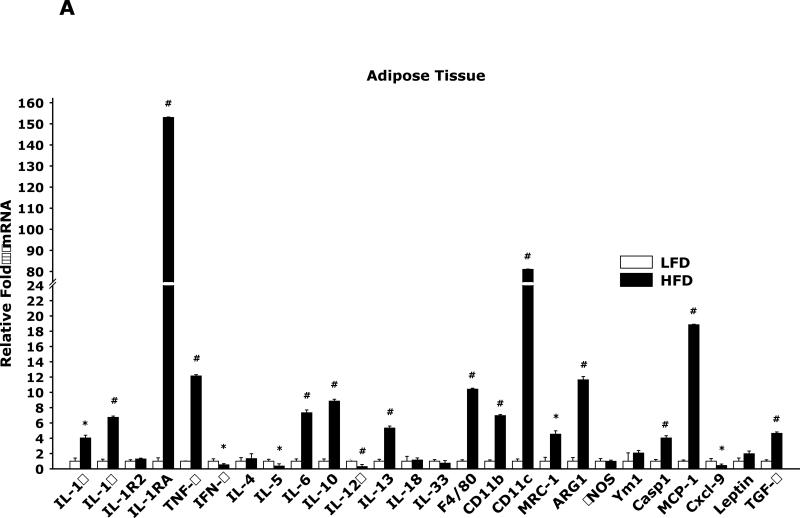
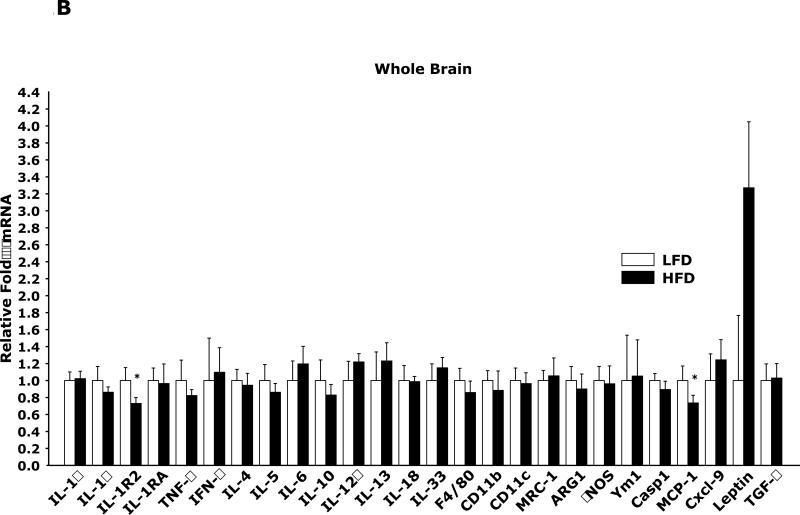
Fig. 1A in adipose tissue shows that HFD mice when compared to mice LFD mice have marked changes in mRNA expression of 26 pro-/anti-inflammatory cytokines and markers of macrophage activation. Fig. 1B demonstrates that brains from HFD mice when compared to LFD mice have very limited mRNA expression differences in the same 26 constituents examined in Fig. 1A.
Fig. 1. HFD induces an up-regulation of pro-inflammatory cytokines and markers of alternative macrophage activation in adipose tissue but not in brain.
Mice were fed either a low fat diet (LFD) or high fat diet (HFD) for 12 wks. A/B, qPCR was used to quantify mRNAs from the indicated tissues. Results are expressed as relative fold change in mRNA expression (ΔmRNA), means ± SEM; n= 8; *p<0.05, #p<0.001. (IL = interleukin, TNF = tumor necrosis factor, IFN = interferon, MRC-1 = mannose receptor 1, ARG1 = arginase 1, Casp1 = caspase 1, Cxcl-9 = chemokine (C-X-C motif) ligand 9, TGF = transforming growth factor))
Fasting reduces expression of brain F4/80 and CD11b which a HFD prevents
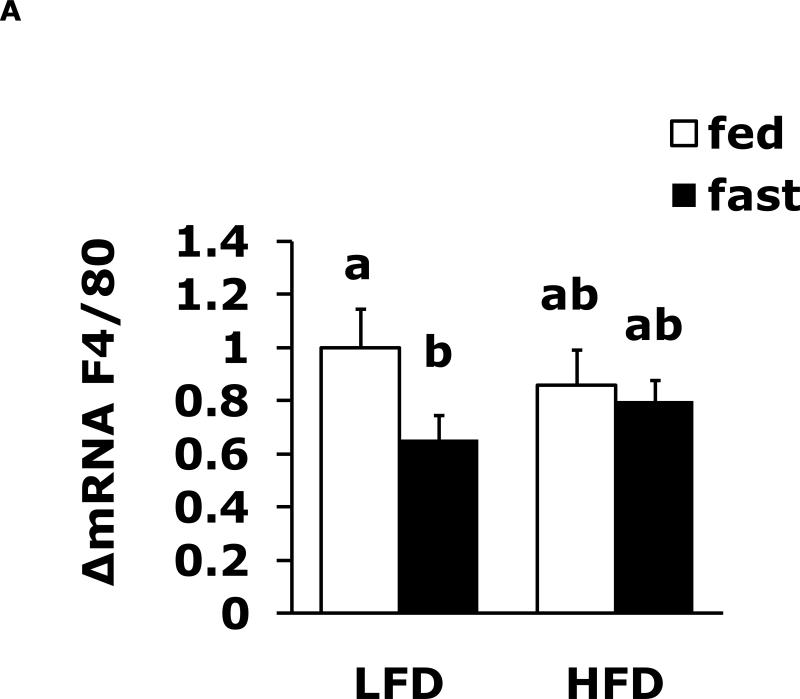
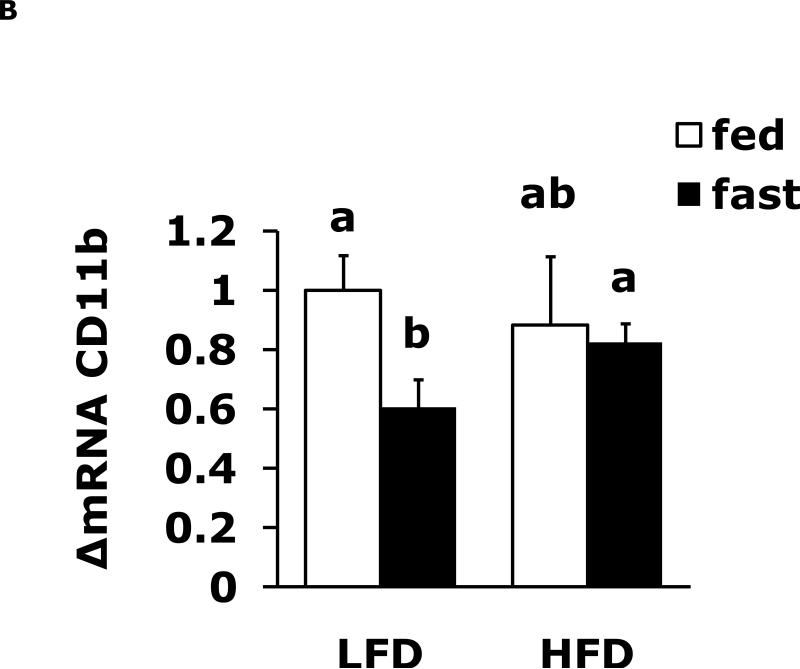
Table 1 shows body weight, Table 3 shows serum leptin and Table 4 shows serum IL-1RA for LFD and HFD mice in the fed and fasted state. Table 2 shows 12 h fasting blood glucose in LFD and HFD mice. Fig. 2A shows that a 24 h fast induces a 35% drop (1.0 ± 0.14 vs 0.65 ± 0.09) in F4/80 mRNA expression that was absent from HFD mice. Fig. 2B demonstrates that fasting reduced CD11b mRNA expression 39% (1.0 ± 0.12 vs 0.61 ± 0.09). In addition, fasted LFD mice had a 27% lower CD11b mRNA expression (0.61 ± 0.09 vs 0.83 ± 0.06) than fasted HFD mice.
Table 1.
Body weights (g) for mice fed HFD or LFD
| Fed | Fasted | |
|---|---|---|
| LFD | 30.8 ± 0.6 | 25.2 ± 0.3 |
| HFD | 49.7 ± 0.9 | 47.2 ± 0.8 |
Results are expressed as mean ± SEM, n=8 per group, Two-way ANOVA revealed main effects of diet (P<0.001) and state (P<0.001)
Table 3.
Serum leptin (ng/ml) for mice fed HFD or LFD
Results are expressed as mean ± SEM, n=8 per group, p<0.05 compared to LFD. Two-way ANOVA revealed a main effect of diet (P < 0.001)
Table 4.
Serum IL-1RA (ng/ml) for mice fed HFD or LFD
| Fed | Fasted | |
|---|---|---|
| LFD | 567 ± 17 | 701 ± 54 |
| HFD | 800 ± 82* | 796 ± 92 |
Results are expressed as mean ± SEM, n=8 per group, p<0.05 compared to LFD. Two-way ANOVA revealed a main effect of diet (P=0.016).
Table 2.
Blood glucose (mg/dl) for mice fed HFD or LFD
| Fed | Fasted | |
|---|---|---|
| LFD | 148 ± 5 | 70 ± 1 |
| HFD | 176 ± 7 | 121 ± 7 |
Results are expressed as mean ± SEM, n=8 per group, Two-way ANOVA revealed main effect of diet (P<0.001) and state (P<0.001), and diet × state interaction (P<0.001).
Fig. 2. Fasting reduces expression of brain F4/80 and CD11b which a HFD diet prevents.
Mice were fed either a low fat diet (LFD) or high fat diet (HFD) for 12 wks. Mice were then fed or fasted (fast) for 24 h. A, qPCR was used to quantify F4/80 mRNA from whole brain. Results are expressed as relative fold change in mRNA expression (ΔmRNA), means ± SEM; n= 8; main effect of state (p=0.003). B, qPCR was used to quantify CD11b mRNA from brain. Results are expressed as relative fold change in mRNA expression (ΔmRNA), means ± SEM; n= 8; main effect of state (p=0.004). Bars without a common superscript letter are different (p<0.05).
Fasting impairs memory but not depressive-like behaviors in HFD mice
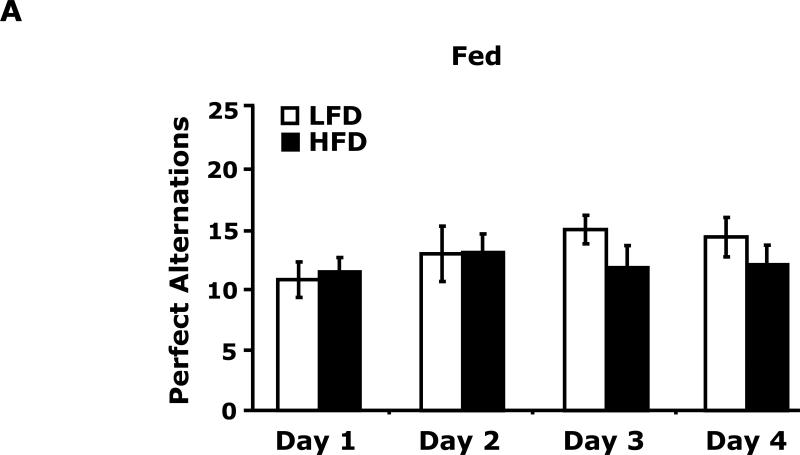
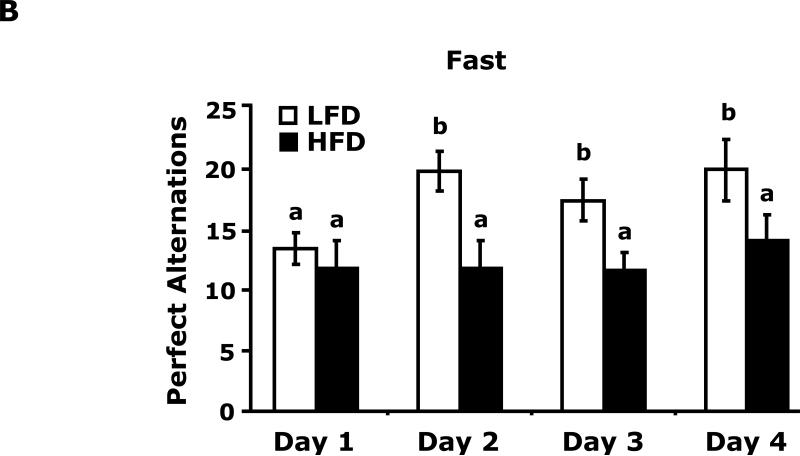
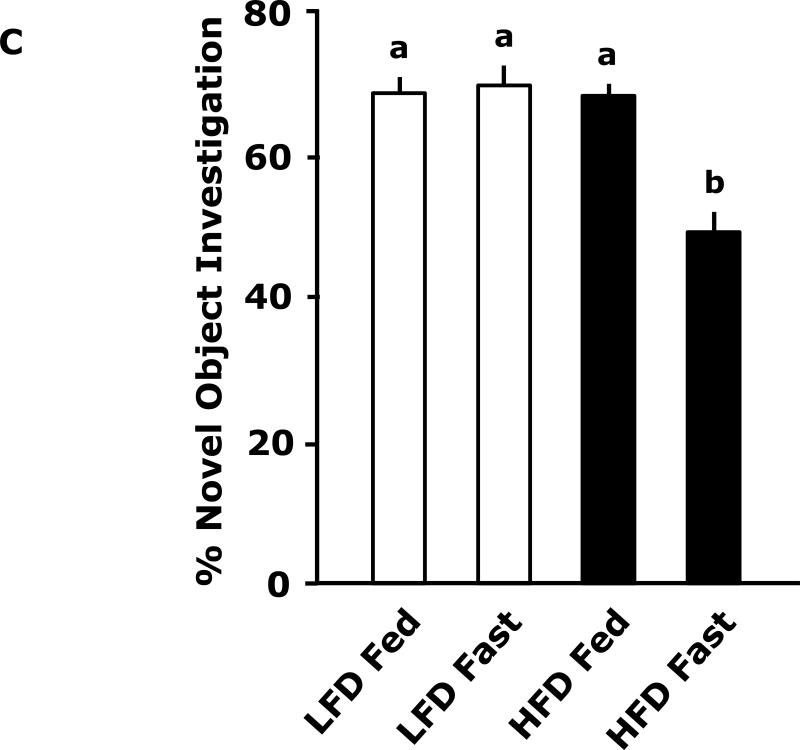
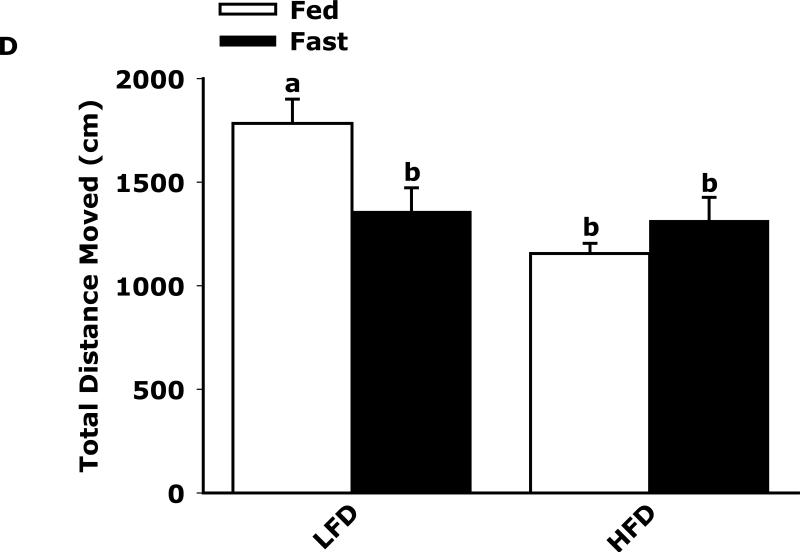
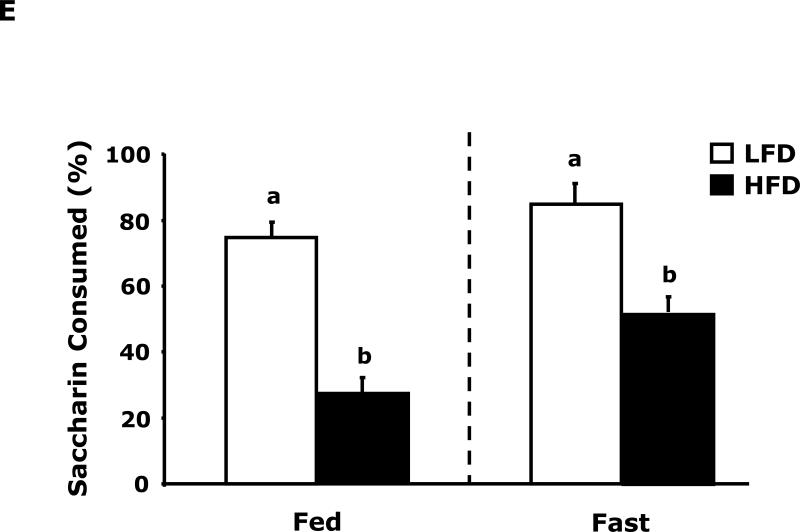
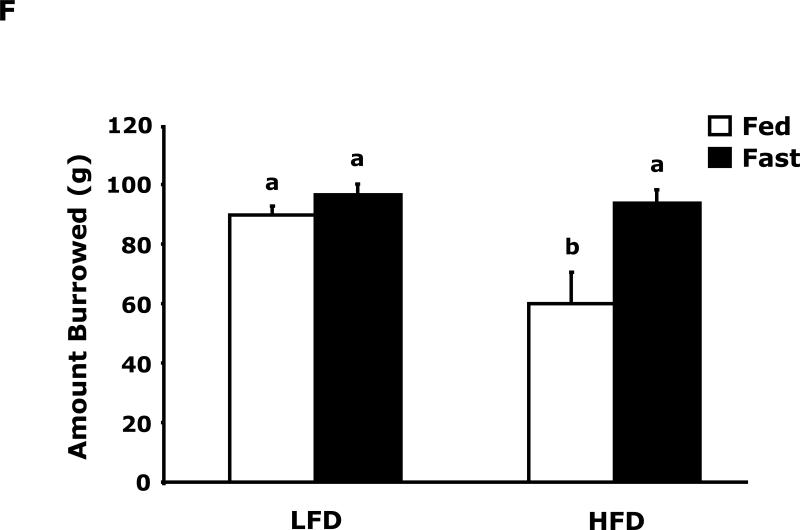
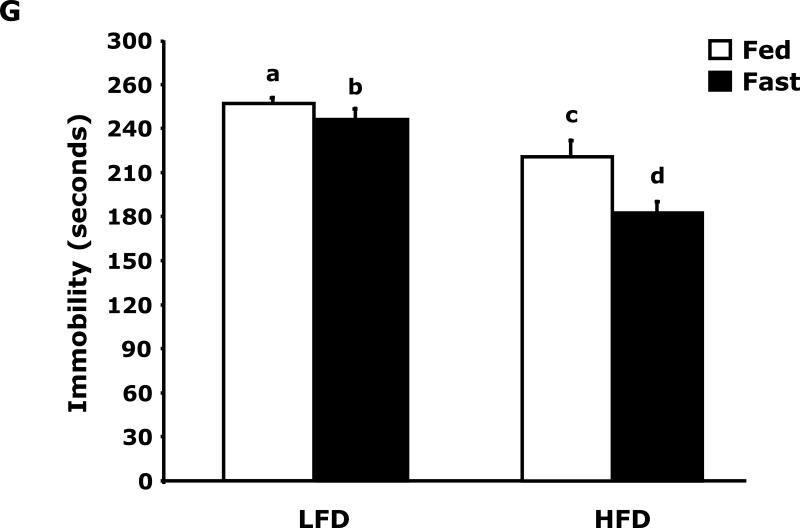
Fig. 3A shows that fed LFD and HFD mice have equivalent perfect alternations in a Y-maze over a 4 day trial (Day 1, 10.8 ± 1.5 vs 11.4 ± 1.2; Day 2, 12.9 ± 2.3 vs 13 ± 1.5; Day 3 14.9 ± 1.2 vs 11.8 ± 1.8; Day 4, 14.3 ± 1.6 vs 12.0 ± 1.6). In the fasted state (Fig. 3B), LFD mice verses HFD mice had significantly more perfect alterations after trial day 1 (Day 1, 13.5 ± 3.5 vs 11.9 ± 6.0; Day 2, 19.9 ± 1.6 vs 11.9 ± 2.2; Day 3 17.5 ± 1.7 vs 11.6 ± 1.6; Day 4, 20.0 ± 2.5 vs 14.1 ± 2.2). Fig. 3C shows that LFD mice in the fed or fasted state explore a novel object equivalently 68.26% vs 69.35% (68.26 ± 2.47 vs 69.35 ± 2.93). HFD mice in the fed and fasted state explore a novel differentially 68.35% vs 49.27% (68.35 ± 1.69 vs 49.27 ± 3.24). Overall time of exploration in seconds (not shown) was not different for LFD and HFD mice in the fed or fasted state (13.35 ± 1.38 vs 8.81 ± 1.57 vs 11.36 ± 1.03 vs 11.95 ± 1.48). Fig. 3D demonstrates that fasting reduced LFD mice locomotor activity by 24% (1783.49 ± 117.09 cm vs 1358.89 ± 113.54 cm). Fed HFD mice have 35% less locomotor activity than fed LFD mice (1783.49 ± 117.09 cm vs 1155.32 ± 49.20 cm). Fasting does not significantly impact HFD mice locomotor activity (1155.32 ± 49.20 cm vs 1314.62 ± 111.87 cm). Fig. 3E shows that HFD mice in the fed state have a reduced preference for saccharin when compared to LFD mice (74 ± 6% vs 27 ± 6%). In the fasted state this difference persists (84 ± 9% vs 51 ± 11%). Fig. 3F demonstrates that LFD mice in the fed or fasted state have equivalent burrowing (90 ± 3 g vs 96 ± 1 g). HFD mice in the fed state have reduced borrowing compared to LFD mice which increased after fasting (60 ± 10 vs 94 ± 5). Fig. 3G shows that LFD and HFD mice in the fed state are equivalently immobile in the swim test (256 ± 1 sec and 246 ± 2 sec, respectively). LFD and HFD mice in the fasted state have reduced immobility when compared to their controls (221 ± 3 vs 182 ± 2, respectively).
Fig. 3. Fasting impairs memory but not depressive-like behaviors in HFD mice.
Mice were fed either a low fat diet (LFD) or high fat diet (HFD) for 12 wks. Mice were then fed or fasted (fast) for 24 h. A/B, Y-maze. Results are expressed as the number of perfect alternation s, means ± SEM; n = 8; main effect of diet (p=0.01). C, Novel object exploration. Results are expressed as % investigation of a novel object, means ± SEM; n=8; main effects of diet (p<0.001) and state (p=0.002), diet × state interaction (p<0.001). D, Locomotor activity 1 h before novel object testing. Results are expressed as centimeters of movement, means ± SEM; =16; main effect of diet (p=0.004), diet × state interaction (p=0.006). E, Saccharin preference. Results are expressed as saccharin consumed as proportion (%) of total fluid disappearance; data analyzed as 1-way ANOVA; means ± SEM; n=6, main effects of diet (p<0.05); F, Burrowing. Results are expressed as grams of material burrowed, means ± SEM; n=6; main effects of diet (p=0.002) and state (p<0.001), diet × state interaction (p=0.006). G, Swim test. Results are expressed as minutes of time not swimming (Immobility), means ± SEM; n=8; main effect of state (p<0.001). Bars without a common superscript letter are different (p<0.05).
Fasting in LFD and HFD mice impacts pro-inflammatory cytokine expression differently in cerebral cortex, hippocampus and hypothalamus
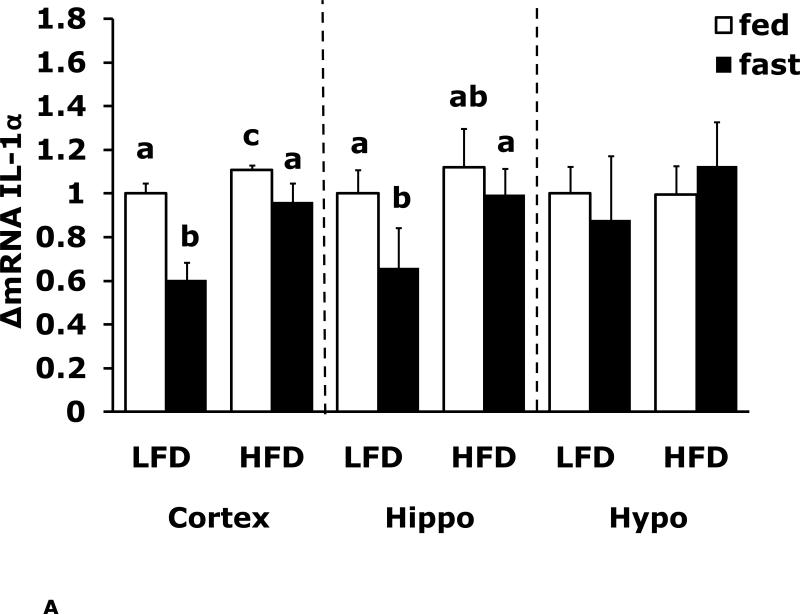
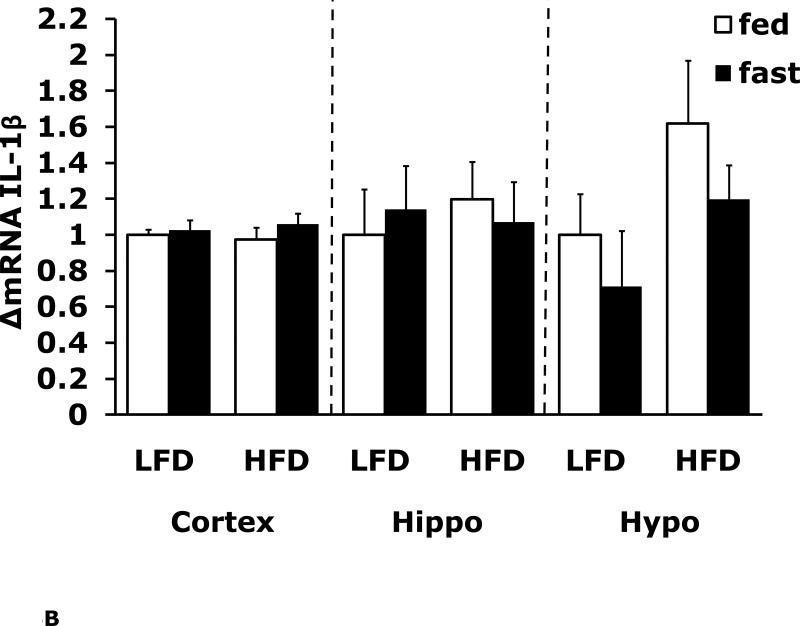
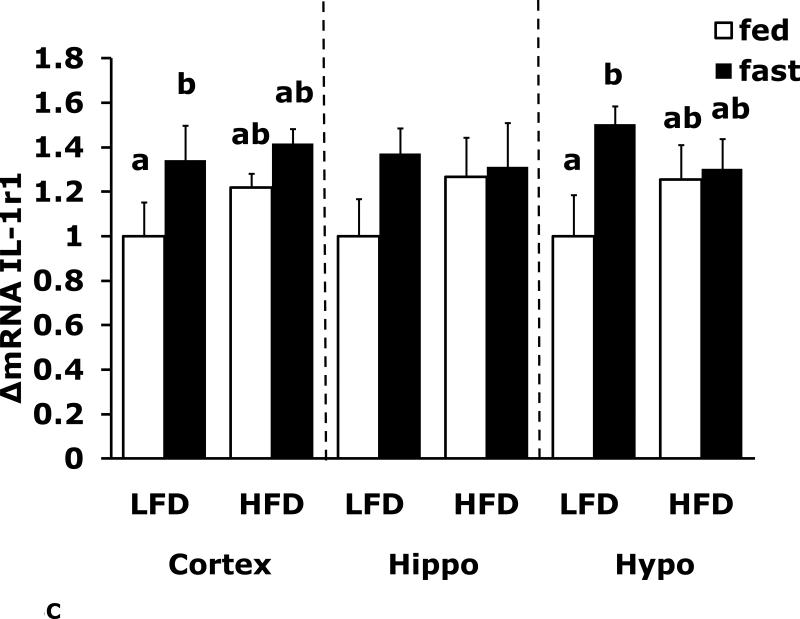
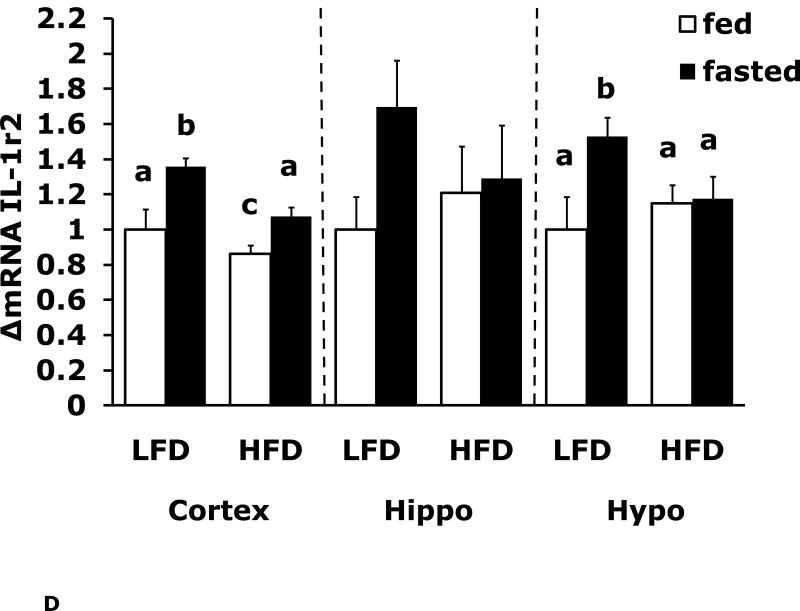
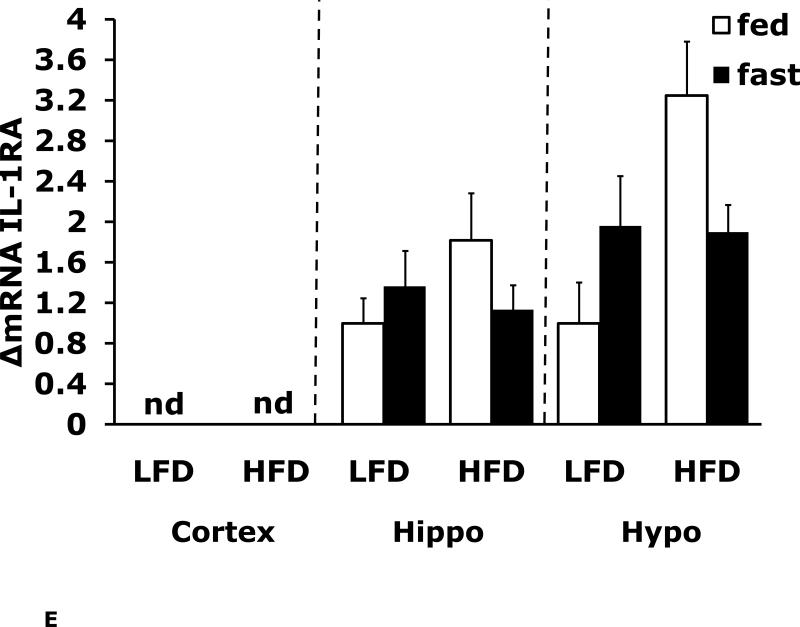
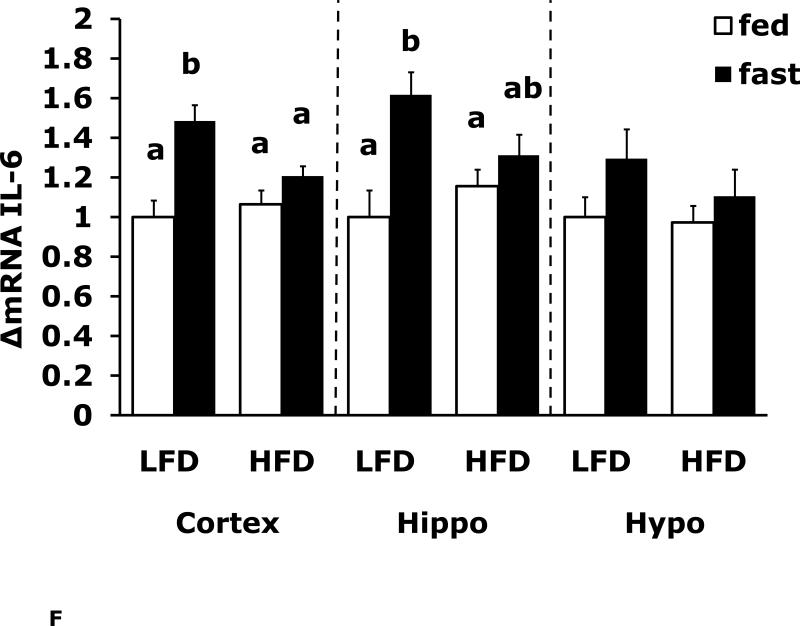
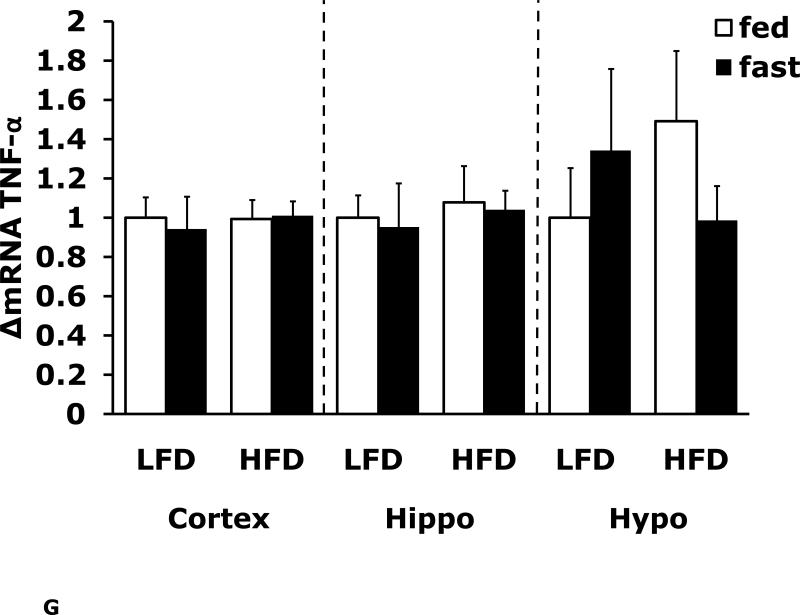
Figs. 4A-G show that LFD mice when compared to HFD mice have differential mRNA expression of IL-1α, IL-1R1, IL-1R2 and IL-6 that is dependent on brain region and/or fed/fasted state. IL-1β, IL-1RA and TNF-α mRNA were expressed at similar levels irrespective of diet, brain region and/or fed/fasted state.
Fig. 4. Fasting in LFD and HFD mice impacts pro-inflammatory cytokine expression differently in cerebral cortex, hippocampus and hypothalamus.
Mice were fed either a low fat diet (LFD) or high fat diet (HFD) for 12 wks. A-G, qPCR was used to quantify mRNAs from the indicated brain regions in the fed and fasted (fast) state. Results are expressed as relative fold change in mRNA expression (ΔmRNA), means ± SEM; n=8. A, cortex: main effects of diet (p<0.001) and state (p<0.001), diet × state interaction (p<0.001). C, cortex: main effect of state (p=0.03). Hypo: main effect of state (p=0.04). D, cortex: main effects of diet (p=0.002) and state (p<0.001). F, cortex: main effect of state (p<0.001), diet × state interaction (p=0.03). Hippo: main effect of state (p<0.001), diet × state interaction (p=0.037). Bars without a common superscript letter are different (p<0.05).
Discussion
The overweight/obese state is characterized by chronic inflammation that is most evident in adipose tissue (19). A wide range of immune regulators have altered gene expression in epididymal adipose tissue from HFD mice compared to LFD mice (Fig. 1A). The classic pro-inflammatory cytokines IL-1α, IL-1β, IL-6 and TNFα were up-regulated as was caspase-1 which is required for the processing of pro-IL-1β into functional (secretable) IL-1β. The pro-inflammatory cytokines along with iNOS are generally associated with classical activated macrophages (M1) and Th1 polarization. Interestingly, the key Th1 cytokine IFN-y was down regulated as was IL-12α which is required for T cell independent generation of IFN-γ. This down-regulation of IFN-γ was coupled to a down-regulation of Cxcl-9 which is an IFN-γ-inducible T cell chemoattractant. Additionally, the IL-1 superfamily members IL-18 and IL-33 were unaffected by a HFD. In contrast, the key Th2 cytokine, IL-13, was up-regulated suggesting Th2 polarization. Fujisak et al. recently demonstrated an increase in the number of alternatively activated (M2) macrophages but a an overall decrease in the M2/ M1 macrophage ratio in epididymal adipose tissue from HFD mice (20). Fig. 1A supports these findings in several ways. Indicative of increased macrophage number was significant up-regulation of the macrophage markers F4/80 and CD11b in addition to up-regulation of the macrophage chemoattractant MCP1. CD11c (usually associated with dendritic cells) was also markedly augmented consistent with the known increased presence in what are thought to be non-inflammatory M1-like macrophages that appear tied to insulin resistance (21)(22). M2 macrophage markers were up-regulated including the mannose receptor 1, arginase 1 and TGF-β which was consistent with increased IL-13, a prime driver of the M2 phenotype. The other classic M2 driver IL-4 was not impacted by an HFD while another key Th2 cytokine IL-5 was down-regulated. Finally, expression of IL-10 was increased which coincides with deactivated macrophages which elaborate IL-10 and have reduced IL-12 production.
In support of a peripheral polarization toward anti-inflammation was the 150-fold up-regulation of IL-1RA mRNA in adipose tissue which was reflected by the presence of a 41% increase in serum IL-1RA in HFD mice compared to LFD mice (Table 4). In contrast, no dramatic changes in inflammatory markers were seen in the brain (Fig. 1B). This was not entirely surprising in that the neuroimmune system appears relatively resistant to activation, generally, requiring strong triggers like microbial agonists, hypoxia/ischemia and trauma to induce robust whole brain effects. This resistance of microglia to activation also appears to guard against brain-based against immune skewing such as Th1/Th2 and/or M1/M2 polarization. Neurobehaviorally, a HFD-dependent up-regulation of serum IL-1RA is important because it protects mice from acute-hypoxia induced sickness symptoms, as we have shown (10)(17). Such findings support the existence of the “obesity paradox” in which patients with congestive heart failure, coronary artery disease, hypertension and stroke appear to have a survival advantage over their normal weight counterparts (23). Therefore, most obesity-based brain immune work tends to focus on the impact of metabolism and metabolism-associated bioactives as they relate to hypothalamic function and body energy needs (24) because, immunobehavioral, obesity may offer some protection from sickness symptoms.
Leptin is a significant driver of IL-1RA expression (25)(17) and HFD mice have a 5.4-fold elevation in serum leptin (Table 3). Recently IL-1 was shown to be important to hippocampal dependent memory (26)(27) and factors that impact brain IL-1 signaling balance disrupt hippocampal dependent memory (27). As reviewed by Goshen and Yirmiya, hippocampal-dependent memory and plasticity regulated by IL-1 signaling is an inverted U shaped curve where low brain IL-1 signaling and high brain IL-1 signaling have similar impacts. Overall, the IL-1 system has several layers of complexity that make it difficult to predict from a single constituent what the overall signaling state will be (28). IL-1α and IL-1β both drive similar intracellular responses through the IL-1R1 receptor but the IL-1R2 or “decoy” receptor has a similar affinity for both IL-1α and IL-1β while lacking an intracellular signal transduction domain. In addition, IL-1R2 is present in both a cell membrane bound and soluble form. IL-1RA, on the other hand, acts as a competitive antagonist to both IL-1α and IL-1β and is a non-membrane bound bioactive that crosses the blood-brain barrier (29). Since serum IL-1RA is elevated in HFD mice, we examined novel object recognition which is a learning/memory test that is in large part dependent on hippocampal supra and intra/infrapyramidal mossy fibers (30) (31). Our rational for examining memory was that significant serum IL-1RA up-regulation would likely impact brain-based IL-1 signaling. In addition, the fasted state has been shown to lower leptin (16). Therefore, we sought to use a 24 h fast to reduce serum leptin and thus, potentially, serum IL-1RA. A reduction in serum IL-1RA would then leave less IL-1RA available to cross the blood-brain barrier. While fasting significantly reduced body weight and blood glucose in fed and fasted LFD and HFD mice, it had no statistically significant impact on leptin or IL-1RA. This may have been why Faggioni et al used a 48 h fast (16) when they examined the consequence of food withdrawal on C57BL/6 mice. The result of fasting on rodent IL-1RA does not appear to have been previously reported.
Surprisingly, in the fed state, HFD mice had similar Y-maze (Fig. 3A) and novel object (Fig. 3C) performance as LFD mice. Very recent work by Pistell et al in mice (32) showed that HFD mice fed the identical diet used in this study have problems with cognition. Although to demonstrate such changes Pistell et al used much older mice (37 wk-old) on an HFD for 16 wks. In addition, their cognitive test (five-segmented, Stone T maze) utilized a strong motivator, water, to encourage the animal to move through the maze. Given the markedly different buoyancy of lean and obese animals, it is difficult to determine how the test was impacted by obesity even though the mice used could still touch the maze floor. Additionally, locomotor activity was not reported by Pistell et al which we found was reduced by 35% in fed HFD mice compared to LFD mice. This is an important confounder which makes movement based testing somewhat difficult to assess when comparing LFD and HFD mice. In the fasted state, however, locomotor activity equalized between LFD and HFD mice. This change was also associated with a failure of HFD mice to favor a novel object and heighted perfect alternations in LFD mice. The likely reason that HFD mice did not increase their perfect alternations after day 1 was that their first exposure to the maze was during fasting which as the novel object test shows retards learning in HFD mice. Fasting possibly aided LFD mice in learning due to the known memory enhancing effect of ghrelin and its up-regulation during fasting which is blunted by obesity (33).
The depressive-like behavior of loss of saccharin preference was evident in HFD mice compared to LFD mice (Fig. 3E). In fact, in the fed state HFD mice were adverse to saccharin with a preference below 50%. While these results would suggest that HFD mice are anhedonic, the results need to be interpreted with caution due to the known sweet taste regulating effect of leptin in mice (34). With a 5-fold increase in serum leptin (Table 3), it was not surprising that HFD mice had a reduction in saccharin preference, although the effect was greater than would be predicted from work performed in leptin and/or leptin receptor deficient mice (34) (35). Unexpectedly, fasting appeared to change HFD mouse saccharin preference from aversion to indifference without changing serum leptin levels, this finding indicates that more than serum leptin levels may be involved in mouse saccharin preference in the overweight/obese state. Further evidence that HFD mice are not in a profound depressive-like state was the equivalent immobility seen in the swim test (Fig. 3G). Fasting did not reveal a differential response between LFD and HFD mice but it did reduce immobility implicating it has a short-term anti-depressant effect in both LFD and HFD mice. Finally, burrowing (Fig. 3F) supports the finding that fasting normalized depressive-like behavior in HFD mice. Burrowing is a ubiquitous rodent behavior (36) that is very sensitive to neuroimmune activation (37). Changes in burrowing appear to be dependent on serotonin because it was just shown that in 5-HT transporter (5-HTT) knockout and 5-HTT over expressing mice burrowing behavior follows expected increases in brain serotonin levels (38). We found that fed HFD mice had reduced burrowing compared to fed LFD mice and that fasting corrected this deficiency.
We and others have reviewed how pro-/anti-inflammatory cytokine balance in the brain can impact memory and depressive like behaviors (39) (27). While brains from fed HFD mice (when compared to LFD mice) had minimal changes in markers of the neuroimmune system (Fig. 1A vs Fig. 1B), fasting elicited a variety of differences. In LFD mice whole brain, fasting induced a 40% drop in F4/80 and CD11b gene expression which was not recapitulated in HFD mice. Since microglia are relatively long lived bone marrow-derived cells that appear to enter the brain during fetal development (40), the observed drop in F4/80 and CD11b was not apt to be due to loss of microglia from the brain. More probably it represents a reduction in message production of two abundantly expressed myeloid cell-associated proteins and may indicate that these proteins, are targeted for autophagy during fasting-dependent nutrient deprivation (41).
To more specifically examine the impact of fasting on pro-inflammatory gene expression we examined brain regions of fed and fasted LFD and HFD mice (Fig. 4A-G). IL-1α was the pro-inflammatory cytokine most impacted by fasting showing a near 40% reduction in LFD mice cortex and hippocampus. As with F4/80 and CD11b, down-regulation of IL-1α message was absent from fasted HFD mice. In contrast, cortex and hippocampal IL-6 gene expression was up-regulated by fasting in LFD mice and this effect was absent from HFD mice. IL-1R1 and IL-1R2 were up-regulated by fasting in cortex and hypothalamus in fed LFD mice. In addition, IL-1R2 was the only gene transcript measured to be up-regulated in any region by fasting in HFD mice. Taken together, a HFD prevented fasting-dependent down-regulation of IL-1α and up-regulation of IL-6 in the hippocampus. These results indicate that the learning/memory (ie. hippocampal)-associated tasks of alternation and novel object recognition may be linked to these two cytokines because fasted HFD mice had reduced alternation behavior and novel object exploration compared to fasted LFD mice. More work is needed to conclusively link the cytokine gene expression changes observed to the behaviors noted. To date, this work is the most comprehensive examination of behaviors impacted by a HFD especially when an exogenous activator of the innate immune system is not used. Overall, the fasting period utilized appears to be anti-inflammatory resulting in down-regulation of F4/80, CD11b and IL-1α and up-regulation of IL-6 and IL-1R2. HFD mice may be resistant to the effects of fasting due to their sizable energy stores and peripheral pro-inflammatory state.
Acknowledgments
Support: This research was supported by the National Institutes of Health (DK064862, NS058525 and AA019357 to G.G.F.), USDA National Institute of Food and Agriculture, Hatch project number #ILLU-971-32, and by the National Institutes of Health under Ruth L. Kirschstein National Research Service Award (DK59802) to the Division of Nutritional Sciences (Predoctoral Fellowship to D.N.L)
References
- 1.Centers for Disease Control and Prevention Overweight and Obesity. 2010;2010:1. [Google Scholar]
- 2.Melanson EL, Astrup A, Donahoo WT. The relationship between dietary fat and fatty acid intake and body weight, diabetes, and the metabolic syndrome. Ann Nutr Metab. 2009;55:229–243. doi: 10.1159/000229004. [DOI] [PubMed] [Google Scholar]
- 3.Schattenberg JM, Galle PR. Animal models of non-alcoholic steatohepatitis: of mice and man. Dig Dis. 2010;28:247–254. doi: 10.1159/000282097. [DOI] [PubMed] [Google Scholar]
- 4.Olefsky JM, Glass CK. Macrophages, inflammation, and insulin resistance. Annu Rev Physiol. 2010;72:219–246. doi: 10.1146/annurev-physiol-021909-135846. [DOI] [PubMed] [Google Scholar]
- 5.Brunt EM. Pathology of nonalcoholic fatty liver disease. Nat Rev Gastroenterol Hepatol. 2010;7:195–203. doi: 10.1038/nrgastro.2010.21. [DOI] [PubMed] [Google Scholar]
- 6.Hotamisligil GS. Inflammation and metabolic disorders. Nature. 2006;444:860–867. doi: 10.1038/nature05485. [DOI] [PubMed] [Google Scholar]
- 7.Naderali EK, Ratcliffe SH, Dale MC. Obesity and Alzheimer's disease: a link between body weight and cognitive function in old age. Am J Alzheimers Dis Other Demen. 2009;24:445–449. doi: 10.1177/1533317509348208. [DOI] [PMC free article] [PubMed] [Google Scholar]
- 8.Pouwer F, Geelhoed-Duijvestijn PH, Tack CJ, et al. Prevalence of comorbid depression is high in out-patients with Type 1 or Type 2 diabetes mellitus. Results from three out-patient clinics in the Netherlands. Diabet Med. 2010;27:217–224. doi: 10.1111/j.1464-5491.2009.02903.x. [DOI] [PubMed] [Google Scholar]
- 9.Dantzer R, O'Connor JC, Freund GG, et al. From inflammation to sickness and depression: when the immune system subjugates the brain. Nat Rev Neurosci. 2008;9:46–56. doi: 10.1038/nrn2297. [DOI] [PMC free article] [PubMed] [Google Scholar]
- 10.Sherry CL, Kim SS, Freund GG. Accelerated recovery from acute hypoxia in obese mice is due to obesity-associated up-regulation of interleukin-1 receptor antagonist (IL-1RA). Endocrinology. 2009 doi: 10.1210/en.2008-1622. [DOI] [PMC free article] [PubMed] [Google Scholar]
- 11.Varady KA, Hellerstein MK. Do calorie restriction or alternate-day fasting regimens modulate adipose tissue physiology in a way that reduces chronic disease risk? Nutr Rev. 2008;66:333–342. doi: 10.1111/j.1753-4887.2008.00041.x. [DOI] [PubMed] [Google Scholar]
- 12.McCue MD. Starvation physiology: reviewing the different strategies animals use to survive a common challenge. Comp Biochem Physiol A Mol Integr Physiol. 2010;156:1–18. doi: 10.1016/j.cbpa.2010.01.002. [DOI] [PubMed] [Google Scholar]
- 13.O'Connor JC, Satpathy A, Hartman ME, et al. IL-1beta-mediated innate immunity is amplified in the db/db mouse model of type 2 diabetes. J Immunol. 2005;174:4991–4997. doi: 10.4049/jimmunol.174.8.4991. [DOI] [PubMed] [Google Scholar]
- 14.Johnson DR, O'Connor JC, Hartman ME, et al. Acute hypoxia activates the neuroimmune system, which diabetes exacerbates. J Neurosci. 2007;27:1161–1166. doi: 10.1523/JNEUROSCI.4560-06.2007. [DOI] [PMC free article] [PubMed] [Google Scholar]
- 15.Moret Y, Schmid-Hempel P. Survival for immunity: the price of immune system activation for bumblebee workers. Science. 2000;290:1166–1168. doi: 10.1126/science.290.5494.1166. [DOI] [PubMed] [Google Scholar]
- 16.Faggioni R, Moser A, Feingold KR, et al. Reduced leptin levels in starvation increase susceptibility to endotoxic shock. Am J Pathol. 2000;156:1781–1787. doi: 10.1016/S0002-9440(10)65049-3. [DOI] [PMC free article] [PubMed] [Google Scholar]
- 17.Sherry CL, Kramer JM, York JM, et al. Behavioral recovery from acute hypoxia is reliant on leptin. Brain Behav Immun. 2009;23:169–175. doi: 10.1016/j.bbi.2008.09.011. [DOI] [PMC free article] [PubMed] [Google Scholar]
- 18.Sherry CL, Kim SS, Dilger RN, et al. Sickness behavior induced by endotoxin can be mitigated by the dietary soluble fiber, pectin, through up-regulation of IL-4 and Th2 polarization. Brain Behav Immun. 2010;24:631–640. doi: 10.1016/j.bbi.2010.01.015. [DOI] [PMC free article] [PubMed] [Google Scholar]
- 19.Yang L, Hotamisligil GS. Stressing the brain, fattening the body. Cell. 2008;135:20–22. doi: 10.1016/j.cell.2008.09.030. [DOI] [PubMed] [Google Scholar]
- 20.Fujisaka S, Usui I, Bukhari A, et al. Regulatory mechanisms for adipose tissue M1 and M2 macrophages in diet-induced obese mice. Diabetes. 2009;58:2574–2582. doi: 10.2337/db08-1475. [DOI] [PMC free article] [PubMed] [Google Scholar]
- 21.Shaul ME, Bennett G, Strissel KJ, et al. Dynamic, M2-like remodeling phenotypes of CD11c+ adipose tissue macrophages during high-fat diet--induced obesity in mice. Diabetes. 2010;59:1171–1181. doi: 10.2337/db09-1402. [DOI] [PMC free article] [PubMed] [Google Scholar]
- 22.Li P, Lu M, Nguyen MT, et al. Functional heterogeneity of CD11c-positive adipose tissue macrophages in diet-induced obese mice. J Biol Chem. 2010;285:15333–15345. doi: 10.1074/jbc.M110.100263. [DOI] [PMC free article] [PubMed] [Google Scholar]
- 23.Lavie CJ, Milani RV, Ventura HO. Obesity and cardiovascular disease: risk factor, paradox, and impact of weight loss. J Am Coll Cardiol. 2009;53:1925–1932. doi: 10.1016/j.jacc.2008.12.068. [DOI] [PubMed] [Google Scholar]
- 24.Das UN. Obesity: genes, brain, gut, and environment. Nutrition. 2010;26:459–473. doi: 10.1016/j.nut.2009.09.020. [DOI] [PubMed] [Google Scholar]
- 25.Gabay C, Dreyer M, Pellegrinelli N, et al. Leptin directly induces the secretion of interleukin 1 receptor antagonist in human monocytes. J Clin Endocrinol Metab. 2001;86:783–791. doi: 10.1210/jcem.86.2.7245. [DOI] [PubMed] [Google Scholar]
- 26.Rachal Pugh C, Fleshner M, Watkins LR, et al. The immune system and memory consolidation: a role for the cytokine IL-1beta. Neurosci Biobehav Rev. 2001;25:29–41. doi: 10.1016/s0149-7634(00)00048-8. [DOI] [PubMed] [Google Scholar]
- 27.Goshen I, Yirmiya R. Interleukin-1 (IL-1): a central regulator of stress responses. Front Neuroendocrinol. 2009;30:30–45. doi: 10.1016/j.yfrne.2008.10.001. [DOI] [PubMed] [Google Scholar]
- 28.Rock KL, Latz E, Ontiveros F, et al. The sterile inflammatory response. Annu Rev Immunol. 2010;28:321–342. doi: 10.1146/annurev-immunol-030409-101311. [DOI] [PMC free article] [PubMed] [Google Scholar]
- 29.Galea J, Ogungbenro K, Hulme S, et al. Intravenous anakinra can achieve experimentally effective concentrations in the central nervous system within a therapeutic time window: results of a dose-ranging study. J Cereb Blood Flow Metab. 2010 doi: 10.1038/jcbfm.2010.103. [DOI] [PMC free article] [PubMed] [Google Scholar]
- 30.Crusio WE, Schwegler H, van Abeelen JH. Behavioral responses to novelty and structural variation of the hippocampus in mice. II. Multivariate genetic analysis. Behav Brain Res. 1989;32:81–88. doi: 10.1016/s0166-4328(89)80075-0. [DOI] [PubMed] [Google Scholar]
- 31.Belzung C. Hippocampal mossy fibres: implication in novelty reactions or in anxiety behaviours? Behav Brain Res. 1992;51:149–155. doi: 10.1016/s0166-4328(05)80208-6. [DOI] [PubMed] [Google Scholar]
- 32.Pistell PJ, Morrison CD, Gupta S, et al. Cognitive impairment following high fat diet consumption is associated with brain inflammation. J Neuroimmunol. 2010;219:25–32. doi: 10.1016/j.jneuroim.2009.11.010. [DOI] [PMC free article] [PubMed] [Google Scholar]
- 33.Lim CT, Kola B, Korbonits M, et al. Ghrelin's role as a major regulator of appetite and its other functions in neuroendocrinology. Prog Brain Res. 2010;182:189–205. doi: 10.1016/S0079-6123(10)82008-4. [DOI] [PubMed] [Google Scholar]
- 34.Kawai K, Sugimoto K, Nakashima K, et al. Leptin as a modulator of sweet taste sensitivities in mice. Proc Natl Acad Sci U S A. 2000;97:11044–11049. doi: 10.1073/pnas.190066697. [DOI] [PMC free article] [PubMed] [Google Scholar]
- 35.Shigemura N, Ohta R, Kusakabe Y, et al. Leptin modulates behavioral responses to sweet substances by influencing peripheral taste structures. Endocrinology. 2004;145:839–847. doi: 10.1210/en.2003-0602. [DOI] [PubMed] [Google Scholar]
- 36.Deacon RM. Burrowing in rodents: a sensitive method for detecting behavioral dysfunction. Nat Protoc. 2006;1:118–121. doi: 10.1038/nprot.2006.19. [DOI] [PubMed] [Google Scholar]
- 37.Deacon RM. Burrowing: a sensitive behavioural assay, tested in five species of laboratory rodents. Behav Brain Res. 2009;200:128–133. doi: 10.1016/j.bbr.2009.01.007. [DOI] [PubMed] [Google Scholar]
- 38.Line SJ, Barkus C, Coyle C, et al. Opposing alterations in anxiety and species-typical behaviours in serotonin transporter overexpressor and knockout mice. Eur Neuropsychopharmacol. 2010 doi: 10.1016/j.euroneuro.2010.08.005. [DOI] [PMC free article] [PubMed] [Google Scholar]
- 39.Dantzer R, O'Connor JC, Freund GG, et al. From inflammation to sickness and depression: when the immune system subjugates the brain. Nat Rev Neurosci. 2008;9:46–56. doi: 10.1038/nrn2297. [DOI] [PMC free article] [PubMed] [Google Scholar]
- 40.Kim SU, de Vellis J. Microglia in health and disease. J Neurosci Res. 2005;81:302–313. doi: 10.1002/jnr.20562. [DOI] [PubMed] [Google Scholar]
- 41.Jung CH, Ro SH, Cao J, et al. mTOR regulation of autophagy. FEBS Lett. 2010;584:1287–1295. doi: 10.1016/j.febslet.2010.01.017. [DOI] [PMC free article] [PubMed] [Google Scholar]


