

Abstract
The authors evaluated whether there is an excess of statistically significant results in studies of genetic associations with Alzheimer's disease reflecting either between-study heterogeneity or bias. Among published articles on genetic associations entered into the comprehensive AlzGene database (www.alzgene.org) through January 31, 2007, 1,348 studies included in 175 meta-analyses with 3 or more studies each were analyzed. The number of observed studies (O) with statistically significant results (P = 0.05 threshold) was compared with the expected number (E) under different assumptions for the magnitude of the effect size. In the main analysis, the plausible effect size of each association was the summary effect presented in the respective meta-analysis. Overall, 19 meta-analyses (all with eventually nonsignificant summary effects) had a documented excess of O over E: Typically single studies had significant effects pointing in opposite directions and early summary effects were dissipated over time. Across the whole domain, O was 235 (17.4%), while E was 164.8 (12.2%) (P < 10−6). The excess showed a predilection for meta-analyses with nonsignificant summary effects and between-study heterogeneity. The excess was seen for all levels of statistical significance and also for studies with borderline P values (P = 0.05–0.10). The excess of significant findings may represent significance-chasing biases in a setting of massive testing.
Keywords: Alzheimer disease, bias (epidemiology), genetic markers, genetics, meta-analysis, publication bias
Genetic epidemiology is a rapidly evolving field, and the number of published reports is increasing geometrically (1). Many “significant” genetic associations are proposed, but several of them may represent false-positive results (2–5). As we have moved into large-scale testing of associations (6–8), understanding biases in statistically significant results is becoming increasingly useful.
Evaluation of observational associations has traditionally rested on P values and hypothesis-testing using nominal levels of statistical significance. This widespread practice may bias the accumulated evidence on single associations or in large fields of research (9). Various types of biases have been described. In publication bias, studies with nominally statistically significant (“positive”) results are more likely to be published than other (“negative”) findings (10–13). The latter findings may be published after a delay (time-lag bias) (14) or may remain unpublished. Selective analysis and outcome reporting bias also lead to overrepresentation of nominally statistically significant outcomes and findings and concealment of non-statistically significant results within the same study (15–17). Finally, some statistically significant results may be fabricated (fake data), hopefully uncommonly (18–20). All of these biases converge towards increasing the relative proportion of nominally statistically significant findings in a body of evidence as compared with what would be expected in the absence of bias.
Several tests have been proposed for assessing the presence of publication bias, but they have limitations (21–24). They are designed to be applied to data from single meta-analyses of studies that all pertain to the same research question. Inferences derived from single meta-analyses are limited by the fact that usually few studies are available; thus, these tests are underpowered (25, 26). Recently, Ioannidis and Trikalinos (27) proposed an exploratory test that examines whether there is an excess of significant results in a whole domain of research. Identification of an excess of significant findings with this test can result either from significance-chasing biases or from excessive heterogeneity (diversity of effects) between studies on the same research question. Between-study heterogeneity could be due either to genuine diversity or to biases.
This test can be applied not only to single meta-analyses but also to whole domains of research across collections of many meta-analyses. Application in meta-analyses of clinical trials shows an overrepresentation of statistically significant treatment effects in some randomized clinical research, such as research on the effectiveness of diverse neuroleptic treatments (27). Some data suggest a possible excess of significant findings in genetic epidemiology, such as the Chinese-language literature on genetic associations or genetic associations in myocardial infarction (28, 29). Empirical surveys also corroborate the preference for reporting “positive” results in genetic epidemiology (30), and various investigators have reported evidence for publication bias in selected associations (31, 32). However, solid evidence requires the examination of large domains of genetic research, encompassing many hundreds of studies. Such large-scale evaluations may also help us evaluate whether excesses of statistically significant findings are due mostly to bias or to genuine heterogeneity.
Here, we applied this exploratory test to cumulative data contained in the AlzGene database (33). Alzheimer's disease is a prolific field in genetic association studies. With over 1,000 individual publications included to date, AlzGene offers the unique opportunity to study a large domain of observational research for a potential excess of statistically significant findings and to try to understand the reasons for such an excess.
MATERIALS AND METHODS
Database
AlzGene is a comprehensive, publicly available, regularly updated collection of published genetic association studies performed on Alzheimer's disease phenotypes. Details on study selection criteria and data displayed are described in detail elsewhere (33) (http://www.alzforum.org/res/com/gen/alzgene/methods.asp).
For consistency, the term “study” here refers to a case-control analysis of a specific polymorphism in persons of a certain ethnic background; thus, a published article may contain one or more “studies” (of different ethnic groups and/or different polymorphisms) in the same paper. All studies indexed in AlzGene up through January 31, 2007, were potentially eligible for our evaluation. Our main analyses excluded the apolipoprotein E (APOE) epsilon polymorphism, which has an extensively documented, atypically large, indisputable effect; however, we present separately results for this association. AlzGene studies have been scrutinized for overlapping data sets (33). We sought the following information from each study: first author and year of publication, PubMed identification number (whenever available), gene, polymorphism, ethnic group, total numbers of cases and controls, and allele counts in cases and controls.
Meta-analysis methods
Meta-analyses in AlzGene are performed whenever genotype data from 3 or more studies on the same polymorphism are available (33). The odds ratio per copy of the allele was our metric of choice. Whenever genotype counts for cases and/or controls were 0, we added 0.5 to all cells of the 2 × 2 table to conduct calculations. A random-effects model was used for all meta-analyses (34). Random effects assume the possibility of a different underlying effect for each study in the meta-analysis and take this into consideration as an additional source of variation. When there is no between-study heterogeneity, fixed-effects (35) and random-effects estimates coincide. In the presence of between-study heterogeneity, the basic assumption of fixed effects is violated; thus, random effects are typically more appropriate.
Between-study heterogeneity was evaluated using the Cochran Q statistic (36) and the I2 metric (37). Q is considered statistically significant for P < 0.10. I2 provides an estimate of the observed heterogeneity due to reasons beyond chance. Typically, values greater than 50% are considered to represent large heterogeneity and values of 25%–50% are considered to represent modest heterogeneity (37).
Test for excess of significant findings in single meta-analyses
The test is described in detail elsewhere (27). Briefly, in each meta-analysis, we assessed whether the observed number of studies (O) with statistically significant (“positive”) results at the 0.05 level differed from the expected number of studies (E) with “positive” results (27). We counted significant results in both directions. The expected probability that a specific single study i will find a “positive” result equals its power to detect a plausible effect size at the 0.05 level. E equals the sum of the expected probabilities across all n studies on the same question. For the main application of the test, we use the summary odds ratio of the respective meta-analysis (random-effects calculations) as the plausible effect size (27). Inferences can use the chi-squared statistic
or a binomial probability test, which is preferable when numbers are small, and the latter was used in the current study.
The power of the test is simply the power of a chi-squared or binomial test. This is low when there are few “positive” studies; thus, P < 0.10 is used for inferences, as in asymmetry tests (23, 25). Besides statistical testing, we also examined the O:E ratio.
For meta-analyses in which O significantly exceeds E (P < 0.10), this could reflect bias or genuine between-study heterogeneity in genetic effects. Bias also may often cause between-study heterogeneity. To differentiate genuine heterogeneity from bias, we also performed cumulative meta-analyses to explore the evolution of the summary effect over time (per calendar year of publication), as more studies were published on the same association. We wanted to see whether there was a succession of studies with nominally statistically significant effects pointing in one direction followed by studies with statistically significant effects pointing in the other direction that led to dissipation of the overall summary effect, suggestive of bias (38). Conversely, if the excesses of O over E were due to genuine diversity of effects without bias, there would be no reason why the average effect should be more likely to increase or decrease over time, and one would expect mostly different studies to show different magnitudes of effect rather than different large effects in completely opposite directions.
Excess of significant findings in the whole domain of Alzheimer's disease genetic associations
All meta-analyses in a single research field constitute a domain (27). The total number of observed “positive” studies and the total number of expected “positive” studies in the whole domain are the sums of the observed and expected numbers of “positive” studies at the meta-analysis level, counting all eligible meta-analyses.
In our main evaluation, we considered all meta-analyses included in AlzGene (associations with data on at least 3 eligible studies). Furthermore, we evaluated meta-analyses according to the estimated amount of between-study heterogeneity (those with I2 ≤ 50% vs. those with I2 > 50%); according to the statistical significance of the summary effect (meta-analyses with nominally statistically significant associations vs. those with associations that were nonsignificant at the P = 0.05 threshold); and according to the presence or absence of estimated large between-study heterogeneity and nominally significant results.
Consideration of different effect estimates
If some form of significance-chasing bias exists in the body of evidence on a research question, the summary odds ratio based on the observed data may be inflated in comparison with the true effect (27). Therefore, in additional analyses, we assumed the plausible effect estimate to be half of the log odds ratio. Finally, we performed analyses that considered a fixed value as the plausible effect size in significant associations. Based on recent experience suggesting mostly small effects (39, 40), we considered plausible odds ratio values of 1.05, 1.15, and 1.25.
Excess of studies with results at specific levels of statistical significance
All of the above testing aims to estimate the expected number of studies that are statistically significant using a P = 0.05 threshold and compare them against the observed studies that have significant results based on the same threshold. However, the concept can be generalized to any P value threshold. Therefore, we calculated E and counted O using different α thresholds (i.e., 0.30, 0.20, 0.15, 0.10, 0.05, 0.03, 0.01, and 0.001). This allowed us to estimate E and compare it against the respective O for the P value intervals 0.30–0.20, <0.20–0.10, <0.10–0.05, <0.05–0.01, and <0.01. We assessed whether there was an excess of studies with P values clustering in a specific range. In clinical trials, significance-chasing bias has been linked to an excess of studies with formally statistically significant results barely crossing the traditional P = 0.05 threshold (i.e., studies with P values of 0.01–0.05), but this may not always be the case (27), and it is unknown whether this also applies to genetic epidemiology.
Software
Meta-analyses were performed using the metan and metacum modules. Power was estimated by means of simulations (1,000 replicates per analysis), using a previously developed module based on Fisher's exact test (module downloaded from http://www.dhe.med.uoi.gr/software.htm) (27). P values were 2-tailed. Analyses were performed using Intercooled Stata 8.2 (Stata Corporation, College Station, Texas).
RESULTS
AlzGene database
Based on studies included in AlzGene through January 31, 2007 (date of data freeze), 176 polymorphisms in 93 genes had been evaluated in at least 3 studies for their association with Alzheimer's disease (a total of 1,565 studies). Of those, 150 studies overlapped with others, and 67 studies did not provide usable genotype or allele data. Thus, we analyzed 1,348 studies for 175 polymorphisms in 93 genes (Table 1). Data were derived from 584 different articles. The 175 meta-analyses included 3–47 studies each (median, 10). (A list of the studies analyzed is available from the authors upon request.) Forty meta-analyses had statistically significant summary effects: Nine did not include any statistically significant study, while 31 included significant studies with effects pointing in the same direction as the summary estimate (Figure 1, part A). Among the 135 nonsignificant meta-analyses, 56 had no significant studies, 59 had one or more significant studies with an effect pointing in a single direction (Figure 1, part B), and 20 included significant studies with effects pointing in both directions (Figure 1, part C). Almost two-thirds of the meta-analyses (n = 114) had estimates of I2 that did not suggest large heterogeneity (>50%).
Table 1.
Characteristics of 175 Meta-Analysesa of Genetic Associations with Alzheimer's Disease Included in the AlzGene Database through January 31, 2007
| Characteristic | No. | % | Interquartile Range |
| Median no. of studies included per meta-analysis | 10 | 5–22 | |
| Median sample size per meta-analysis | 2,594 | 1,665–4,092 | |
| Median sample size per study | 412 | 259–692 | |
| No. of meta-analyses with statistically significant results (P < 0.05) | 40 | 22.9 | |
| No. of meta-analyses with I2 ≤ 50% | 114 | 65.1 |
A list of the studies analyzed is available from the authors upon request.
Figure 1.
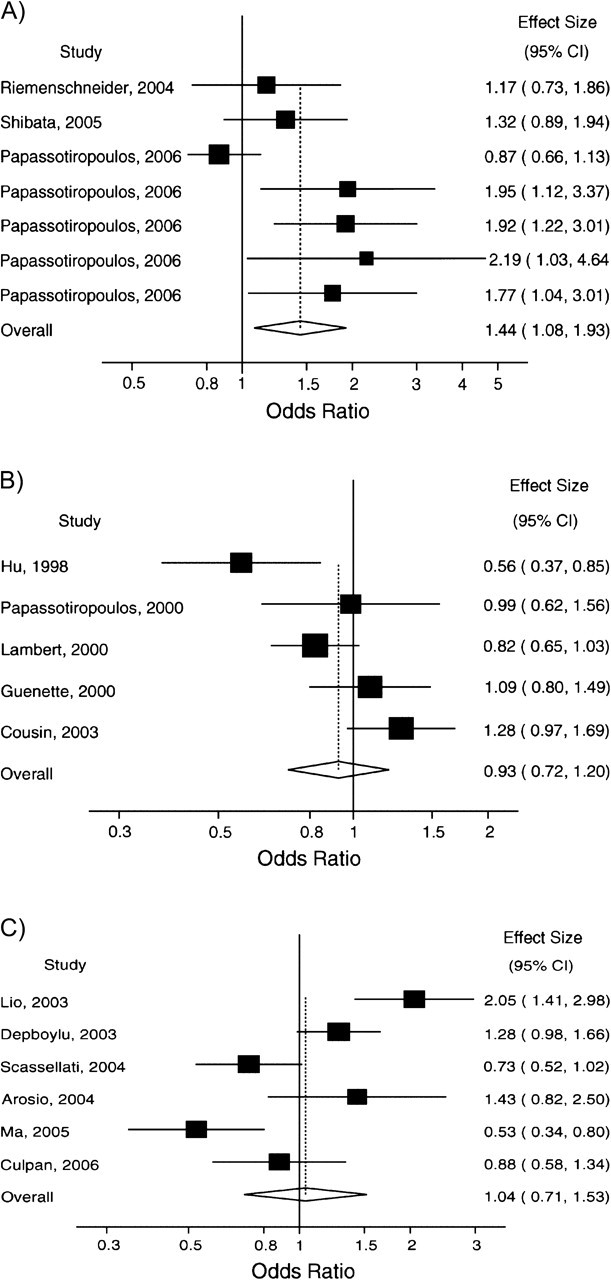
Representative forest plots of meta-analyses for typical patterns of included studies. A) Statistically significant summary effect and all significant studies point in the same direction as the overall estimate (cholesterol 25-hydroxylase (CH25H) rs13500); B) non-statistically significant summary estimate with one or several significant studies pointing in the same direction (amyloid beta (A4) precursor protein-binding, family B, member 1 (APBB1) rs1799755); C) non-statistically significant summary estimate and significant studies pointing in both directions (interleukin-10 (IL10) rs1800871 (−819)). In each meta-analysis (parts A–C), studies are ordered by year of publication. CI, confidence interval. (The articles used as sources for these meta-analyses are listed in a supplement posted on the Journal’s website (http://aje.oxfordjournals.org/).)
Evaluation of single meta-analyses
Among the 175 meta-analyses included in our sample, 19 showed a significant excess (P < 0.10) of studies with nominally statistically significant results compared with those that would be expected. None of these 19 meta-analyses had found a nominally statistically significant association between Alzheimer's disease and the tested polymorphisms (Table 2). The median number of studies included in these meta-analyses was 15 (interquartile range, 8–22; maximum = 39), whereas in the other 156 meta-analyses, the median was 5 (interquartile range, 3–7; maximum = 47). In 17 of the 19 meta-analyses, single studies had reported nominally statistically significant results with effect estimates pointing in opposite directions. Given these opposite effects, 15 of the 19 meta-analyses had I2 > 50%, while the other 4 (meta-analyses of ATP-binding cassette transporter A1 (ABCA1) rs2066718, cathepsin D (CTSD) rs17571 (A224V), APOE promoter rs769446 (−427), and brain-derived neurotrophic factor (BDNF) rs6265 (V66M)) had I2 values of 48%, 43%, 38%, and 30%, respectively.
Table 2.
Observed (O) and Expected (E) Numbers of Studies with Statistically Significant (P < 0.05) Results in AlzGene Meta-Analyses with a Statistically Significant Excess Number of “Positive” Studies
| Gene | Polymorphism | Odds Ratio | 95% Confidence Interval | No. of Studies | O | E | P Valuea | O:E Ratio |
| ABCA1 | rs2066718 | 1.16 | 0.74, 1.83 | 5 | 2 | 0.32 | 0.03 | 6.25 |
| ACE | Intron 16 (ins/del) | 1.07 | 0.99, 1.16 | 39 | 9 | 2.75 | <0.001 | 3.72 |
| APBB2 | hCV1558625 | 1.12 | 0.85, 1.46 | 3 | 2 | 0.50 | 0.08 | 4.00 |
| APOE promoter | rs769446 (−427) | 0.85 | 0.70, 1.03 | 12 | 3 | 1.08 | 0.09 | 2.78 |
| BCHE | rs1803274 K-variant | 1.10 | 0.96, 1.26 | 27 | 6 | 1.80 | 0.01 | 3.34 |
| BDNF | C270T | 1.11 | 0.82, 1.51 | 15 | 4 | 0.73 | 0.01 | 9.28 |
| BDNF | rs6265 V66M | 1.04 | 0.96, 1.13 | 20 | 3 | 1.06 | 0.09 | 2.83 |
| CTSD | rs17571 (A224V) | 1.14 | 0.98, 1.33 | 22 | 4 | 1.58 | 0.07 | 2.53 |
| ESR1 | PvuII | 1.11 | 0.98, 1.26 | 15 | 4 | 1.45 | 0.05 | 2.76 |
| ESR1 | XbaI | 1.12 | 0.97, 1.29 | 16 | 5 | 1.58 | 0.02 | 3.16 |
| IL6 | rs1800795 | 0.89 | 0.75, 1.05 | 14 | 5 | 1.85 | 0.03 | 2.70 |
| IL10 | rs1800871 (−819) | 1.04 | 0.71, 1.53 | 6 | 2 | 0.33 | 0.04 | 6.06 |
| IL10 | rs1800872 (−592) | 1.00 | 0.78, 1.29 | 8 | 2 | 0.36 | 0.05 | 5.56 |
| IL10 | rs1800896 (−1082) | 0.89 | 0.72, 1.11 | 8 | 3 | 0.78 | 0.04 | 3.85 |
| LRP1 | rs1799986 (exon 3) | 0.94 | 0.83, 1.06 | 27 | 5 | 1.42 | 0.01 | 3.52 |
| MPO | rs2333227 | 1.01 | 0.80, 1.28 | 9 | 3 | 0.40 | 0.01 | 7.5 |
| PLAU | rs2227564 | 1.07 | 0.94, 1.21 | 21 | 6 | 1.28 | <0.001 | 4.69 |
| SLC6A4 | HTTLPR | 1.04 | 0.83, 1.31 | 9 | 2 | 0.46 | 0.07 | 4.35 |
| TFCP2 | 3′-UTR | 0.77 | 0.55, 1.07 | 7 | 4 | 1.26 | 0.02 | 3.17 |
Abbreviations: ABCA1, ATP-binding cassette transporter A1; ACE, angiotensin-converting enzyme; APBB2, amyloid beta (A4) precursor protein-binding family B, member 2; APOE, apolipoprotein E; BCHE, butyrylcholinesterase; BDNF, brain-derived neurotrophic factor; CTSD, cathepsin D; ESR1, estrogen receptor 1; HTTLPR, serotonin-transporter-linked polymorphic region; IL6, interleukin-6; IL10, interleukin-10; LRP1, low density lipoprotein-related protein 1; MPO, myeloperoxidase; PLAU, plasminogen activator, urokinase; SLC6A4, serotonin transporter gene; TCFP2, transcription factor CP2; UTR, untranslated region.
P value for the difference between O and E (i.e., O − E).
The articles on the studies included in each of these 19 meta-analyses had been published over a period ranging from 1 year to 10 years (median, 5.5 years; interquartile range, 3–8). In 2 meta-analyses (meta-analyses of amyloid beta (A4) precursor protein-binding family B, member 2 (APBB2) hCV1558625 and ABCA1 rs2066718), all of the studies included had been published in the same year. For the APBB2 polymorphism, actually, all studies had been conducted and published by the same team in the same article. In the other 17 cumulative meta-analyses (Figure 2), in 15 the strongest effect estimate was shown in the first publication (or in the first year of publications, whenever several studies were published within this year), and for another 2 meta-analyses this occurred in the next calendar year (angiotensin-converting enzyme (ACE) intron 16 (insertion/deletion), interleukin-6 (IL6) rs1800795).
Figure 2.
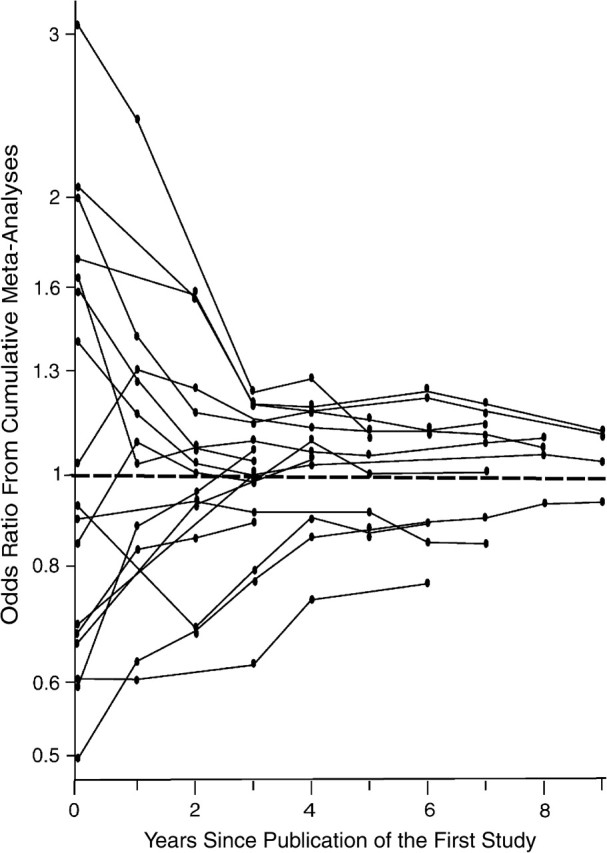
Cumulative effect estimates (odds ratios) per year after publication of the first study for meta-analyses that showed a statistically significant (P < 0.10) excess of observed significant studies compared with the expected ones. The first year of publication is shown at time point 0. Each circle corresponds to the point estimate of the cumulative meta-analysis in a given year. The point estimate is updated as new studies are published.
In 14 of the 19 associations with a documented excess of significant studies, cumulative meta-analyses showed nominally significant summary effects at some point. Opposite results often appeared very soon. In 5 meta-analyses, significance was lost with the appearance of additional studies in the same year, and 6 meta-analyses lost significance in the following calendar year; 2 took 3 years, while 1 took 4 years.
For the well-documented APOE epsilon 4 association, in the epsilon 4 versus epsilon 3 comparison, we obtained O = 32 and E = 31.7 (P = 1.00).
Test for excess of significant findings in the whole domain
Among 1,348 studies included in 175 meta-analyses, 235 (O = 235; 17.4%) were formally statistically significant at the P = 0.05 threshold, while the expected number was 164.8 (E = 164.8; 12.2%). This difference was highly statistically significant (P < 10−6). The ratio of O to E was 1.43. However, the excess of significant findings was largely confined to the meta-analyses that had non-statistically significant summary effects and large between-study heterogeneity, where the observed number of studies with significant findings exceeded the expected number by 2.5-fold (Table 3). There was modest correlation between I2 and O:E (Figure 3; Pearson r = 0.63).
Table 3.
Results from Testing for an Excess of Significant Findings in Meta-Analyses Included in the AlzGene Databasea
| No. of Studies | No. of Meta-Analyses | Summary Effect Point Estimate |
Sensitivity Analysis 1 |
||||||
| Ob | Eb | P Valuec | O:E | E | P Valuec | O:E | |||
| All meta-analyses | 1,348 | 175 | 235 | 164.8 | <10−6 | 1.61 | 90.4 | <10−6 | 2.60 |
| I2 ≤ 50% | 770 | 114 | 85 | 86.7 | 0.91 | 0.98 | 48.8 | 10−6 | 1.74 |
| I2 > 50% | 578 | 61 | 150 | 78.14 | <10−6 | 1.92 | 41.6 | <10−6 | 3.61 |
| Statistically significant associations | 241 | 40 | 69 | 74.40 | 0.49 | 0.93 | 30.3 | <10−6 | 2.28 |
| Non-statistically significant associations | 1,107 | 135 | 166 | 90.40 | <10−6 | 1.84 | 60.1 | <10−6 | 2.76 |
| I2 ≤ 50% and significant associations | 175 | 35 | 40 | 46.4 | 0.30 | 0.86 | 18.7 | 4 × 10⁻⁶ | 2.13 |
| I2 ≤ 50% and nonsignificant associations | 595 | 79 | 45 | 40.2 | 0.41 | 1.12 | 30.1 | 0.008 | 1.50 |
| I2 > 50% and significant associations | 66 | 5 | 29 | 28.0 | 0.80 | 1.04 | 11 | 10−6 | 2.64 |
| I2 > 50% and nonsignificant associations | 512 | 56 | 121 | 50.2 | <10−6 | 2.41 | 30.0 | <10−6 | 4.03 |
The main results assume that the plausible effect in each meta-analysis is given by the summary effect (odds ratio) of the meta-analysis. Also shown are results from evaluations using half of the log odds ratio (“Sensitivity Analysis 1”) as the plausible effect.
E, expected number of studies with nominally statistically significant results (P = 0.05 threshold) included in the meta-analyses; O, observed number of significant studies.
P value for the difference between O and E (i.e., O − E).
Figure 3.
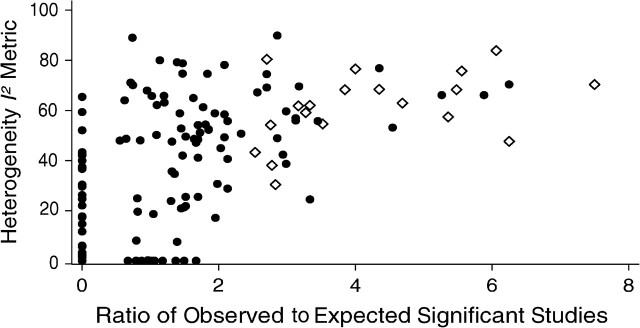
Scatterplot of the heterogeneity I2 metric and O:E ratio (number of observed studies (O) with statistically significant results (P = 0.05 threshold) vs. the number expected (E)) for the 175 meta-analyses included in the analysis. The filled circles stand for meta-analyses with a nonsignificant excess of observed versus expected significant meta-analyses, and the open diamonds stand for meta-analyses with a significant excess of observed versus expected significant meta-analyses.
Based on the available number of studies and O counts, the power of the test to detect an excess of significant findings with O:E = 1.4 in the whole domain and in the subgroups of I2 ≤ 50%, I2 > 50%, significant associations, and nonsignificant associations was 96%, 68%, 92%, 67%, and 91%, respectively.
Consideration of different effect estimates
When we used half of the log odds ratio as the plausible effect estimate, there were 2.6 times more statistically significant studies than one would expect (235 vs. 90.4; P < 10−6). Even for significant associations without large heterogeneity, this assumption inferred that O exceeded E by 2.3-fold. There was a significant excess of significant findings in 8 of the 40 meta-analyses with statistically significant associations (Table 4). However, 2 of these 8 variants were in linkage disequilibrium with APOE epsilon, and another 3 were in genes where additional variants existed with statistically significant meta-analyses and without an excess of significant findings. If we assumed that the odds ratios per allele copy were 1.05, 1.15, and 1.25, then 13, 7, and 5 of these 40 meta-analyses, respectively, would have a significant excess (P < 0.10) of significant estimates in single studies.
Table 4.
Observed (O) and Expected (E) Numbers of Studies with Statistically Significant (P < 0.05) Results in AlzGene Meta-Analyses with Formally Statistically Significant Associationsa
| Gene | Polymorphism | Odds Ratio | 95% Confidence Interval | No. of Studies | O |
E |
P Value |
||
| Main Analysis | Sensitivity Analysis 1 | Main Analysis | Sensitivity Analysis 1 | ||||||
| ACE | rs1800764 (ACE7) | 0.83 | 0.72, 0.95 | 5 | 0 | 1.09 | 0.44 | 0.59 | 1.00 |
| ACE | rs4291 (ACE6) | 0.86 | 0.75, 0.99 | 5 | 0 | 0.72 | 0.34 | 1.00 | 1.00 |
| ACE | rs4362 (ACE2) | 0.83 | 0.70, 0.99 | 3 | 0 | 0.63 | 0.27 | 1.00 | 1.00 |
| APOC1 | Ins/del (HpaI)b | 2.07 | 1.67, 2.57 | 13 | 8 | 10.79 | 5.32 | 0.05 | 0.16 |
| APOE promoter | rs405509 (Th1/E47cs) | 0.79 | 0.71, 0.87 | 15 | 5 | 5.88 | 2.03 | 0.79 | 0.04* |
| APOE promoter | rs440446 (+113) | 0.58 | 0.50, 0.68 | 4 | 3 | 3.68 | 1.92 | 0.28 | 0.36 |
| APOE promoter | rs449647 (−491) | 0.72 | 0.63, 0.81 | 36 | 13 | 10.79 | 4.01 | 0.47 | ≤0.001* |
| CH25H | rs13500 | 1.44 | 1.08, 1.93 | 7 | 4 | 2.46 | 0.86 | 0.25 | 0.01* |
| CHRNB2 | rs4845378 | 0.67 | 0.50, 0.90 | 4 | 1 | 0.95 | 0.35 | 1.00 | 0.30 |
| CST3 | 5′-UTR-157 | 1.23 | 1.03, 1.47 | 4 | 0 | 0.79 | 0.33 | 1.00 | 1.00 |
| CST3 | 5′-UTR-72 | 1.28 | 1.05, 1.56 | 3 | 0 | 0.81 | 0.30 | 0.57 | 1.00 |
| CST3 | rs1064039 | 1.15 | 1.02, 1.31 | 9 | 1 | 1.04 | 0.57 | 1.00 | 0.44 |
| DAPK1 | rs4877365 | 0.80 | 0.69, 0.92 | 3 | 1 | 1.27 | 0.44 | 1.00 | 0.38 |
| DAPK1 | rs4878104 | 0.87 | 0.79, 0.95 | 6 | 1 | 1.49 | 0.60 | 1.00 | 0.47 |
| DNFB31 | rs2274159 | 1.18 | 1.05, 1.34 | 3 | 1 | 0.99 | 0.37 | 1.00 | 0.33 |
| GAPDHS | rs12984928 | 0.82 | 0.71, 0.95 | 3 | 1 | 1.24 | 0.44 | 1.00 | 0.38 |
| GAPDHS | rs4806173 | 0.81 | 0.71, 0.94 | 3 | 2 | 1.34 | 0.46 | 0.59 | 0.06* |
| IL1b | rs1143634 (+3953) | 1.18 | 1.03, 1.34 | 7 | 1 | 0.98 | 0.47 | 1.00 | 0.39 |
| LOC439999 | rs498055 | 1.18 | 1.03, 1.34 | 7 | 3 | 1.83 | 0.70 | 0.39 | 0.03* |
| LPL | rs320 (HindIII) | 0.73 | 0.59, 0.90 | 3 | 1 | 1.15 | 0.40 | 1.00 | 0.35 |
| MAPT | rs1467967 (promoter) | 0.86 | 0.75, 1.00 | 4 | 0 | 0.65 | 0.31 | 1.00 | 0.56 |
| MAPT | rs242557 (promoter) | 1.34 | 1.01, 1.53 | 4 | 0 | 1.20 | 0.45 | 0.59 | 0.07* |
| MAPT | rs2471738 (intron 9) | 1.42 | 1.20, 1.70 | 4 | 2 | 1.89 | 0.64 | 1.00 | 0.12 |
| NCSTN | −119 intron 16 | 1.38 | 1.03, 1.83 | 3 | 1 | 0.72 | 0.31 | 0.56 | 0.28 |
| POMT1 | rs2018621 | 1.70 | 1.24, 2.34 | 3 | 2 | 1.34 | 0.42 | 0.59 | 0.05* |
| PON1 | rs662 (R192Q) | 0.86 | 0.77, 0.97 | 8 | 1 | 1.02 | 0.51 | 1.00 | 0.41 |
| PRNP | rs1799990 (M129V) | 0.89 | 0.81, 0.98 | 10 | 1 | 1.26 | 0.69 | 1.00 | 0.51 |
| SOAT1 | rs1044925 | 1.31 | 1.11, 1.55 | 4 | 1 | 1.26 | 0.45 | 1.00 | 0.38 |
| SORCS1 | rs600879 | 1.24 | 1.04, 1.47 | 4 | 1 | 0.85 | 0.37 | 1.00 | 0.32 |
| SORL1 | rs2070045 | 1.20 | 1.02, 1.41 | 5 | 1 | 1.55 | 0.60 | 1.00 | 0.47 |
| SORL1 | rs2282649 | 1.14 | 1.03, 1.26 | 5 | 1 | 1.00 | 0.44 | 1.00 | 0.37 |
| SORL1 | rs3824968 | 1.21 | 1.01, 1.45 | 5 | 2 | 1.83 | 0.67 | 1.00 | 0.13 |
| SORL1 | rs661057 | 0.84 | 0.73, 0.96 | 5 | 1 | 1.81 | 0.63 | 0.66 | 0.49 |
| SORL1 | rs668387 | 0.82 | 0.69, 0.98 | 5 | 2 | 2.10 | 0.74 | 1.00 | 0.16 |
| TF | rs1049296 (P570S) | 1.21 | 1.07, 1.39 | 13 | 2 | 1.92 | 0.90 | 1.00 | 0.23 |
| TFAM | rs2306604 | 0.78 | 0.62, 0.98 | 3 | 0 | 0.62 | 0.23 | 1.00 | 1.00 |
| TGFB1 | rs9282871 (Leu10Pro) | 0.87 | 0.77, 0.99 | 3 | 0 | 0.67 | 0.29 | 1.00 | 1.00 |
| TNF | −863 | 0.71 | 0.53, 0.96 | 3 | 2 | 1.01 | 0.37 | 0.26 | 0.04* |
| TNF | rs4647198 (−1031) | 1.37 | 1.05, 1.78 | 3 | 1 | 0.73 | 0.26 | 0.57 | 0.24 |
| hCG2039140c | rs1903908 | 1.23 | 1.06, 1.44 | 4 | 0 | 1.03 | 0.42 | 0.58 | 1.00 |
Abbreviations: ACE, angiotensin-converting enzyme; ABCA1, ATP-binding cassette transporter A1; APOC1, apolipoprotein C1; APOE, apolipoprotein E; CH25H, cholesterol 25-hydroxylase; CHRNB2, cholinergic receptor, nicotinic, beta 2; CST3, cystatin 3; DAPK1, death-associated protein kinase 1; DFNB31, deafness, autosomal recessive 31; GAPDHS, glyceraldehyde-3-phosphate dehydrogenase, spermatogenic; IL1b, interleukin-1b; LOC439999, similar to ribosomal protein S3a; LPL, lipoprotein lipase; MAPT, microtubule-associated protein; NCSTN, nicastrin; POMT1, protein-O-mannosyltransferase 1; PON1, paraoxonase 1; PRNP, prion protein; SOAT1, sterol O-acyltransferase 1; SORCS1, sortilin-related VPS10 domain containing receptor 1; SORL1, sortilin-related receptor, L(DLR class) A repeats-containing; TF, transferring; TFAM, transcription factor A, mitochondrial; TGFB1, transforming growth factor, beta 1; TNF, tumor necrosis factor; UTR, untranslated region.
P < 0.10 for an excess of O over E.
The main results assume that the plausible effect in each meta-analysis is given by the summary effect (odds ratio) of the meta-analysis. Also shown are results from evaluations using half of the log odds ratio (“Sensitivity Analysis 1”) as the plausible effect.
Note that for this polymorphism, there is seemingly an excess of E over O—probably a chance finding resulting from the high number of analyses conducted. The signal of this single nucleotide polymorphism is probably due to high linkage disequilibrium with the APOE ϵ2/3/4 single nucleotide polymorphism.
This gene does not yet have an official name.
Excess of studies with results at specific levels of statistical significance
As Figure 4 shows, there was overall a strong excess of studies with P values close to but not passing the typical 0.05 threshold for statistical significance (P = 0.05–0.10). There was a less prominent excess for studies with P values in the 0.01–0.05 range and another clear excess of studies with P values less than 0.01.
Figure 4.
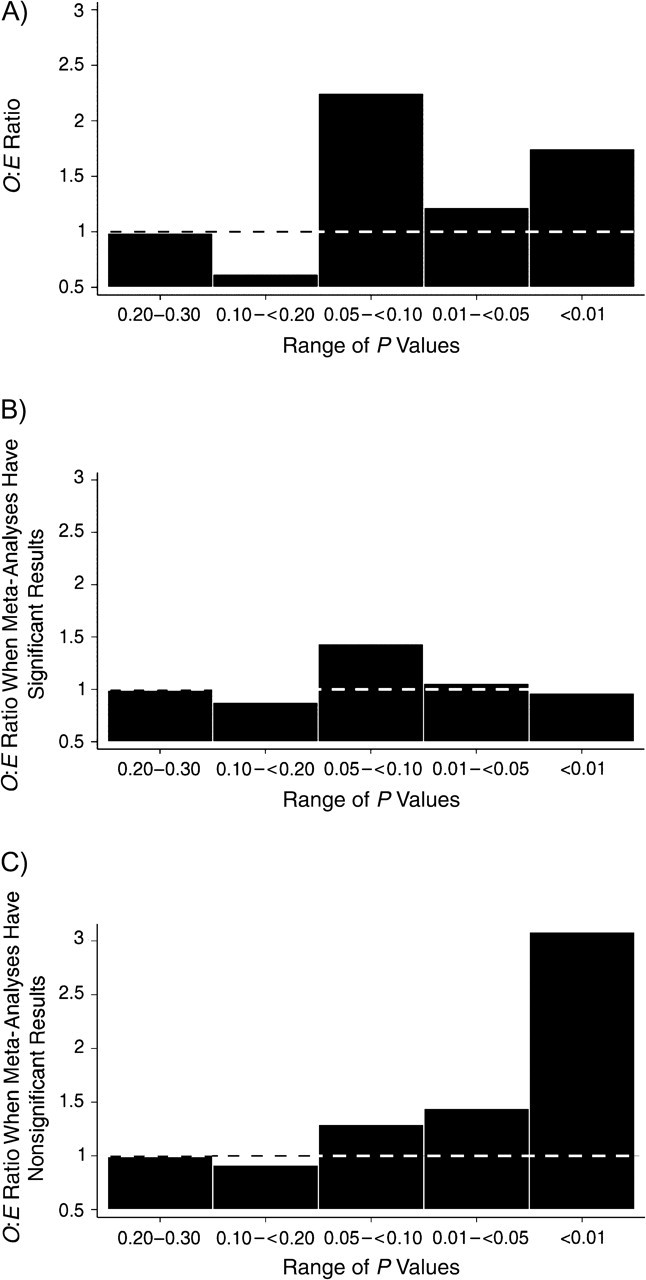
Ratio of observed (O) to expected (E) numbers of studies with results in a specific range of P values. A) All meta-analyses; B) meta-analyses with significant results; C) meta-analyses with nonsignificant results. Dotted lines correspond to 1, where O and E are equal.
Among meta-analyses of statistically significant associations, there was a modest excess of studies with borderline significance (P = 0.05–0.10). Among meta-analyses of non-statistically significant associations, the excess became more prominent with lower P values, particularly P < 0.01 (Figure 2). This pattern was driven primarily by heterogeneous meta-analyses of non-statistically significant associations, where the O:E ratio was 4 in the P < 0.01 category (Figure 5).
Figure 5.
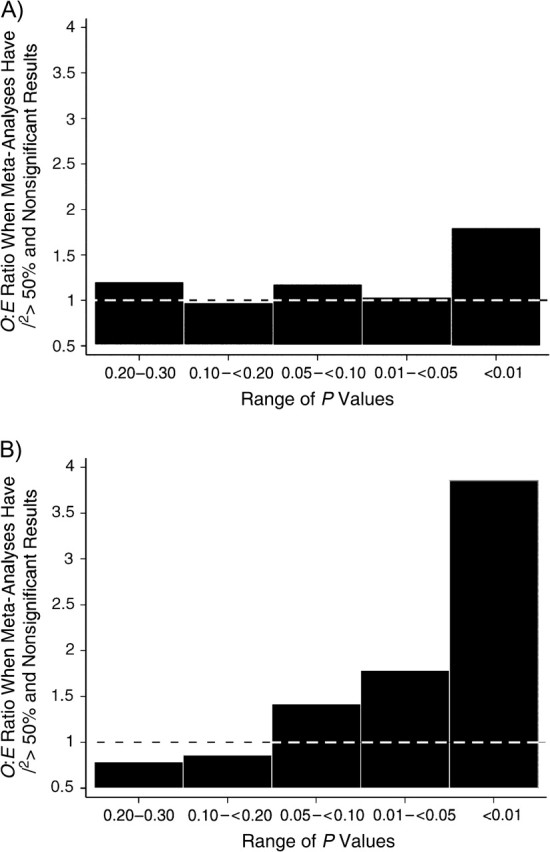
Ratio of observed (O) to expected (E) numbers of studies with results in a specific range of P values. A) Meta-analyses with I2 ≤ 50% and nonsignificant results; B) meta-analyses with I2 > 50% and nonsignificant results. Dotted lines correspond to 1, where O and E are equal.
DISCUSSION
We performed an empirical evaluation of significant findings of genetic associations with Alzheimer's disease in the published literature. Examination of 175 eligible meta-analyses containing a total of 1,348 studies documented a clear excess of significant findings. However, this excess was largely confined to meta-analyses that have not found statistically significant associations, once data are standardized to a common genetic model for all studies. For some associations, evidence accumulates from studies with entirely opposite results that eventually cancel out, when synthesized to obtain a summary effect. This situation is consistent with the well-described lack of replication documented in diverse fields of genetic associations (2, 41). At its most extreme, it takes the form of the Proteus phenomenon, with rapid succession of contradictory results, sometimes even in the same article (38).
Significance-chasing probably reflects an unavoidable phase of exploratory research that precedes the serious determination of whether a particular association is “real.” Dissipation of early promising effects over time is an appropriate evolution of knowledge that highlights the value of meta-analyses. Inherently inflated early effects are also theoretically and empirically documented in current genome-wide association discovery approaches (3, 42). The problem arises when additional false-positive findings are not dissipated as promptly, thus remaining entrenched in the literature. This is important to settle, because solid evidence is needed to move from gene discovery to public health impact (43).
For the 40 associations for which meta-analyses suggest statistically significant summary effects, we did not document a clear excess of significant findings. However, the exploratory test lacks sufficient power to detect an excess of significant findings in meta-analyses with few significant studies. Moreover, bias may often inflate the treatment effect without a disproportionate increase in the number of single studies with significant results. Under the assumption that inflation doubles the observed effects, 8 of the 40 meta-analyses give signals of an excess of significant studies. Nevertheless, 5 of these 8 meta-analyses refer to variants that either are in linkage disequilibrium with the APOE epsilon polymorphism or are in genes that also show other variants without a documented excess of significant findings. Therefore, it is possible that some of these associations are still real.
For the meta-analyses that found eventually significant associations, we did document possible clustering of studies in the 0.05–0.10 range of P values. Meta-analyses use a standardized approach in which all studies are analyzed according to the same model—here, a per-allele analysis. Some of the included studies may not be formally statistically significant with this model, but other analyses may have crossed the more traditional P = 0.05 threshold of statistical significance.
An excess can herald either significance-chasing biases or genuine between-study heterogeneity (27). In addition, biases may generate between-study heterogeneity on their own, if they affect some studies in the meta-analysis but not others. The application of this test in a very large genetic database helps us discriminate, at least in part, between these possibilities. The most prominent excess was seen in associations with studies describing statistically significant effects in the opposite direction. In theory (44), associations may exhibit effects pointing in opposite directions in different populations (“genetic flip-flop”), particularly when linkage disequilibrium patterns vary a lot across tested populations. However, extreme differences in linkage-disequilibrium patterns would have to be envisioned; the opposite effects are also typically so extreme that this explanation is unlikely. Probably, opposite effects reflect chance findings in a milieu of massive testing of associations, accompanied by a preference for the dissemination of formally statistically significant results and occasionally also prominent contradictions of previous prominent claims (38). In all, the excess of significant findings and the common between-study heterogeneity in nonsignificant associations is probably largely due to bias rather than to genuine diversity of genetic effects. Occasionally, the opposite results in different populations may be assembled in the same publication, as in current genome-wide association investigations where several replication populations are genotyped concurrently.
Some additional caveats should be discussed. First, the estimates of between-study heterogeneity in meta-analyses carry considerable uncertainty (45–47). The 95% confidence intervals for I2 for most meta-analyses are wide. Thus, heterogeneity in some associations may be misclassified. Second, inferences regarding the excess of significant findings or lack thereof in single meta-analyses should be tempered by the low power of the test for single meta-analyses. However, this is not a concern for domains combining many meta-analyses. Third, one should be cautious about extrapolations to other diseases or more complex analyses and associations (e.g., gene-gene and/or gene-environment interactions). Observed heterogeneity may have different implications in different fields.
With the advent of massive-testing technologies, new challenges arise (3, 5), and significance-chasing biases may still erode the credibility of accumulated evidence (48). Only the most significant associations can now typically be reported in published papers on genome-wide association studies. However, all of the additional testing results should be available somehow; otherwise, publication bias and selective analysis reporting bias are maximized. Transparent availability of protocols and databases from such studies and collaboration among research teams in the same field should be facilitated (49, 50). Efforts to maintain up-to-date databases and to perform synopses of all of the possible meta-analyses per field, as exemplified by AlzGene (33), should be encouraged (1) to facilitate tracking of the evolving strength of proposed genetic associations and translation to their public health impact.
Acknowledgments
Author affiliations: Clinical and Molecular Epidemiology Unit, Department of Hygiene and Epidemiology, University of Ioannina School of Medicine, Ioannina, Greece (Fotini K. Kavvoura, John P. A. Ioannidis); Institute for Behavioral Genetics, University of Colorado, Boulder, Colorado (Matthew B. McQueen); National Office of Public Health Genomics, Centers for Disease Control and Prevention, Atlanta, Georgia (Muin J. Khoury); Genetics and Aging Research Unit, MassGeneral Institute for Neurodegenerative Disease, Department of Neurology, Massachusetts General Hospital, Charlestown, Massachusetts (Rudolph E. Tanzi, Lars Bertram); Biomedical Research Institute, Foundation for Research and Technology–Hellas, Ioannina, Greece (John P. A. Ioannidis); Institute for Clinical Research and Health Policy Studies, Department of Medicine, Tufts Medical Center, Tufts University School of Medicine, Boston, Massachusetts (John P. A. Ioannidis).
Dr F. K. Kavvoura was supported by a PENED (Programma Enisxusis Ereunitikou Dunamikou) grant cofinanced by the European Union–European Social Fund (75%) and the Greek Ministry of Development–General Secretariat of Research and Technology (25%). The AlzGene database is sponsored by a grant from the Cure Alzheimer Fund.
Conflict of interest: none declared.
Glossary
Abbreviations
- ABCA
ATP-binding cassette transporter A
- ACE
angiotensin-converting enzyme
- APBB
amyloid beta (A4) precursor protein-binding family B
- APOE
apolipoprotein E
- BDNF
brain-derived neurotrophic factor
- CTSD
cathepsin D
- IL6
interleukin-6
References
- 1.Ioannidis JP, Gwinn M, Little J, et al. A road map for efficient and reliable human genome epidemiology. Nat Genet. 2006;38(1):3–5. doi: 10.1038/ng0106-3. [DOI] [PubMed] [Google Scholar]
- 2.Hirschhorn JN, Lohmueller K, Byrne E, et al. A comprehensive review of genetic association studies. Genet Med. 2002;4(2):45–61. doi: 10.1097/00125817-200203000-00002. [DOI] [PubMed] [Google Scholar]
- 3.Ioannidis JP. Non-replication and inconsistency in the genome-wide association setting. Hum Hered. 2007;64(4):203–213. doi: 10.1159/000103512. [DOI] [PubMed] [Google Scholar]
- 4.Patterson M, Cardon L. Replication publication. PLoS Biol. 2005;3(9):e327. doi: 10.1371/journal.pbio.0030327. [DOI] [PMC free article] [PubMed] [Google Scholar]
- 5.Chanock SJ, Manolio T, Boehnke M, et al. Replicating genotype-phenotype associations. Nature. 2007;447(7145):655–660. doi: 10.1038/447655a. [DOI] [PubMed] [Google Scholar]
- 6.Evans DM, Cardon LR. Genome-wide association: a promising start to a long race. Trends Genet. 2006;22(7):350–354. doi: 10.1016/j.tig.2006.05.001. [DOI] [PubMed] [Google Scholar]
- 7.Marchini J, Donnelly P, Cardon LR. Genome-wide strategies for detecting multiple loci that influence complex diseases. Nat Genet. 2005;37(4):413–417. doi: 10.1038/ng1537. [DOI] [PubMed] [Google Scholar]
- 8.Thomas DC. Are we ready for genome-wide association studies? Cancer Epidemiol Biomarkers Prev. 2006;15(4):595–598. doi: 10.1158/1055-9965.EPI-06-0146. [DOI] [PubMed] [Google Scholar]
- 9.Ioannidis JP. Why most published research findings are false. PLoS Med. 2005;2(8):e124. doi: 10.1371/journal.pmed.0020124. [DOI] [PMC free article] [PubMed] [Google Scholar]
- 10.Dickersin K. The existence of publication bias and risk factors for its occurrence. JAMA. 1990;263(10):1385–1389. [PubMed] [Google Scholar]
- 11.Dickersin K, Min YI. Publication bias: the problem that won't go away. Ann N Y Acad Sci. 1993;703:135–146. doi: 10.1111/j.1749-6632.1993.tb26343.x. [DOI] [PubMed] [Google Scholar]
- 12.Dickersin K, Min YI, Meinert CL. Factors influencing publication of research results. Follow-up of applications submitted to two institutional review boards. JAMA. 1992;267(3):374–378. [PubMed] [Google Scholar]
- 13.Easterbrook PJ, Berlin JA, Gopalan R, et al. Publication bias in clinical research. Lancet. 1991;337(8746):867–872. doi: 10.1016/0140-6736(91)90201-y. [DOI] [PubMed] [Google Scholar]
- 14.Ioannidis JP. Effect of the statistical significance of results on the time to completion and publication of randomized efficacy trials. JAMA. 1998;279(4):281–286. doi: 10.1001/jama.279.4.281. [DOI] [PubMed] [Google Scholar]
- 15.Kavvoura FK, Liberopoulos G, Ioannidis JP. Selection in reported epidemiological risks: an empirical assessment [electronic article] PLoS Med. 2007;4(3):e79. doi: 10.1371/journal.pmed.0040079. [DOI] [PMC free article] [PubMed] [Google Scholar]
- 16.Chan AW, Krleza-Jeric K, Schmid I, et al. Outcome reporting bias in randomized trials funded by the Canadian Institutes of Health Research. CMAJ. 2004;171(7):735–740. doi: 10.1503/cmaj.1041086. [DOI] [PMC free article] [PubMed] [Google Scholar]
- 17.Chan AW, Hrobjartsson A, Haahr MT, et al. Empirical evidence for selective reporting of outcomes in randomized trials: comparison of protocols to published articles. JAMA. 2004;291(20):2457–2465. doi: 10.1001/jama.291.20.2457. [DOI] [PubMed] [Google Scholar]
- 18.Ranstam J, Buyse M, George SL, et al. Fraud in medical research: an international survey of biostatisticians. ISCB Subcommittee on Fraud. Control Clin Trials. 2000;21(5):415–427. doi: 10.1016/s0197-2456(00)00069-6. [DOI] [PubMed] [Google Scholar]
- 19.Gardner W, Lidz CW, Hartwig KC. Authors’ reports about research integrity problems in clinical trials. Contemp Clin Trials. 2005;26(2):244–251. doi: 10.1016/j.cct.2004.11.013. [DOI] [PubMed] [Google Scholar]
- 20.Al-Marzouki S, Evans S, Marshall T, et al. Are these data real? Statistical methods for the detection of data fabrication in clinical trials. BMJ. 2005;331(7511):267–270. doi: 10.1136/bmj.331.7511.267. [DOI] [PMC free article] [PubMed] [Google Scholar]
- 21.Lau J, Ioannidis JP, Terrin N, et al. The case of the misleading funnel plot. BMJ. 2006;333(7568):597–600. doi: 10.1136/bmj.333.7568.597. [DOI] [PMC free article] [PubMed] [Google Scholar]
- 22.Egger M, Davey Smith G, et al. Bias in meta-analysis detected by a simple, graphical test. BMJ. 1997;315(7109):629–634. doi: 10.1136/bmj.315.7109.629. [DOI] [PMC free article] [PubMed] [Google Scholar]
- 23.Begg CB, Mazumdar M. Operating characteristics of a rank correlation test for publication bias. Biometrics. 1994;50(4):1088–1101. [PubMed] [Google Scholar]
- 24.Rothstein HR, Sutton AJ, Borestein M. Publication Bias in Meta-Analysis—Prevention, Assessment and Adjustments. Chichester, United Kingdom: John Wiley and Sons Ltd; 2005. [Google Scholar]
- 25.Sterne JA, Gavaghan D, Egger M. Publication and related bias in meta-analysis: power of statistical tests and prevalence in the literature. J Clin Epidemiol. 2000;53(11):1119–1129. doi: 10.1016/s0895-4356(00)00242-0. [DOI] [PubMed] [Google Scholar]
- 26.Macaskill P, Walter SD, Irwig L. A comparison of methods to detect publication bias in meta-analysis. Stat Med. 2001;20(4):641–654. doi: 10.1002/sim.698. [DOI] [PubMed] [Google Scholar]
- 27.Ioannidis JP, Trikalinos TA. An exploratory test for an excess of significant findings. Clin Trials. 2007;4(3):245–253. doi: 10.1177/1740774507079441. [DOI] [PubMed] [Google Scholar]
- 28.Ntzani EE, Rizos EC, Ioannidis JP. Genetic effects versus bias for candidate polymorphisms in myocardial infarction: case study and overview of large-scale evidence. Am J Epidemiol. 2007;165(9):973–984. doi: 10.1093/aje/kwk085. [DOI] [PubMed] [Google Scholar]
- 29.Pan Z, Trikalinos TA, Kavvoura FK, et al. Local literature bias in genetic epidemiology: an empirical evaluation of the Chinese literature. PLoS Med. 2005;2(12):e334. doi: 10.1371/journal.pmed.0020334. [DOI] [PMC free article] [PubMed] [Google Scholar]
- 30.Calnan M, Smith GD, Sterne JA. The publication process itself was the major cause of publication bias in genetic epidemiology. J Clin Epidemiol. 2006;59(12):1312–1318. doi: 10.1016/j.jclinepi.2006.05.002. [DOI] [PubMed] [Google Scholar]
- 31.Munafo MR, Matheson IJ, Flint J. Association of the DRD2 gene Taq1A polymorphism and alcoholism: a meta-analysis of case-control studies and evidence of publication bias. Mol Psychiatry. 2007;12(5):454–461. doi: 10.1038/sj.mp.4001938. [DOI] [PubMed] [Google Scholar]
- 32.Serrano NC, Diaz LA, Paez MC, et al. Angiotensin-converting enzyme I/D polymorphism and preeclampsia risk: evidence of small-study bias. PLoS Med. 2006;3(12):e520. doi: 10.1371/journal.pmed.0030520. [DOI] [PMC free article] [PubMed] [Google Scholar]
- 33.Bertram L, McQueen MB, Mullin K, et al. Systematic meta-analyses of Alzheimer disease genetic association studies: the AlzGene database. Nat Genet. 2007;39(1):17–23. doi: 10.1038/ng1934. [DOI] [PubMed] [Google Scholar]
- 34.DerSimonian R, Laird N. Meta-analysis in clinical trials. Control Clin Trials. 1986;7(3):177–188. doi: 10.1016/0197-2456(86)90046-2. [DOI] [PubMed] [Google Scholar]
- 35.Mantel N, Haenszel W. Statistical aspects of the analysis of data from retrospective studies of disease. J Natl Cancer Inst. 1959;22(4):719–748. [PubMed] [Google Scholar]
- 36.Cochran WG. The combination of estimates from different experiments. Biometrics. 1954;10:101–129. [Google Scholar]
- 37.Higgins JP, Thompson SG, Deeks JJ, et al. Measuring inconsistency in meta-analyses. BMJ. 2003;327(7414):557–560. doi: 10.1136/bmj.327.7414.557. [DOI] [PMC free article] [PubMed] [Google Scholar]
- 38.Ioannidis JP, Trikalinos TA. Early extreme contradictory estimates may appear in published research: the Proteus phenomenon in molecular genetics research and randomized trials. J Clin Epidemiol. 2005;58(6):543–549. doi: 10.1016/j.jclinepi.2004.10.019. [DOI] [PubMed] [Google Scholar]
- 39.Easton DF, Pooley KA, Dunning AM, et al. Genome-wide association study identifies novel breast cancer susceptibility loci. Nature. 2007;447(7148):1087–1093. doi: 10.1038/nature05887. [DOI] [PMC free article] [PubMed] [Google Scholar]
- 40.Zeggini E, Weedon MN, Lindgren CM, et al. Replication of genome-wide association signals in UK samples reveals risk loci for type 2 diabetes. Science. 2007;316(5829):1336–1341. doi: 10.1126/science.1142364. [DOI] [PMC free article] [PubMed] [Google Scholar]
- 41.Ioannidis JP, Ntzani EE, Trikalinos TA, et al. Replication validity of genetic association studies. Nat Genet. 2001;29(3):306–309. doi: 10.1038/ng749. [DOI] [PubMed] [Google Scholar]
- 42.Zollner S, Pritchard JK. Overcoming the winner's curse: estimating penetrance parameters from case-control data. Am J Hum Genet. 2007;80(4):605–615. doi: 10.1086/512821. [DOI] [PMC free article] [PubMed] [Google Scholar]
- 43.Khoury MJ, Gwinn M, Burke W, et al. Will genomics widen or help heal the schism between medicine and public health? Am J Prev Med. 2007;33(4):310–317. doi: 10.1016/j.amepre.2007.05.010. [DOI] [PubMed] [Google Scholar]
- 44.Lin PI, Vance JM, Pericak-Vance MA, et al. No gene is an island: the flip-flop phenomenon. Am J Hum Genet. 2007;80(3):531–538. doi: 10.1086/512133. [DOI] [PMC free article] [PubMed] [Google Scholar]
- 45.Higgins JP, Thompson SG. Quantifying heterogeneity in a meta-analysis. Stat Med. 2002;21(11):1539–1558. doi: 10.1002/sim.1186. [DOI] [PubMed] [Google Scholar]
- 46.Huedo-Medina TB, Sanchez-Meca J, Marin-Martinez F, et al. Assessing heterogeneity in meta-analysis: Q statistic or I2 index? Psychol Methods. 2006;11(2):193–206. doi: 10.1037/1082-989X.11.2.193. [DOI] [PubMed] [Google Scholar]
- 47.Ioannidis JP, Patsopoulos NA, Evangelou E. Heterogeneity in meta-analyses of genome-wide association investigations. PLoS ONE. 2007;2(9):e841. doi: 10.1371/journal.pone.0000841. [DOI] [PMC free article] [PubMed] [Google Scholar]
- 48.Ioannidis JP, Boffetta P, Little J, et al. Assessment of cumulative evidence on genetic associations: interim guidelines. Int J Epidemiol. 2008;37(1):120–132. doi: 10.1093/ije/dym159. [DOI] [PubMed] [Google Scholar]
- 49.Ioannidis JP, Bernstein J, Boffetta P, et al. A network of investigator networks in human genome epidemiology. Am J Epidemiol. 2005;162(4):302–304. doi: 10.1093/aje/kwi201. [DOI] [PubMed] [Google Scholar]
- 50.The GAIN Collaborative Research Group. New models of collaboration in genome-wide association studies: the Genetic Association Information Network. Nat Genet. 2007;39(9):1045–1051. doi: 10.1038/ng2127. [DOI] [PubMed] [Google Scholar]