

Abstract
The misfolding and self-assembly of the amyloid-beta (Aβ) peptide into aggregates is a molecular signature of the development of Alzheimer’s disease but molecular mechanisms of the peptide aggregation remain unknown. Here, we combined Atomic Force Microscopy (AFM) and Molecular Dynamics (MD) simulations to characterize misfolding process of an Aβ peptide. Dynamic force spectroscopy AFM analysis showed that the peptide forms stable dimers with the lifetime of ~1 s. During MD simulations isolated monomers gradually adopt essentially similar non-structured conformations independent from the initial structure. However, when two monomers approach their structure changes dramatically and the conformational space for the two monomers become restricted. The arrangement of monomers in antiparallel orientation leads to the cooperative formation of β-sheet conformation. Interactions, including hydrogen bonds, salt bridges and weakly polar interactions of side chains stabilize the structure of the dimer. Under the applied force, the dimer, as during the AFM experiments, dissociates in a cooperative manner. Thus, misfolding of the Aβ peptide proceeds via the loss of conformational flexibility and formation of stable dimers suggesting their key role in the subsequent Aβ aggregation process.
Keywords: Amyloid beta, aggregation, atomic force microscopy, molecular dynamics simulations, stable dimers
INTRODUCTION
Understanding the molecular mechanism of protein misfolding and self-assembly into amyloid aggregates and fibrils is a problem of great importance. Spontaneous aggregation is observed with almost any protein1. Self-assembly of proteins into amyloid aggregates leads to the development of a number of devastating neurodegenerative diseases, including Alzheimer’s, Parkinson’s, and Huntington’s diseases, amyotrophic lateral sclerosis, frontal temporal dementia, and the human prion diseases1. Studies during past decade, using X-ray fibril diffraction2, solid state NMR3, and spectroscopic methods4,5, showed that the structure of proteins within fibrils is entirely different from that of the non-aggregated proteins in solution. The presence of β-sheet structure is a common feature of amyloid fibrils. Amyloid β (Aβ) peptide is non-structured in aqueous solution but in fibrils it forms a β-strand - loop - β-strand structure, so that only the first 10 residues of Aβ(1–40) are not structured6–8. Studies so far suggest that the formation of amyloid aggregates requires a substantial change of protein conformation, but no mechanism has been suggested.
Molecular dynamics (MD) simulations are also used to explore both the conformation and aggregation of Aβ peptides of various sizes. For example, it was shown that the Aβ(16–22) fragment adopts diverse conformations, including random coil, β-strand or α-helix9,10 and polyproline II structure11. Using replica exchange MD simulations to study the interaction of the monomeric Aβ (16–22) peptide with preformed structured oligomers (4–6 monomers) it was shown that an unstructured monomer docks to structured oligomer and adopts the conformation of those of the peptides in the nucleus of aggregates10. Simultaneously, the nucleus itself undergoes conformational changes to accommodate the entering peptide. Recently, MD simulations, using a coarse-grained force field, showed that, an early stage oligomerization of Aβ (1–28) peptide12 is initiated in the N-terminal regions and that this is accompanied by change of the C-terminal α-helical conformation to β-sheet.
The progress of experimental studies of oligomerization of Aβ peptides and other proteins is rather modest and primarily limited to the analysis of kinetics of the oligomerization. Numerous observations indicate that oligomers rather than fibrils are toxic in in vivo experiments13–15. Studies of different systems with various techniques showed that the formation of dimers as transient species for further aggregation is common16,17. Additionally, it was shown18 that dimers of Aβ-peptide are the most abundant species in the brain of Alzheimer’s disease patients and they induce neuritic degeneration in vivo. We have developed an AFM force spectroscopy approach for the study of protein misfolding and inter-molecular interactions19 and have shown that the strength of inter-protein interactions correlates with the propensity of proteins to aggregate20,21. Extension of this approach to single molecule level enabled us to employ the dynamic force spectroscopy (DFS) methodology22 to characterize properties of transient dimeric states of misfolded α-synuclein23,24 and Aβ peptide19,25. The dimeric complexes formed by these misfolded proteins are stable and dissociate characteristically in seconds. This is strikingly different from the conformational changes in the structures of monomers which occur in the microseconds-nanoseconds, suggesting that dimerization is the mechanism by which the misfolded state of proteins is stabilized19. Therefore, we propose that formation of dimers is the key step in initiation of aggregation and that dimers are the building blocks for the aggregation process. However, the mechanism underlying the formation of dimers and their structures in misfolded transient states remain unclear.
To address these questions, we combined AFM force spectroscopy and MD simulations to characterize the misfolding and aggregation process for Aβ peptide. We selected the 13–23 segment (HHQKLVFFAED) of Aβ since it contains the region Aβ(16–20), which is crucial for Aβ fibril formation and mediates the strongest Aβ-Aβ binding26,27. The N-terminal His13 was replaced with Cys to use as an anchor for a site specific immobilization of the peptide and the derivative is referred to as Aβ(13–23). The AFM experiments demonstrate that the peptide spontaneously forms amyloid fibrils. DFS analysis shows that the peptide dimers are stable with a lifetime of ~1 s. The MD simulations revealed that the peptide contains a β-turn/bend segment that refolds to a β-sheet conformation when two monomers approach and form a stable dimer structure in an antiparallel orientation. Steered MD simulation was applied to analyze the rupture process for the dimer. The results demonstrate that the individual peptide chains under the applied force undergo structural transition, which is accompanied by the sharp rupture of the dimer. A molecular mechanism is proposed for the protein misfolding and aggregation.
METHODS
Sample preparation for AFM force spectroscopy
Peptide immobilization on tips and mica sheets was as described recently in references 23 and 24. Briefly, silicon nitride (Si3N4) AFM tips (Veeco, MODEL: MSNL) were cleaned in 98% of ethanol and then irradiated by UV for 30 min. Then the AFM tips were immersed into 167 μM MAS aqueous solution for 3 h followed by multiple thorough rinsing with deionized water. For covalent attachment of the peptide to MAS functionalized tips, 19 nM peptide in pH 7.0 HEPES buffer was reacted with 0.25 mM TCEP hydrochloride for 10 min and the MAS-functionalized tips were immersed into this solution for 1 h. After the tips had been rinsed with the dilution buffer and NaCO3/NaHCO2 (pH 10) buffer, unreacted maleimide was blocked by treatment with 10 mM β-mercaptoethanol for 10 min at room temperature. The functionalized probes were washed with pH 7.0 HEPES buffer and stored in the same buffer until use. Typically, the storage time was less than 24 h.
Mica sheets were cut into ~1.5 cm×1.5 cm squares. The freshly cleaved mica surfaces were treated with APS for 30 minutes followed by the reaction with 167 μM NHS-PEG-SCM in DMSO for 3 hours. The mica squares were then rinsed repetitively with DMSO and then double distilled water to remove non-bound NHS-PEG-SCM and dried with a stream of argon gas. The peptide preparation and next steps were the same as described above for the AFM tips. The prepared mica squares were stored in pH 7.0 HEPES buffer until use. Typically, the storage time was less than 24 h.
AFM imaging
The Aβ(13–23) stock solution (3.74 mM) in DMSO was diluted to the concentration 100 μM in pH 5 buffer (a mixture of 1 mM Na2HPO4 and 0.94 mM Citric acid) and incubated at 37 °C for one day. The 10 μl of aliquots were placed on a freshly cleaved mica to allow the sample to adhere to the surface for 5 min. The unbound sample was rinsed with 100 μl of double-distilled water for three times, dried with a stream of argon gas and stored in vacuum oven at 25 °C overnight for fully dehydration. The images were acquired with Multimode AFM equipped with Nanoscope IIId controller (Veeco Inc., Santa Barbara, CA, USA) operating in tapping mode at ambient conditions. Silicon tip with spring constant as 40 N/m were used (Veeco Inc., Santa Barbara, CA, USA).
Molecular dynamics (MD) simulations
Simulations of monomer structures
The MD simulations were performed using the GROMACS 4.5.4 package28 by modifications of previous methods29,30 and using the OPLS-AA/L force field31. Three initial structures of Ac-[Cys13]Aβ(13–23)-NH2 for the simulations were derived using experimental Aβ structures from the protein data bank (PDB)32: The structure with PDB id. 1HZ333 was used for simulation I (simI), with PDB id. 1Z0Q34 was used for simulation II (simII) and the solid state NMR structure of Aβ(1–40) by Petkova and associate35 was used for simulation III (simIII). The N-acetyl and amide capping groups were added to the N and C-terminus, respectively, in order to preserve the electronic structure of the backbone as in the full length Aβ. Peptides were solvated with 1200, 1520 and 5070 TIP4P water molecules36 for simI, simII and simIII, respectively, in a truncated octahedron so that the minimal distance of the peptide from edge of the octahedron was minimum 1 nm. Charged side chains of peptides were neutralized by replacing water molecules with Na+ for Asp and Glu and Cl− for Lys residues at the positions of the first atoms with the most favorable electrostatic potential. Systems were subjected to 1000 steps steepest descent energy minimization and then to 100 ps NVT, constant number of molecules, of volume and of temperature (300 K) simulation so that the position of the peptide was constrained at the center of the octahedron with a force constant of 1000 kJ mol−1. Then, the three different initial starting structures were submitted to 200.2 ns NPT constant pressure (1 bar) and constant temperature (300 K) simulation. The following parameters were used for the simulations: integration step was 2 fs and snapshots of trajectories were saved at every 20 ps., the non-bonded interactions list was updated following every 10 steps; the LINCS algorithm37 was used to constrain all bonds to their correct length, with a warning angle of 30°; the peptide and solvent with ions were coupled to separate temperature baths with a relaxation constant of 0.1 ps; the peptide and solvent with ions were coupled separately to constant pressure using Berendsen scaling38 with a relaxation constant of 1.0 ps and 4.5 × 10⁻⁵ bar−1 isothermal compressibility. Coulomb interactions were calculated using a twin-range cutoff with reaction-field correction methods. The dielectric constant of the system was set to 78.0 beyond 1.4 nm. The short-range cutoff was 0.9 nm. For the calculations of Van der Waals interactions the short-range and long-range cutoff, respectively, was 0.9 and 1.4 nm and dispersion correction was applied.
Analysis of trajectories
The first 0.2 ns of the trajectory was considered as an equilibration period and was omitted from the analysis. The secondary structures explored during the simulations by Ac-[Cys13]Aβ(13–23)-NH2 were analyzed using the defined secondary structure of proteins (DSSP) method39. The φ and ψ torsional angles for each residues was determined using the g_rama utility of GROMACS. The R 2.14.0 program40 and in-house written R-script was used for data processing and drawing the Ramachandran plot following the methodology of Lovell and associates41. The number of intramolecular hydrogen bond was determined by using the g_h-bond utility of GROMACS. The root mean square deviation (RMSD) of backbone atoms and the radius of gyration (Rg) of the peptide chain was determined by the g_rms and g_gyrate, respectively, utility of GROMACS. Trajectories were submitted to cluster analysis by the GROMOS method of clustering42 using backbone RMSD cutoff of 0.1 nm.
To determine if the peptide explores similar conformational space during simI, simII and simIII, trajectories were compared by using essential dynamics analysis and calculating pairwise root mean square inner product (RMSIP) of eigenvector of trajectories43. Covariance matrix was calculated using the g_covar command of GROMACS, the eigenvectors corresponding to the ten highest eigenvalues were used to calculate the RMSIP. The RMSIP was calculated using equation for entire systems and individual monomers:
where ηi and νj are the eigenvectors of two independent simulations.
Simulation of the dimer structure
The dimer structure of the peptide in parallel arrangement was made from the central structure of the largest cluster of simIII (Fig. 3b) so that the x, y and z distances between the two chain were 1.5 nm, 0.5 nm and 0.1 nm, respectively. The individual chains were assigned as chain A and B. The dimer was solvated in a truncated octahedron with 3239 TIP4P water molecules so that the minimal distance of the peptide from edge of the octahedron was minimum 1 nm. Four Na+ and two Cl− ions were added to the systems to neutralize charges by replacing water molecules with Na+ for Asp and Glu and Cl− for Lys residues at the positions of the first atoms with the most favorable electrostatic potential. The system was subjected to 1000 steps steepest descent energy minimization and then to 100 ps NVT simulation at 300 K so that the position of the dimer was constrained at the center of the octahedron with a force constant of 1000 kJ mol−1. Then the system was submitted to 400.2 ns NPT simulation at 1 bar pressure and 300 K temperature. The rest of the parameters were the same as those of the monomer simulations. Two additional long-time simulations of the dimer structure, using two different force fields, were performed and the details are in the Supplementary Material.
Figure 3.
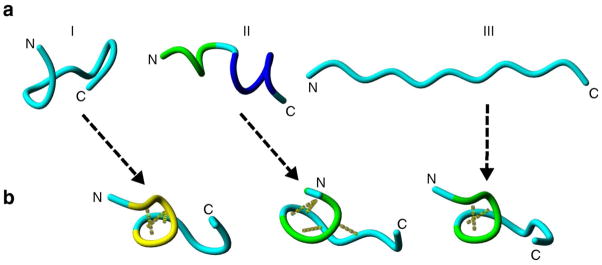
Initial and central structures of MD simulations of monomer structures I-III. (a) Tube representations of the backbone of the initial structures I-III for the three independent MD simulations. (b) The central structure of the largest cluster of the simulations. Random meander is cyan; α-helix is dark blue; 310-helix is yellow; turn is yellow and H-bonds are indicated by yellow dotted lines. N and C indicate N- and C-termini, respectively.
Analysis of the trajectory of dimer simulation
The DSSP analysis, inter chain hydrogen bonds determinations and the radius of gyration calculation were performed as for the monomer simulations. Inter chain salt bridges were determined using trajectory analysis tool of the VMD package44. To determine the parallel or antiparallel orientation of the chains, the distance between the center of mass of Cys13 of chain A (COM13A) and center of mass of Cys13 of chain B (COM13B) was calculated using the g_dist command of GROMACS. The first 200 ns trajectory and the last 50 ns of trajectory were submitted to cluster analysis using the GROMOS method of clustering42 and backbone RMSD cutoff of 0.1 nm. The angle and distance between the plains of the aromatic side chains of Phe were calculated to determine whether aromatic-aromatic (Ar-Ar) interactions exist between two residues. The plane of the Phe side chain ring was defined by CD1, CD2 and CZ atoms. The distance between two rings was the distance between the centers of mass of the aromatic side chain rings of Phe residues. Ar-Ar interactions were assumed when the distance was less than 0.7 nm and the angle between the was greater than or equal to 33° and less than or equal to 150° 45. The aromatic-backbone (Ar-bb) interactions were determined by calculating the angle and distance between the plane of aromatic ring of Phe and either the Cα-Hα vector or N-Hα vector of any other residue46. The aromatic-CH (Ar-CH) interactions were determined by calculating the angle and distance between the plane of aromatic ring of Phe and the Cβ-Hβ vector.
Steered Molecular Dynamics (SMD) simulations
The central structure of the largest cluster from the first 200 ns and the last 50 ns of the dimer simulation were used for steered molecular dynamics (SMD) simulations. Dimer structure was solvated in a cubic box of 6.555 nm × 4.376 nm × 18 nm with 16766 TIP4-P water molecules. Four Na+ ions and two Cl− ions were added to the systems to neutralize charges by replacing water molecules with Na+ for Asp and Glu and Cl− for Lys residues at the positions of the first atoms with the most favorable electrostatic potential. 100 ps NPT MD simulation was performed at 300 K with Berendsen method for temperature and pressure coupling and the position of the dimer was constrained at the center of the box with a force constant of 1000 kJ mol−1. During SMD simulations, the position of COM13B of the dimer was fixed and the COM13A was attached to a harmonic spring with spring constant of 1000 kJ mol−1 nm−2 and pulled along the z-axis (Figure 5a) at 5 nm/ns rate with simulation time of 1.4 ns. The final distance between COM13A and COM13B was 7.865 nm. The peptide and solvent with ions were separately coupled to 1 bar Parrinello-Rahman barostat47,48 and 300 K Nose-Hoover thermostat49,50. The long-range electrostatic interaction was calculated using the PME method with 0.9 nm cutoff distance and 0.12 nm Fourier spacing. The rest of the parameters were the same as above.
Figure 5.

Force curves acquired at 5 nm/ns pulling rate from SMD simulation. (a) Pulling the center of mass of Cys13 of monomer A (COM13A) along the z-axis. The central structure of the largest cluster of the last 50 ns of the MD simulation of the dimer is in a rectangular box. For clarity the water molecules are not shown. The dimension of the box is 6.555 nm × 4.376 nm × 18 nm. The pulling direction is indicated by a dashed arrow. Backbone conformation of the peptide chain is as follows: cyan is random meander; green is β-turn/bend, red arrow is β-sheet. Numbers inside the force curve panels indicate the time (b) and distance (c) locations of the characteristic peaks. Arrows and numbers on panel b indicate the snapshots in figure 6.
Umbrella sampling simulations
Umbrella sampling simulations51–53 were used to determine the energy of binding (ΔGbindA,B) of chain A to B. From the trajectory of the 5 nm/ns SMD simulation, along the z-axis (Figure 5a), 31 snapshots were taken as starting configurations for umbrella sampling simulations. In these snapshots the distance between COM13A and COM13B (ξ reaction coordinate) was increased by 0.25 nm step-wise. Each of the umbrella windows was simulated for 20 ns. 1000 kJ mol−1 nm−2 umbrella potential was imposed in each window. The peptide and solvent with ions were separately coupled to 1 bar Parrinello-Rahman barostat and 300 K Nose-Hoover thermostat. The long-range electrostatic interaction was calculated using the PME method with 0.9 nm cutoff distance and 0.12 nm Fourier spacing. The rest of the parameters were the same as above. The weighted histogram analysis method (WHAM)54–56 was used to determine the one-dimensional potential of mean force (PMF) curve. The value of ΔGbind was taken as the difference between the highest and lowest values of the PMF curve.
Software
Structure manipulations, data analyses and visualization were done using the analysis suite of the GROMACS51 package, the VMD44 and YASARA (www.yasara.org) packages.
RESULTS
Misfolding and aggregation of Aβ(13–23): Single molecule AFM studies
To test the ability of Aβ(13–23) to form amyloid fibrils, a solution of the peptide (100 μM) was prepared for the self-aggregation at room temperature. Aliquots of the solution were analyzed with AFM. Figure 1 shows a typical image for a sample incubated for 24 hours. The sample prepared under these conditions contains primarily fibrils of different lengths but rather uniform heights. Thus, Aβ(13–23) is capable of spontaneous self-assembly into amyloid fibrils.
Figure 1.
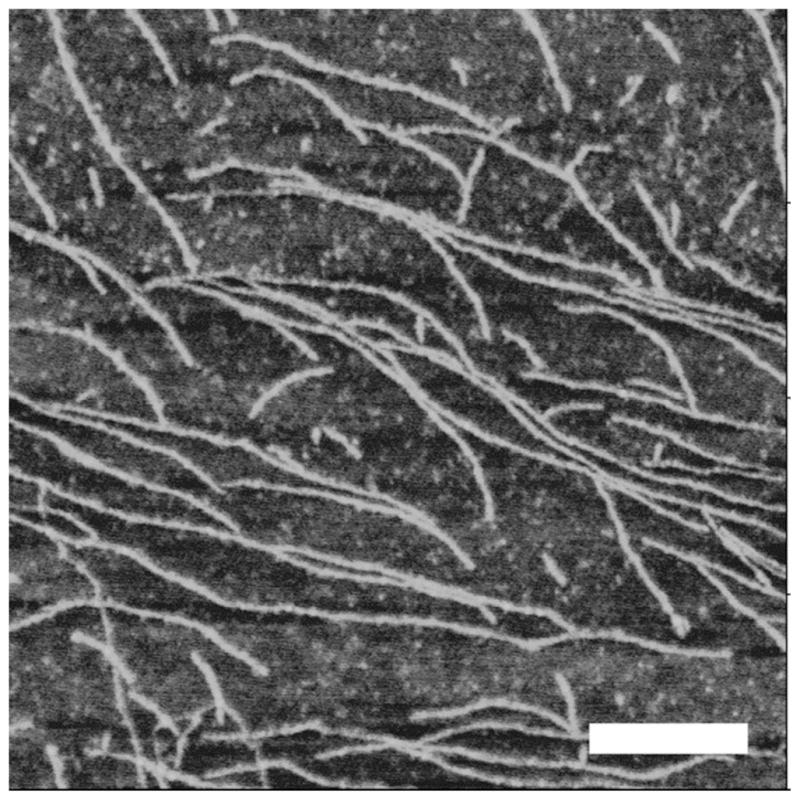
Characterization of Aβ (13-23) fibril by AFM. 100 μM Aβ (13-23) was incubated for 24 hours at 37 °C and the fibrils were imaged by AFM. The mean height of the fibril was 0.6520 ± 0.0484 nm. The white scale bar is 200 nm.
To characterize interactions during the initial stage of self-assembly process, we applied an AFM force spectroscopy approach in which the peptide molecules are immobilized on the AFM tips and on the mica surface (Figure 2a) at the N-terminal Cys residues via long flexible polymeric tethers to facilitate proper orientation of the peptides at the approach stage. The flexible tether with a Gauss-distributed random coil conformation allows the tethered peptides to find the optimal orientation. The ends of the tether move independently from each other eliminating potential restriction of the mobility of the peptide attached at one end of the tether relative to the another end attached to the surface. The ability of the peptide to form a dimer was characterized by measuring the strength of inter-peptide interaction in multiple approach-retraction cycles (see review in ref. 19 and references therein). A typical force curve illustrating the rupture event, indicated with an arrow, is shown in Fig. 2b. The extension of the tether is approximated by the worm-like chain model19 shown in the figure as a black line. The ΔF value in this figure corresponds to the force required for the rupture of the peptide dimer. The probing was performed over various positions on the AFM substrate and the results of such multiple measurements are assembled as a histogram shown as inset in Figure 2b. The distribution has a single peak suggesting a single molecule detection of inter-peptide interactions and, thus, the strength of the interactions in dimers formed by the peptides at the approach step is measured.
Figure 2.

Single molecular force spectroscopy. (a) Schematics of the experimental setup. The peptide was immobilized on AFM tips and mica surfaces through N-terminal cysteine. Bifunctional PEG (about 77 PEG repeats, long linker) was used to attach the peptides to mica surface. MAS (5 repeats of PEG, short linker) was utilized to connect peptides to AFM tips. (b) A typical force curve illustrating the rupture event force curves (grey line) recorded at pH 6 with 500 nm/s pulling rate, black line is from the worm-like chain model fitting19; the insert figure shows distribution of rupture force (bar) and fitting results with probability function (line). The mean value of force was 48.62 ± 8.38 pN. (c) The DFS analysis for Aβ (13-23) acquired at pH 2. Forces obtained from different pulling rates are plotted against logarithmic apparent loading rates (ALR). Seven ALR values were used to generate the plot. Each data point is an average of three independent experiments. The data set was approximated by the Bell-Evans model as described in reference 25. The intercept on the x-axis was used for the calculation of the off-rate constant producing the lifetime value of 1.06 ± 0.95 s. The large variance of this value is due to a logarithmic dependence of the off-rate constant value on the experimentally determined intercept value.
To characterize the stability of Aβ(13–23) dimers, the dynamic force spectroscopy (DFS) method was applied. In this approach, the probing is performed at different pulling rates (103 pN s−1–105 pN s−1) and after the extrapolation of the data to the zero pulling rate the off-rate constant is determined (see ref.19 and references therein). The results of the DFS analysis for Aβ(13-23) are shown in Figure 2c. The experimental data fitted to a straight line and the intercept value for this plot provide the value for the off-rate constant 0.94 ± 0.84 s−1 or 1.06 ± 0.95 s for the dimer lifetime. A similar approach applied to Aβ40 peptide and α-synuclein led to values for the lifetimes in the same range, suggesting that this incredibly long lifetime for transient dimers is a general phenomenon for amyloid proteins19.
MD simulations: The structure of monomer
Conformational properties of Aβ(13-23) both in monomeric and dimeric forms was studied by MD simulations. First, the structural dynamics of the peptide in monomeric form was studied using three different initial structures (Figure 3a). Initial structures for I, II and III are essentially random meander, α-helix and fully extended β-sheet conformation, respectively. Central structures (Figure 3b) of the largest cluster of structures from the 200 ns trajectories adopt different conformations from those of the starting structures and are rather similar (Supplementary Figure S1). Intra-molecular interactions, such as hydrogen bonds (yellow dotted lines) between His14- Leu17 and Gln15 - Val18 in structure III, are formed to stabilize a β-turn structure (Figure 3b).
The similarities between the conformational spaces that the peptide explores in the three independent simulations is further supported by the high root mean square inner product (RMSIP) values for the first 10 eigenvectors of simulations I – III (Supplementary Table S1). The DSSP analysis39 (Supplementary Figure S2) reveals that the peptide structure is flexible and assumes various conformations, but in each trajectory, similar conformational space is explored as shown by the Ramachandran plots (Supplementary Figure S3). The Radius of gyration (Rg) and root mean square deviation (RMSD) (Supplementary Figures. S4 and S5, respectively) indicate that the peptide has flexible conformations and follows a different folding-unfolding path. Rg (Supplementary Figure S4) demonstrates that geometrically compact structures with average Rg ≈ 0.62 nm are formed during each simulation. The mean RMSD value for simI and simII are ~ 0.4 nm, while ~ 0.8 nm for simIII (Supplementary Figure S5). The high RMSD values show that the peptide assumes substantially different conformations from those of the initial structures.
Overall, the MD simulations show that the structure of Aβ(13-23) is flexible in aqueous solution in monomeric form and residues 4–9 are in the turn/bend conformation. Regardless of the different initial configurations, all initial structures eventually converge to a conformation in which residues 4–9 form a turn. Furthermore, during simulations, the peptide did not adopt a fully extended β-sheet type conformation.
MD simulation of the structure of dimer
Next, we considered how the conformation of the peptide changes when it interacts with another peptide chain. We selected the central structure of the largest cluster of simIII (Figure 3b) and placed monomers A and B in a parallel arrangement so that the minimal distance between the two chains was ≥ 1.5 nm. To follow the relative orientation of the two monomers, the distance between the center of mass of Cys13 of monomer A (COM13A) and center of mass of Cys13 of monomer B (COM13B) was plotted for the 400 ns MD simulation (Figure 4). During the initial 50 ns period, the distance fluctuates at 1.5 nm and the peptide chains retain their initial conformations (structures 1 and 2 on Figure 4a; and Supplementary Figure S6). Between 50 ns and 200 ns, the two Cys residue approach and the distance between COM13A and COM13B fluctuates at 0.5 nm. The secondary structure of the two chains resembles that of the initial and is more stable than it was during the simulations of the monomer (Supplementary Figures S2 and S6). Between 200 ns and 300 ns the two monomers move apart and their orientation changes to antiparallel (structures 4 and 5 on Figure 4a). After 350 ns, this rearrangement results in the formation of a stable antiparallel β-sheet conformation (structures 6 on Figure 4a; Supplementary Figure S6). The structural transition of the dimer is further demonstrated during the synchronous change of the distance between COM13A and COM13B by a sudden increase and decrease of the radius of gyration (Supplementary Figure S7). Changes in inter-molecular interactions closely follow the structural transitions and the formation of antiparallel β-sheet conformation results in the lowest interaction energy state (Figure 4b). The central backbone structure of the largest cluster of the last 50 ns of the MD simulation is shown in Figure 4c. Thus, the intermolecular interactions of monomers triggered conformational changes within the individual peptide chain which lead to the formation of the antiparallel β-sheet structure.
Figure 4.

Evolution of the distance between the center of mass of Cys13 of chain A and the center of mass of Cys13 of chain B in during the 400 ns MD simulation of the dimer structure. Snapshots of the dimer backbone structures from the trajectory are placed inside the plot. (a) 1, 0 ns; 2, 20 ns; 3, 97.9 ns; 4, 221 ns; 5, 300 ns; 6, 359 ns. Backbone conformation of the peptide chain is as follows: cyan is random meander; yellow is 310-helix; green is β-turn/bend, red arrow is β-sheet and H-bonds are yellow dotted lines. N and C indicate the N-and C-termini, respectively. (b) Inter-molecular interactions (Eint) during the 400 ns MD simulation of the dimer structure. The grey line shows Eint at every 10 ps, the black line is the running average at 5 ns intervals. (c) Antiparallel backbone structure of the central structure of the largest cluster of the last 50 ns of the MD simulation. In chain A the backbone carbon atoms are in green. H-bonds are yellow dotted lines. N and C indicate the N-and C-termini, respectively.
The MD results provide insight to the interactions which stabilize the structure of the dimer. During the first 200 ns of the simulation, the monomers within the dimer are held together by hydrophobic interactions, by hydrogen bonds between Phe19 of monomer A and Gln15 of monomer B, between the two Cys residues (Supplementary Figure S8), and by aromatic-aromatic (Ar-Ar) interaction between Phe19 of monomer A and Phe20 of monomer B (Supplementary Figure S9a). Later (320 ns), the antiparallel β-sheet conformation is formed and stabilized by four hydrogen bonds between residues His14 of monomer A and Phe19 of monomer B and between Lys16 of monomer A and Leu17 of monomer B (Figure 4c). Additional stabilization is provided by a salt bridges between Lys16 of monomer A and Asp23 of monomer B, between His14 of monomer A and Glu22 of monomer B, an aromatic-backbone (Ar-bb) interaction between Phe19 of monomer B and the backbone of His14 and Gln15 of monomer A (data not shown), and an aromatic-CH (Ar-CH) interaction between Phe19 of monomer B and CβH groups of His14 of monomer A (Supplementary Figure S9b). The change from Ar-Ar interaction to Ar-CH interaction coincides with the switching of the orientations of monomers from parallel to antiparallel (Figure 4 and Supplementary Figure S9).
Steered MD simulation of the force-induced rupture of the dimer
To analyze the stability of the structure of the dimer, we used SMD simulation to examine the force-induced dissociation of the dimer. The dimer was pulled apart by applying external forces to the center of mass of Cys13 of monomer A at a constant rate 5 nm/ns (Figure 5a). This led to the clear rupture event characterized by the force curves (Figure 5b and c). The force-distance curve (Figure 5c) shows that the rupture event occurred at 2.6 nm distance between the center of mass of the two Cys residues, corresponding to a force of ~ 1000 pN.
Figure 6 shows the force-induced dissociation pathways of the dimer. The initial segment of the force curve prior to the rupture event (0 ns – 0.48 ns, 0 – 2.6 nm in Figure 5b and c) corresponds to change in orientation of the dimer (models 1 to 3 in Figure 6a) and loosing inter-peptide H-bonds (Figure 6b). The major peak of the force curve in Figure 5 corresponds to the cooperative rupture of H-bonds in the time scale between 0.48 ns and 0.49 ns (models 2 to 4 in Figure 6a). From that point, chains of both monomers A and B slide past each other along the direction of the applied force. At 0.54 ns (model 6 on Figure 6c; 3.1 nm distance between the center of mass of the Cys residues in Figure 5c) the salt bridge between His14 of monomer A and Glu22 of monomer B ruptures (data not shown). However, the salt bridge between Lys16 of monomer A and Asp23 of monomer B exists for much longer and essentially this is the last inter-peptide interaction that breaks. Models in Figure 6c illustrate this process and the time-dependent changes in the distance between the centers-of-mass of εNH3+ of Lys16 of monomer A and βCOO- of Asp23 of monomer B (Figure 6d). Figures 6e and f show the time-dependent variation of the dimer structure with focus on the aromatic interactions. Snapshots of various structures along the force curve are shown in Figure 6e and the graph illustrating the increase in the distance between the CβH group of His14 of monomer A and the center of the phenyl ring of Phe19 of monomer B is shown in Figure 6f. The rupture of this interaction corresponds to the minor peak between 0.6 and 0.7 ns on the force curve (Figure 5b).
Figure 6.

Force-induced dissociation pathway of the dimer structure during SMD simulation (5 nm/ns pulling rate). The snapshots of dimer structure are from 1, 0.2 ns; 2, 0.48 ns; 3, 0.49 ns; 4, 0.5 ns; 5, 0.54 ns; 6, 0.6 ns; 7, 0.7 ns; 8, 0.9 ns and 9, 1.2 ns of the SMD trajectory. The numbers correspond to the position numbers shown in Figure 5b. (a) H-bond breaking. Red arrow indicates β–sheet structure and H-bonds are yellow dotted lines. N and C indicate the N- and C-terminal ends, respectively. (b) Changes in the number of inter-chain H-bonds. (c) Force induced dissociation of the inter-chain salt bridge between Lys16 of chain A and Asp23 of chain B. (d) Distance between the center-of-masses of εNH3+ of Lys16 of chain A and βCOO- of Asp23 of chain B groups. (e) Weakly polar interaction between side chain of Phe19 of chain B and side chain of His14 of chain A. (f) Distance between the CβH group of His14 of chain A and the center of the phenyl ring of Phe19 of chain B.
In an additional SMD simulation, the dimer was the central structure of the largest cluster from the first 200 ns of the trajectory (structure 3 in Figure 4a). In this dimer, the chains have β-turn/bend conformations in a parallel orientation (Supplementary Figure S10a). The force curve (Supplementary Figure S10b) did not show a single characteristic rupture event. This further indicates that in AFM experiments the dimer is in antiparallel β-sheet conformation.
Energetics of the dimer rupture: Umbrella sampling simulations
We used umbrella sampling simulations51–53 to determine the one-dimensional Potential of Mean Force (PMF) curve along the ξ reaction coordinate and to calculate the free energy of binding (ΔGbindA,B) between monomers (Figure 7). The umbrella histrograms and PMF curve (Figure 7) were obtained using the method of Weighted Histogram Analysis (WHAM)54–56. At large distance between COM13A and COM13B (ξ > 5nm) the PMF curve is flat and it was selected as the zero reference point. At 2.6 nm ≤ ξ ≤ 2.9 nm region the PMF curve is flat and it corresponds the main rupture event (See Figure 5b and c). Therefore, the main rupture is accompanied by ΔG1bindA,B= −49.52 kJ/mol and the subsequent dimer dissociation has ΔG2bindA,B= −35.93 kJ/mol changes. ΔG1bindA,B corresponds to breaking of H-bonds and salt bridge between His14 of monomer A and Glu22 of monomer B. Whereas, ΔG2bindA,B is the free energy change associated with the breaking of weakly polar interactions and a salt bridge between Lys16 of monomer A and Asp23 of monomer B. Overall, a ΔGbindA,B of −85.45 kJ/mol suggests that the interaction between the monomers in the dimer is strong. The uneven distribution of the umbrella histograms at 2.0 nm ≤ ξ ≤ 3.0 nm indicates that during the SMD simulation, before and after the major rupture peak the number of inter-chain interactions in neighboring umbrella windows vary substantially and change quickly, so the probability of configuration exchange between the windows is low.
Figure 7.
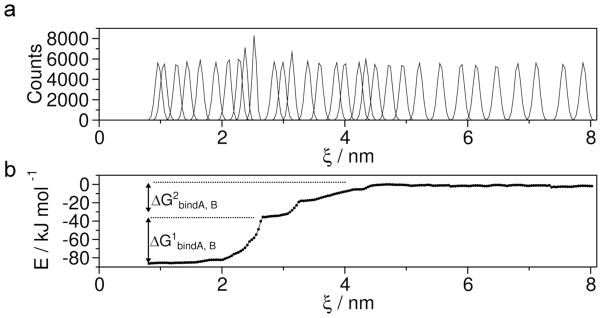
WHAM analysis of the umbrella sampling simulation. (a) Converged umbrella histograms of 31 configurations, each derived from 20 ns simulation. (b) Potential of mean force (PMF). ΔG1bindA,B corresponds to H-bonds and salt bridge breaking and ΔG2bindA,B is associated with the breaking of weakly polar interactions and a salt bridge.
DISCUSSION
In our recent model of amyloid aggregation, the misfolded state of amyloid proteins, including Aβ-peptides, is stabilized by the formation of dimers19. The model supported by the AFM force spectroscopy studies demonstrates that the dimers are characterized by lifetimes as large as seconds. However, the structure and mechanism of formation of misfolded dimers remained unclear. In this work we showed that isolated monomers had characteristic conformational features that differ from those of in aggregated or fiber state. However, substantial changes in the peptide structure were observed when the two monomers interacted to form a dimer. The formation of an antiparallel β sheets was detected after a series of conformational transitions within each monomer (Figure 4). The dimer is only stable when the two monomers are in antiparallel orientation. Steered MD simulation showed that individual peptide chains under the applied force undergo a structural transition which is accompanied by sharp rupture of the dimer. This is in agreement with AFM experiments.
Structure and dynamics of the peptide
On the basis of earlier MD simulations, the conformations of short Aβ fragments were considered to be in random coil57,58 or polyproline II structures59,60. For Aβ (1–28) it was shown that residues 13–21 have a high propensity for α-helical conformations in the monomeric state12. During our monomer simulations, Aβ (13–23) initially assumed a 310-helix conformation at residues 14–17 and then converted to a β-turn/bend and random meander conformations. Since the sequence of the peptide here is shorter than in the work of Rojas and associates12, a stable helical conformation is not expected, but rather, a flexible structure that inter-converts between different conformational types. The three different initial conformations for the peptide were selected from known experimental amyloid β structures and over time all three converged to similar conformations. In the antiparallel β-sheet structure, the N-terminal Cys residue neither formed any intra-molecular interactions nor participated in formation of any secondary structures and, therefore, was an appropriate anchoring group for the AFM experiments.
During REMD simulations of the structure of Aβ (16–22) dimer by Gnanakaran and associates, six different low energy structures occurred between 275 K and 510 K60. The individual chains did not prefer any particular secondary structure and both parallel and antiparallel orientations occurred. In our dimer simulation, initially the conformations of the monomers and the structures of the dimer were similar to those observed by Gnanakaran and associates60. As the simulation proceeded, after several structural transitions, the dimer assumed a stable antiparallel β-sheet structure. Furthermore, during two additional long-time simulations of the dimer structure, using two different force fields, a stable antiparallel β-sheet structure was also observed (see Supplementary Material and Supplementary Figures S11-S13). The stability could be due to the longer chain length and to the presence of His14 which was shown to be important for aggregation61. Here we showed that His14 forms an inter-chain weakly polar ArCH interaction that stabilizes the dimer (Figures. 6e and f and Supplementary Figure S9b). The aggregation of Aβ(16–22) was studied in trimer form using relatively short (10 ns) MD simulation57. The stable association of the chains was accompanied by a conformational transition of the individual chains from a β-turn to β-strand structure. The oligomer did not have the antiparallel β-sheet structure, most likely due to the short simulation time. Nguyen and associates, using 50 ns REMD simulations74, showed that the free energy landscape of the dimer of Aβ(16–22) is complex and only 25% of the total population have the antiparallel β-sheet structure, which is again most likely due to the short length of the peptide. REMD simulations of dimerization of Aβ(11–25) at three different pH values revealed a dynamic interplay between hydrophobic, electrostatic and solvation intertactions75. At pH 8.4, the free energy landscape for the peptide is complex, although, most of the low energy structures are in antiparallel β-sheet conformation. Here we also observed that the dimer has dynamic structure but can form stable antiparallel β-sheet conformation.
The dimer has dynamic structure and typically 4–5 Hbonds are present during simulations. Nevertheless, after the antiparallel β-sheet structure was formed, it was not disrupted until the end of the simulation. Furthermore, to follow the AFM conditions, the ionization state of the side chains, were set as at pH7, and only the Lys residues were protonated. Subsequently, the dimer was further stabilized by ionic interaction between Lys16 of chain A and Asp23 of chain B. Weakly polar interactions could substantially stabilize polypeptide structure because their strength can be as strong as that of H-bonds62–66. Here, we observed Ar-bb interaction between Phe19 of chain B and the backbone of His14-Gln15 of chain A and an ArCH interaction between Phe19 of chain B and CβH groups of His14 of chain A. These interactions clearly contributed to the stabilization of the antiparallel β-sheet structure of the dimer.
Stability of the dimer
The stability of preformed Aβ dimers and fibrils was studied by pulling the center of mass of one chain and keep the rest of the complex constrained67,68. Here, we used a different approach to closely mimic the experimental AFM procedure. Residue 13 of the peptide was replaced with Cys and only the position of Cys13 of chain B was constrained while Cys13 of chain A was pulled and the rest of the peptide chains were flexible. Subsequently, the main force-peak of SMD simulation, where the antiparallel β-sheet breaks up, corresponds to the rupture peak in force spectroscopy (Compare Figures. 2 and 5). If the structure were not be an antiparallel β-sheet, the force curve from SMD simulation would be different from that from force spectroscopy. When a pulling simulation was performed on a dimer with β-turn and random meander structures the force curve was at the noise level of the SMD simulation of the antiparallel β-sheet structure (Supplementary Figure S10) clearly indicating that, during AFM experiments, the antiparallel β-sheet dimer dissociates.
Our umbrella sampling simulations further indicate that the peptide forms a stable dimer which dissociates in two steps by showing a plateau on the free energy curve at a ΔG1bindA,B of −49.52 kJ/mol (Supplementary Figure 7). A similar transient plateau was observed by Mothana and associates67, although, they overestimated the value of ΔGbind by its calculation from only a single MD simulation. The large value of the overall free energy of binding (ΔGbindA,B= −85.45 kJ/mol) indicates that a stable dimer is formed. This is further supported by the AFM experimental off-rate constant of 0.94 ± 0.84 s−1 for the lifetime of the dimer. The data clearly indicate that oligomerization of Aβ is initiated by formation of stable dimers.
Molecular model for Aβ aggregation
MD simulations of process of Aβ peptides showed that monomers can adjust their conformation following docking to the pre-structured oligomer12,58 and this process leads to elongation of the oligomer that eventually may lead to the formation of protofibrils. The mechanism of the formation of oligomers, however, remains unclear. Our studies fill this gap and lead to a model for the oligomerization. The AFM force spectroscopy data demonstrate that as the monomers approach the dimers are formed. The contact time is in the range of seconds. Since MD simulations show that the time for the formation of stable dimers is much shorter, ~300 ns, the experimental conditions provide sufficient time for the formation of dimers during the AFM force spectroscopy. The peptides in the dimer form antiparallel β sheet conformation and this conformation is similar to the conformation in fibrils of Aβ (14–23)69, suggesting that the process of formation of dimers modeled here is the first step in the aggregation of the peptide.
Previously we proposed that the fibrils are assembled from dimers19. The evidence for this model was the long liftime of dimers. Recent experimental data for the kinetics of oligomerization of Aβ peptides agree with this model16,17. The assembly monomers into dimers observed in this study and the docking of monomers to the preassembled oligomers70,71,72 occur in nanoseconds, suggesting that the finding of partners is the time-limiting step of the oligomerization process.
The β sheet structure of the dimer found in our MD simulations on average has four hydrogen bonds. This is agreement with the solid state NMR structure of Aβ(14-23) fibers69. In additional simulations (see Supplementary Material and Supplementary Figures S13a–b), a longer β-sheet structure was formed and stabilized by on average seven hydrogen bonds. However, for Aβ(1-40) it is possible that the β sheet structure in the same region of residues with four to seven hydrogen bonds is transient and gradually can be transformed into longer β sheet structures. If this does not happen within the Aβ dimer, the formation of higher order oligomers can stimulate this conformational transition. Furthermore, the monomers in Aβ(1-40) and Aβ(1–42) fibers are in parallel orientation35,73 but the orientation in dimers or higher order of oligomers remains to be determined. On the basis of our present data and recent publications76–80, it is possible that Aβ dimers are in antiparallel orientation and subsequent docking of monomers to dimers triggers an overall chain reorientation leading to fiber formation. Testing this mechanism is in progress.
Conclusions
In this study, AFM and MD simulations are synergistically used to characterize the mechanism of misfolding and dimer formation of Aβ(13-23). Dynamic force spectroscopy analysis showed that the dimeric complex formed by the peptide is stable and dissociate typically in seconds. During MD simulations, isolated monomers gradually adopted characteristic conformational states forming a native ensemble that differed significantly from those of in dimers or fiber state. When two monomers formed a dimer their structure changed substantially and adopted an antiparallel β-sheet conformation. Conformational spaces of the monomers become restricted due to inter-chain interactions including hydrogen bonds, salt bridges and weakly polar interactions of side chains. Under the applied force, the dimer, as during the AFM experiments, dissociated in a cooperative manner. Thus, misfolding of the Aβ peptide proceeds via floss of conformational flexibility and formation of stable dimers suggesting their key role in Aβ aggregation process.
Supplementary Material
Acknowledgments
The work was supported in part by NIH grants 5P20RR016469 and 8P20GM103427 to SL and DE-FG02-08ER64579 (DOE), 1 R01 GM096039-01A1 (NIH), EPS– 004094 (NSF) grants to YLL. The authors thank to Gergely Toth for helpful discussion.
Footnotes
Supporting Information Available
Table with RMSIP values for monomer simulations. Additional figures for analyses of monomer simulations. Additional figures for analyses of dimer simulations. Detailed method for additional dimer simulations. Figures for analyses of additional dimer simulations. This information is available free of charge via the Internet at http://pubs.acs.org.
References
- 1.Dobson CM. Principles of protein folding, misfolding and aggregation. Semin Cell Dev Biol. 2004;15:3–16. doi: 10.1016/j.semcdb.2003.12.008. [DOI] [PubMed] [Google Scholar]
- 2.Madine J, Jack E, Stockley PG, Radford SE, Serpell LC, Middleton DA. Structural Insights into the Polymorphism of Amyloid-Like Fibrils Formed by Region 20–29 of Amylin Revealed by Solid-State NMR and X-ray Fiber Diffraction. J Am Chem Soc. 2008;130:14990–15001. doi: 10.1021/ja802483d. [DOI] [PubMed] [Google Scholar]
- 3.Lynn DG, Meredith SC. Review: Model Peptides and the Physicochemical Approach to β-Amyloids. J Struct Biol. 2000;130:153–173. doi: 10.1006/jsbi.2000.4287. [DOI] [PubMed] [Google Scholar]
- 4.Fernandez-Busquets X, de Groot NS, Fernandez D, Venture S. Recent Structural and Computational Insights Into Conformational Diseases. Curr Med Chem. 2008;15:1336–1349. doi: 10.2174/092986708784534938. [DOI] [PubMed] [Google Scholar]
- 5.Munishkina LA, Fink AL. Fluorescence as a Method to Reveal Structures and Membrane-Interactions of Amyloidogenic Proteins. Biochim Biophys Acta. 2007;1768:1862–1885. doi: 10.1016/j.bbamem.2007.03.015. [DOI] [PubMed] [Google Scholar]
- 6.Petkova AT, Ishii Y, Balbach JJ, Antzutkin ON, Leapman RD, Delaglio F, Tycko R. A Structural Model for Alzheimer’s β-amyloid Fibrils Based on Experimental Constraints from Solid State NMR. Proc Natl Acad Sci US A. 2002;99:16742–16747. doi: 10.1073/pnas.262663499. [DOI] [PMC free article] [PubMed] [Google Scholar]
- 7.Balbach JJ, Petkova AT, Oyler NA, Antzutkin ON, Gordon DJ, Meredith SC, Tycko R. Supramolecular Structure in Full-Length Alzheimer’s β-Amyloid Fibrils: Evidence for a Parallel β-Sheet Organization from Solid-State Nuclear Magnetic Resonance. Biophys J. 2002;83:1205–1216. doi: 10.1016/S0006-3495(02)75244-2. [DOI] [PMC free article] [PubMed] [Google Scholar]
- 8.Petkova AT, Buntkowsky G, Dyda F, Leapman RD, Yau WM, Tycko R. Solid State NMR Reveals a pH-dependent Antiparallel β-Sheet Registry in Fibrils Formed by a β-Amyloid Peptide. J Mol Biol. 2004;335:247–260. doi: 10.1016/j.jmb.2003.10.044. [DOI] [PubMed] [Google Scholar]
- 9.Klimov DK, Thirumalai D. Dissecting the Assembly of Aβ16–22 Amyloid Peptides into Antiparallel β Sheets. Structure. 2003;11:295–307. doi: 10.1016/s0969-2126(03)00031-5. [DOI] [PubMed] [Google Scholar]
- 10.Nguyen PH, Li MS, Stock G, Straub JE, Thirumalai D. Monomer adds to preformed structured oligomers of Aβ-peptides by a two-stage dock–lock mechanism. Proc Natl Acad Sci US A. 2007;104:111–116. doi: 10.1073/pnas.0607440104. [DOI] [PMC free article] [PubMed] [Google Scholar]
- 11.Gnanakaran S, Nussinov R, Garcia AE. Atomic-Level Description of Amyloid β-Dimer Formation. J Am Chem Soc. 2006;128:2158–2159. doi: 10.1021/ja0548337. [DOI] [PubMed] [Google Scholar]
- 12.Rojas AV, Liwo A, Scheraga HA. A Study of the α-Helical Intermediate Preceding the Aggregation of the Amino-Terminal Fragment of the β Amyloid Peptide (Aβ1–28) J Phys Chem B. 2011;115:12978–12983. doi: 10.1021/jp2050993. [DOI] [PMC free article] [PubMed] [Google Scholar]
- 13.Yankner BA, Lu T. Amyloid β-Protein Toxicity and the Pathogenesis of Alzheimer Disease. J Biol Chem. 2009;284:4755–4759. doi: 10.1074/jbc.R800018200. [DOI] [PMC free article] [PubMed] [Google Scholar]
- 14.Li S, Shankar GM, Selkoe D. How Do Soluble Oligomers of Amyloid Beta-protein Impair Hippocampal Synaptic Plasticity? Front Cell Neurosci. 2010;4:1–2. doi: 10.3389/fncel.2010.00005. [DOI] [PMC free article] [PubMed] [Google Scholar]
- 15.Li S, Hong S, Shepardson NE, Walsh DM, Shankar GM, Selkoe D. Soluble Oligomers of Amyloid β Protein Facilitate Hippocampal Long-Term Depression by Disrupting Neuronal Glutamate Uptake. Neuron. 2009;62:788–801. doi: 10.1016/j.neuron.2009.05.012. [DOI] [PMC free article] [PubMed] [Google Scholar]
- 16.Bernstein SL, Dupuis NF, Lazo ND, Wyttenbach T, Condron MM, Bitan G, Teplow DB, Shea JE, Ruotolo BT, Robinson CV, Bowers MT. Amyloid-β Protein Oligomerization and the Importance of Tetramers and Dodecamers in the Eetiology of Alzheimer’s Disease. Nat Chem. 2009;1:326–331. doi: 10.1038/nchem.247. [DOI] [PMC free article] [PubMed] [Google Scholar]
- 17.He X, Giurleo JT, Talaga DS. Role of Small Oligomers on the Amyloidogenic Aggregation Free-Energy Landscape. J Mol Biol. 2010;395:134–154. doi: 10.1016/j.jmb.2009.10.019. [DOI] [PMC free article] [PubMed] [Google Scholar]
- 18.Jin M, Shepardson N, Yang T, Chen G, Walsh D, Selkoe DJ. Soluble Amyloid Beta-protein Dimers Isolated from Alzheimer Cortex Directly Induce Tau Hyperphosphorylation and Neuritic Degeneration. Proc Natl Acad Sci US A. 2011;108:5819–5824. doi: 10.1073/pnas.1017033108. [DOI] [PMC free article] [PubMed] [Google Scholar]
- 19.Lyubchenko YL, Kim BH, Krasnoslobodtsev AV, Yu J. Nanoimaging for Protein Misfolding Diseases. Wiley Interdiscip Rev Nanomed Nanobiotechnol. 2010;2:526–543. doi: 10.1002/wnan.102. [DOI] [PubMed] [Google Scholar]
- 20.McAllister C, Karymov MA, Kawano Y, Lushnikov AY, Mikheikin A, Uversky VN, Lyubchenko YL. Protein Interactions and Misfolding Analyzed by AFM Force Spectroscopy. J Mol Biol. 2005;354:1028–1042. doi: 10.1016/j.jmb.2005.10.012. [DOI] [PubMed] [Google Scholar]
- 21.Lyubchenko YL, Sherman S, Shlyakhtenko LS, Uversky VN. Nanoimaging for Protein Misfolding and Related Diseases. J Cell Biochem. 2006;99:52–70. doi: 10.1002/jcb.20989. [DOI] [PMC free article] [PubMed] [Google Scholar]
- 22.Evans E. Probing the Relation Between Force-Lifetime and Chemistry in Single Molecular Bonds. Annu Rev Biophys Biomol Struct. 2001;30:105–128. doi: 10.1146/annurev.biophys.30.1.105. [DOI] [PubMed] [Google Scholar]
- 23.Yu J, Malkova S, Lyubchenko YL. Alpha-Synuclein Misfolding: Single Molecule AFM Force Spectroscopy Study. J Mol Biol. 2008;384:992–1001. doi: 10.1016/j.jmb.2008.10.006. [DOI] [PubMed] [Google Scholar]
- 24.Yu J, Lyubchenko YL. Early Stages for Parkinson’s Sevelopment: Alpha-Synuclein Misfolding and Aggregation. J Neuroimmune Pharmacol. 2009;4:10–16. doi: 10.1007/s11481-008-9115-5. [DOI] [PubMed] [Google Scholar]
- 25.Kim BH, Palermo NY, Lovas S, Zaikova T, Keana JF, Lyubchenko YL. Single-Molecule Atomic Force Microscopy Force Spectroscopy Study of Abeta-40 Interactions. Biochemistry. 2011;50:5154–5162. doi: 10.1021/bi200147a. [DOI] [PMC free article] [PubMed] [Google Scholar]
- 26.Santini S, Wei G, Mousseau N, Derreumaux P. Pathway Complexity of Alzheimer’s beta-Amyloid Abeta16–22 Peptide Assembly. Structure. 2004;12:1245–1255. doi: 10.1016/j.str.2004.04.018. [DOI] [PubMed] [Google Scholar]
- 27.Balbach JJ, Ishii Y, Antzutkin ON, Leapman RD, Rizzo NW, Dyda F, Reed J, Tycko R. Amyloid Fibril Formation by Aβ16-22, a Seven-Residue Fragment of the Alzheimer’s β-Amyloid Peptide, and Structural Characterization by Solid State NMR. Biochemistry. 2000;39:13748–13759. doi: 10.1021/bi0011330. [DOI] [PubMed] [Google Scholar]
- 28.Hess B, Kutzner C, van der Spoel D, Lindahl E. GROMACS 4: Algorithms for Highly Efficient, Load-Balanced, and Scalable Molecular Simulation. J Chem Theory Comput. 2008;4:435–447. doi: 10.1021/ct700301q. [DOI] [PubMed] [Google Scholar]
- 29.Hatfield MPD, Murphy RF, Lovas S. Molecular Dynamics Analysis of the Conformations of a Beta-Hairpin Miniprotein. J Phys Chem B. 2010;114:3028–3037. doi: 10.1021/jp910465e. [DOI] [PMC free article] [PubMed] [Google Scholar]
- 30.Hatfield MPD, Murphy RF, Lovas S. VCD Spectroscopic Properties of the β-Hairpin Forming Miniprotein CLN025 in Various Solvents. Biopolymers. 2010;93:442–450. doi: 10.1002/bip.21356. [DOI] [PMC free article] [PubMed] [Google Scholar]
- 31.Kaminski GA, Friesner RA, Tirado-Rives J, Jorgensen WL. Evaluation and Reparametrization of the OPLS-AA Force Field for Proteins via Comparison with Accurate Quantum Chemical Calculations on Peptides. J Phys Chem B. 2001;105:6474–6487. [Google Scholar]
- 32.Berman HM, Westbrook J, Feng Z, Gilliland G, Bhat TN, Weissig H, Shindyalov IN, Bourne PE. The Protein Data Bank. Nucleic Acids Research. 2000;28:235–242. doi: 10.1093/nar/28.1.235. [DOI] [PMC free article] [PubMed] [Google Scholar]
- 33.Zhang S, Iwata K, Lachenmann MJ, Peng JW, Li S, Stimson ER, Lu Ya, Felix AM, Maggio JE, Lee JP. The Alzheimer’s Peptide Aβ Adopts a Collapsed Coil Structure in Water. J Struct Biol. 2000;130:130–141. doi: 10.1006/jsbi.2000.4288. [DOI] [PubMed] [Google Scholar]
- 34.Tomaselli S, Esposito V, Vangone P, van Nuland NAJ, Bonvin AMJJ, Guerrini R, Tancredi T, Temussi PA, Picone D. The α-to-β Conformational Transition of Alzheimer’s Aβ-(1–42) Peptide in Aqueous Media is Reversible: A Step by Step Conformational Analysis Suggests the Location of β Conformation Seeding. ChemBioChem. 2006;7:257–267. doi: 10.1002/cbic.200500223. [DOI] [PubMed] [Google Scholar]
- 35.Petkova AT, Yau WM, Tycko R. Experimental Constraints on Quaternary Structure in Alzheimer’s Beta-Amyloid Fibrils. Biochemistry. 2006;45:498–512. doi: 10.1021/bi051952q. [DOI] [PMC free article] [PubMed] [Google Scholar]
- 36.Jorgensen WL, Madura JD. Temperature and Size Dependence for Monte Carlo Simulations of TIP4P Water. Mol Phys. 1985;56:1381–1392. [Google Scholar]
- 37.Hess B, Bekker H, Berendsen HJC, Fraaije JGEM. LINCS: A Linear Constraint Solver for Molecular Simulations. J Comput Chem. 1997;18:1463–1472. [Google Scholar]
- 38.Berendsen HJC, Postma JPM, van Gunsteren WF, DiNola A, Haak JR. Molecular Dynamics with Coupling to an External Bath. J Chem Phys. 1984;81:3684–3690. [Google Scholar]
- 39.Kabsch W, Sander C. Dictionary of Protein Secondary Structure: Pattern Recognition of Hydrogen-Bonded and Geometrical Features. Biopolymers. 1983;22:2577–2637. doi: 10.1002/bip.360221211. [DOI] [PubMed] [Google Scholar]
- 40.R Core Team. R: A Language and Environment for Statistical computing. R Foundation for Statistical Computing; Vienna, Austria: 2011. [Google Scholar]
- 41.Lovell SC, Davis IW, Arendall WB, III, de Bakker PIW, Word JM, Prisant MG, Richardson JS, Richardson DC. Structure Validation by Cα Geometry: φψ, and Cβ Deviation. Proteins. 2003;50:437–450. doi: 10.1002/prot.10286. [DOI] [PubMed] [Google Scholar]
- 42.Daura X, Gademann K, Jaun B, Seebach D, van Gunsteren WF, Mark AE. Peptide Folding: When Simulation Meets Experiment. Angew Chem Int Ed. 1999;38:236–240. [Google Scholar]
- 43.(a) Amadei A, Ceruso MA, Di Nola A. On the Convergence of the Conformational Coordinates Basis Set Obtained by the Essential Dynamics Analysis of Proteins’ Molecular Dynamics Simulations. Proteins. 1999;36:419–424. [PubMed] [Google Scholar]; (b) Hayward S, de Groot BL. Normal Modes and Essential Dynamics. In: Kukol A, editor. Methods in Molecular Biology, vol. 443, Molecular Modeling of Proteins. Humana Press; Totowa, NJ: 2008. pp. 89–106. [DOI] [PubMed] [Google Scholar]
- 44.Humphrey W, Dalke A, Schulten K. VMD: Visual Molecular Dynamics. J Mol Graph. 1996;14:33–38. doi: 10.1016/0263-7855(96)00018-5. [DOI] [PubMed] [Google Scholar]
- 45.Kortvelyesi T, Murphy RF, Lovas S. Secondary Structures and Intramolecular Interactions in Fragments of the B-loops of Naturally Occurring Analogs of Epidermal Growth Factor. J Biomol Struct Dyn. 1999;17:393–407. doi: 10.1080/07391102.1999.10508370. [DOI] [PubMed] [Google Scholar]
- 46.Toth G, Watts CR, Murphy RF, Lovas S. Significance of Aromatic-Backbone Amide Interactions in Protein Structure. Proteins. 2001;43:373–381. doi: 10.1002/prot.1050. [DOI] [PubMed] [Google Scholar]
- 47.Nosé S, Klein ML. Constant Pressure Molecular Dynamics for Molecular Systems. Mol Phys. 1983;50:1055–1076. [Google Scholar]
- 48.Parrinello M, Rahman A. Polymorphic Transitions in Single Crystals: A New Molecular Dynamics Method. J Appl Phy. 1981;52:7182–7190. [Google Scholar]
- 49.Nose S. A Unified Formulation of the Constant Temperature Molecular Dynamics Methods. J Chem Phys. 1984;81:511–519. [Google Scholar]
- 50.Hoover WG. Canonical dynamics: Equilibrium Phase-Space Distributions. Phys Rev A. 1985;31:1695–1697. doi: 10.1103/physreva.31.1695. [DOI] [PubMed] [Google Scholar]
- 51.Patey GN, Valleau JP. The Free Energy of Spheres with Dipoles: Monte Carlo with Multistage Sampling. Chem Phys Lett. 1973;21:297–300. [Google Scholar]
- 52.Torrie GM, Valleau JP. Monte Carlo Free Energy Estimates Using Non-Boltzmann Sampling: Application to the Sub-Critical Lennard-Jones Fluid. Chem Phys Lett. 1974;28:578–581. [Google Scholar]
- 53.Torrie GM, Valleau JP. Nonphysical Sampling Distributions in Monte Carlo Free-Energy Estimation: Umbrella Sampling. J Comput Phys. 1977;23:187–199. [Google Scholar]
- 54.Kumar S, Rosenberg JM, Bouzida D, Swendsen RH, Kollman PA. The Weighted Histogram Analysis Method for Free-Energy Calculations on Biomolecules. I. J Comput Chem. 1992;13:1011–1021. [Google Scholar]
- 55.Jarzynski C. Nonequilibrium Equality for Free Energy Differences. Phys Rev Lett. 1997;78:2690–2693. [Google Scholar]
- 56.Hub JS, de Groot BL, van der Spoel DJ. g_wham —A Free Weighted Histogram Analysis Implementation Including Robust Error and Autocorrelation Estimates. J Chem Theory Comput. 2010;6:3713–3720. [Google Scholar]
- 57.Klimov DK, Thirumalai D. Dissecting the Assembly of Aβ16–22 Amyloid Peptides into Antiparallel β Sheets. Structure. 2003;11:295–307. doi: 10.1016/s0969-2126(03)00031-5. [DOI] [PubMed] [Google Scholar]
- 58.Nguyen PH, Li MS, Stock G, Straub JE, Thirumalai D. Monomer Adds to Preformed Structured Oligomers of Aβ-peptides by a Two-Stage Dock–Lock Mechanism. Proc Natl Acad Sci US A. 2007;104:111–116. doi: 10.1073/pnas.0607440104. [DOI] [PMC free article] [PubMed] [Google Scholar]
- 59.Eker F, Griebenow K, Schweitzer-Stenner R. Aβ1-28 Fragment of the Amyloid Peptide Predominantly Adopts a Polyproline II Conformation in an Acidic Solution. Biochemistry. 2004;43:6893–6898. doi: 10.1021/bi049542+. [DOI] [PubMed] [Google Scholar]
- 60.Gnanakaran S, Nussinov R, García AE. Atomic-Level Description of Amyloid β-Dimer Formation. J Am Chem Soc. 2006;128:2158–2159. doi: 10.1021/ja0548337. [DOI] [PubMed] [Google Scholar]
- 61.Tjernberg LO, Callaway DJ, Tjernberg A, Hahne S, Lilliehöök C, Terenius L, Thyberg J, Nordstedt C. A Molecular Model of Alzheimer Amyloid Beta-Peptide Fibril Formation. J Biol Chem. 1999;274:12619–12625. doi: 10.1074/jbc.274.18.12619. [DOI] [PubMed] [Google Scholar]
- 62.Palermo NY, Csontos J, Owen MC, Murphy RF, Lovas S. Aromatic-Backbone Interactions in Model α-Helical Peptides. J Comput Chem. 2007;28:1208–1214. doi: 10.1002/jcc.20578. [DOI] [PubMed] [Google Scholar]
- 63.Csontos J, Palermo NY, Murphy RF, Lovas S. Calculation of Weakly Polar Interaction Energies in Polypeptides Using Density Functional and Local Møller-Plesset Perturbation Theory. J Comput Chem. 2008;29:1344–1352. doi: 10.1002/jcc.20898. [DOI] [PubMed] [Google Scholar]
- 64.Hatfield MPD, Palermo NY, Csontos J, Murphy RF, Lovas S. Quantum Chemical Quantification of Weakly Polar Interaction Energies in the TC5b Miniprotein. J Phys Chem B. 2008;112:3503–3508. doi: 10.1021/jp077674h. [DOI] [PubMed] [Google Scholar]
- 65.Palermo NY, Csontos J, Murphy RF, Lovas S. Role of Aromatic Residues in Stabilizing the Secondary and Tertiary Structure of Avian Pancreatic Polypeptide. Int J Quantum Chem. 2008;108:814–819. doi: 10.1002/qua.21521. [DOI] [PMC free article] [PubMed] [Google Scholar]
- 66.Hatfield MPD, Murphy RF, Lovas S. The CLN025 Decapeptide Retains a β-Hairpin Conformation in Urea and Guanidinium Chloride. J Phys Chem B. 2011;115:4971–4981. doi: 10.1021/jp111076j. [DOI] [PMC free article] [PubMed] [Google Scholar]
- 67.Mothana B, Roy S, Rauk A. Molecular Dynamics Study of the Interaction of Aβ (13-23) with β-sheet Inhibitors. ARKIVOC. 2009;2009:116–134. [Google Scholar]
- 68.Lemkul JA, Bevan DR. Assessing the Stability of Alzheimer’s Amyloid Protofibrils Using Molecular Dynamics. J Phys Chem B. 2010;114:1652–1660. doi: 10.1021/jp9110794. [DOI] [PubMed] [Google Scholar]
- 69.Bu Z, Shi Y, Callaway DJE, Tycko R. Molecular Alignment within β-Sheets in Aβ14-23 Fibrils: Solid-State NMR Experiments and Theoretical Predictions. Biophys J. 2007;92:594–602. doi: 10.1529/biophysj.106.091017. [DOI] [PMC free article] [PubMed] [Google Scholar]
- 70.Straub JE, Thirumalai D. Principles Governing Oligomer Formation in Amyloidogenic Peptides. Curr Opin Struct Biol. 2010;20:187–195. doi: 10.1016/j.sbi.2009.12.017. [DOI] [PMC free article] [PubMed] [Google Scholar]
- 71.Takeda T, Klimov DE. Interpeptide Interactions Induce Helix to Strand Structural Transition in Aβ Peptides. Proteins. 2009;77:1–13. doi: 10.1002/prot.22406. [DOI] [PMC free article] [PubMed] [Google Scholar]
- 72.Rojas A, Liwo A, Browne D, Scheraga HA. Mechanism of Fiber Assembly: Treatment of Aβ Peptide Aggregation with a Coarse-Grained United-Residue Force Field. J Mol Biol. 2010;404:537–552. doi: 10.1016/j.jmb.2010.09.057. [DOI] [PMC free article] [PubMed] [Google Scholar]
- 73.Lührs T, Ritter C, Adrian M, Riek-Loher D, Bohrmann B, Döbeli H, Schubert D, Riek R. 3D Structure of Alzheimer’s Amyloid-β(1–42) fibrils. Proc Natl Acad Sci US A. 2005;102:17342–17347. doi: 10.1073/pnas.0506723102. [DOI] [PMC free article] [PubMed] [Google Scholar]
- 74.Nguyen PH, Li MS, Derreumaux P. Effects of All-Atom Force Fields on Amyloid Oligomerization: Replica Exchange Molecular Dynamics Simulations of the Aβ16–22 Dimer and Trimer. Phys Chem Chem Phys. 2011;13:9778–9788. doi: 10.1039/c1cp20323a. [DOI] [PubMed] [Google Scholar]
- 75.Xu W, Zhang C, Derreumaux P, Gräslund A, Morozova-Roche L, Mu Y. Intrinsic Determinants of Aβ 12–24 pH-Dependent Self-Assembly Revealed by Combined Computational and Experimental Studies. PloS One. 2011;6:e24329. doi: 10.1371/journal.pone.0024329. [DOI] [PMC free article] [PubMed] [Google Scholar]
- 76.Chebaro Y, Mousseau N, Derreumaux P. Structures and Thermodynamics of Alzheimer’s Amyloid-β Aβ(16–35) Monomer and Dimer by Replica Exchange Molecular Dynamics Simulations: Implication for Full-Length Aβ Fibrillation. J Phys Chem B. 2009;113:7668–7675. doi: 10.1021/jp900425e. [DOI] [PubMed] [Google Scholar]
- 77.Sarroukh R, Cerf E, Derclaye S, Dufrene YF, Goormaghtigh E, Ruysschaert J, Raussens V. Transformation of Amyloid β(1–40) Oligomers into Fibrils is Characterized by a Major Change in Secondary Structure. Cell Mol Life Sci. 2011;68:1429–1438. doi: 10.1007/s00018-010-0529-x. [DOI] [PMC free article] [PubMed] [Google Scholar]
- 78.Mitternacht S, Staneva I, Härd T, Irbäck A. Monte Carlo Study of the Formation and Conformational Properties of Dimers of Aβ42 Variants. J Mol Biol. 2011;410:357–367. doi: 10.1016/j.jmb.2011.05.014. [DOI] [PubMed] [Google Scholar]
- 79.Baftizadeh F, Biarnes X, Pietrucci F, Affinito F, Laio A. Multidimensional View of Amyloid Fibril Nucleation in Atomistic Detail. J Am Chem Soc. 2012;134:3886–3894. doi: 10.1021/ja210826a. [DOI] [PubMed] [Google Scholar]
- 80.Côté S, Laghaei R, Derreumaux P, Mousseau N. Distinct Dimerization for Various Alloforms of the Amyloid-Beta Protein: Aβ1–40, Aβ1–42, and Aβ1–40(D23N) J Phys Chem B. 2012;116:4043–4055. doi: 10.1021/jp2126366. [DOI] [PubMed] [Google Scholar]
Associated Data
This section collects any data citations, data availability statements, or supplementary materials included in this article.