

Abstract
There is a growing appreciation of the beneficial attributes of allosteric drugs. However, the development of this special class of drugs has in large part been via serendipitous findings from high-throughput screens of drug libraries. Limited success at deliberately identifying allosteric drugs may be due to a focus on enzyme inhibitors, a parallel to the historic focus on competitive inhibitors. In contrast to inhibition, activation of an enzyme by a small molecule can only occur through a limited number of mechanisms, mainly allosteric regulation. Activation of human liver pyruvate kinase (hL-PYK) in an effort to create a glycolytic/gluconeogenic futile cycle is one potential mechanism to counteract hyperglycemia. Using hL-PYK, we demonstrate the potential of drug library screens to identify allosteric-activator drug leads.
Keywords: Allosteric, allostery, pyruvate kinase, high-throughput, drug screen
1. Introduction
Literature from the past five years has shown a growing interest in developing allosteric drugs (1–3). The defining features we use to describe allosteric drugs are: 1) the effector is not chemically identical to the substrate, 2) the effector elicits a change in a functional property of the protein (i.e. binding of a second ligand or altered catalytic properties), and 3) the effector binds at a site that is topographically distinct from the functional site of the protein (4). Allosteric drugs can mimic the natural regulatory mechanisms responsible for maintaining homeostasis in non-disease states. These drugs can provide specificity and selectivity in the regulation of related isozymes (2, 3). In addition, allosteric drugs (and allosteric effectors in general) have the unique property that upon reaching a concentration that allows the allosteric site to be saturated, no additional effects are observed as the concentration of the drug is raised even higher. This concentration-independent limit to molecular function adds to the safety of allosteric drugs (5). Furthermore, the magnitude of the allosteric function can be modulated by effector chemistry (6). Allosteric drugs also have the potential to provide the required efficacy only in the presence of appropriate substrate (2, 7). It has been postulated that all proteins have the potential to be allosterically regulated (8, 9). Unfortunately, much of the current allosteric drug advancements are a result of serendipitous findings from high-throughput screens (1–3).
The goal of this chapter is to demonstrate a design to identify allosteric drugs from a high-throughput screen of a 100,000 compound small molecule library. The primary emphasis is placed on allosteric activation rather than inhibition (see Note 1). The pharmacological usefulness of allosteric activators can easily be appreciated when considering that there is an opposing pathway to most metabolic and signaling pathways (e.g. activation of a phosphatase is likely to accomplish the same goal as inhibiting the opposing kinase). However, the greater benefit to our goal of specifically seeking allosteric drug leads is a result of the limited number of mechanisms that can give rise to activation. To further demonstrate this point, we will consider our target enzyme, human liver pyruvate kinase (hL-PYK).
Pyruvate kinase catalyzes the final reaction of glycolysis, the transfer of phosphate from phosphoenolpyruvate (PEP) to ADP to produce ATP and pyruvate. Activation of hL-PYK may facilitate a futile cycle between glycolysis and gluconeogenesis in the liver as a means of treating hyperglycemia. Like other isozymes, hL-PYK requires divalent cation for activity. In addition, the presence of a monovalent ion in the active site greatly facilitates PEP affinity (10). Pyruvate kinase activity is typically measured by coupling pyruvate production with NADH oxidation using lactate dehydrogenase. Therefore, any compound that inhibits lactate dehydrogenase, chelate Mg2+ or K+, or that binds to hL-PYK competitively with ADP, Mg2+, K+, or PEP would result in inhibition of activity. None of these mechanisms would be considered allosteric in nature. Therefore, library compounds might inhibit observed activity through a number of mechanisms. In contrast, activation of enzymatic activity can only occur through a limited number of mechanisms, mainly allostery.
Since our goal is activation of hL-PYK as a potential strategy to counteract hyperglycemia, we have designed our screen to explore effectors that increase activity through a number of allosteric mechanisms. Therefore, allosteric inhibitors (alanine and ATP) were included in the assay cocktail, such that activation would be observed if a library compound binds competitively with one of the allosteric inhibitors. Furthermore, the initial screen of library compounds was with the mutant protein containing the S12D mutation to mimic inhibition by phosphorylation. Therefore, increased activity in the initial screen used in this study might indicate either allosteric activation or the prevention of allosteric inhibition. The use of the natural allosteric activator, fructose-1,6-bisphosphate (Fru-1,6-BP) was limited to additions as a positive control.
2. Materials
2.1. Identification and confirmation of allosteric activators
S12D mutant protein: This protein was expressed in FF50 E. coli and purified using ammonium sulfate fractionation and DEAE column chromatography as previously described (11). Once purified the protein was stored at 4°C in 10 mM MES pH 6.8, 5 mM MgCl2, 10 mM KCl and 2 mM DTT.
L-lactic dehydrogenase (LDH): (Type III bovine heart) from Calzyme Laboratories, Inc.dialyzed into 50 mM HEPES pH 7.5, 10 mM MgCl2, 100 mM KCl, and 0.1 mM EDTA. The final 6KU/ml LDH stock was stored at and stored at 4°C.
NADH stock: 100 mM, stored at −20°C.
Alanine stock: 1.5 M stock, stored at −20°C.
10X screening-assay buffer: 500 mM HEPES, 100 mM MgCl2, 1 M KCl, and 1 mM EDTA, pH adjusted to pH 7.5 using KOH, stored at 4°C.
Sodium-ATP stock: 471 mM, pH adjusted to pH 7.5 with KOH, stored at −20°C
ADP stock: Due to the large quantity of ADP required, and a temporary shortage of ADP from most commercial sources, a mixture of sodium and potassium salts of ADP was used. After adjust pH with of the final stock solution with KOH, concentrations were: 400 mM ADP, 681 mM Na+, and 562 mM K+. This stock solution was stored at −20°C.
Fru-1,6-BP stock: 450 mM in 2.5% DMSO, used as a positive control to show activation.
DMSO: 2.5% added to control wells that lack an activator (i.e. negative control).
Small Molecule Library: The small molecule library maintained by the University of Kansas High-Throughput Screening Laboratory consists of 45,000 compounds from the ChemBridge Library, 56,000 from the ChemDiv Library, 880 the Prestwick Library, and 2000 the MicroSource Library. Library compounds, 25 μg/ml in 2.5% DMSO (see Note 2), were pre-dispensed into columns 3–12 of Perkin-Elmer 384-well View plates (see Note 3) and stored at −20°C. No compound additions were made to columns 1 and 2 of each plate so that these wells could be used for negative and positive controls, respectively.
Potassium-PEP stock: 270 mM PEP, stored at −20°C.
2.2. Distinguishing K-type vs. V-type effectors
Unless noted, materials and preparation are the same as those listed in section 2.1. For all solutions in this section the volume and concentration of KOH added to adjust pH was recorded; K+ from both KOH additions and the counterion added with ligands were summed and KCl was supplemented to maintain a constant 150 mM K+ for all assays. As indicated, the most strait forward method for maintain this constant K+ is to dilute variable assay components (i.e. substrate and effector) in the respective concentration of KCl.
Wild type hL-PYK: expressed, purified and stored as listed for S12D in Section 2.1 and reference (11).
10X assay buffer: 500 mM Bicine, 100 mM MgCl2, and 1 mM EDTA, pH was adjusted to 7.5 using KOH, stored at 4°C. Note that data collected in Bicine and HEPES (used in the initial library screen) are interchangeable (10).
Potassium-ADP stock: 400 mM, pH was adjusted with KOH, stored at −20°C.
Potassium-PEP stock: 27 mM. After the addition of KOH to adjust pH to 7.5, the total K+ in this stock was 147 mM. Therefore, this PEP solution was serially diluted 1:2 in 147 mM KCl.
Fru-1,6-BP stock: 92 μM, 177.5 mM KCl and either 1% DMSO or 1% ethanol, used as a positive control to show activation. This stock was diluted 1:5 in 177.5 mM KCl and the respective 1% organic additive.
Allsoteric compounds: Four compounds identified from the high-throughput screen of the small molecule library were contract synthesized by Obiter Research, LLC. Stock solutions of these compounds were made in 177.5 mM KCl with either 1% DMSO or 1% ethanol, depending on the solubility of the compound. This stock was diluted 1:5 in 177.5 mM KCl and the respective 1% organic additive.
Initial velocity data were collected in Greiner Bio-one UV-Star flat bottomed 96-well plates.
3. Methods
3.1. Identification of allosteric activators
The substrate concentration was of primary importance in this screen (see Note 4). To fully appreciate this, consider a plot of initial velocity as a function of substrate concentration (Figure 1A). Since we are attempting to identify compounds that either allosterically activate, or that prevent the pre-existing inhibition, let us consider an enzyme that is fully inhibited. In the case of hL-PYK, inhibition is achieved by the addition of S12D (a mimic of phosphorylation) and concentrations of Ala and ATP that saturate the effect of these ligands on the enzyme’s affinity for PEP (for this determination, see previous work (10–12)). In Figure 1A, the fully inhibited form of the enzyme is represented by the bottom/right most response curve. However, bear in mind that our screen uses only a single concentration of PEP, as represented by the black dot in Figure 1A. By choosing a PEP concentration that gives the maximum increase in initial velocity upon addition of the positive control (i.e. Fru-1,6-BP), the screen will be maximally sensitive to any form of activation or removal of inhibition. This point is illustrated by the black arrow that passes through representative response curves reflecting different PEP affinities. However, the example in Figure 1A is representative of an effector that modifies substrate affinity (K-type activator). Such a response might be expected for hL-PYK given that this K-type control is elicited by currently known forms of regulation (phosphorylation, allosteric regulation by ATP, Ala, and Fru-1,6-BP). However, a second potential outcome of our screen is the identification of effectors that modify Vmax activity (i.e. a V-type activator). Our assay design is likely less sensitive to a V-type activator (Figure 1B). The final assay concentration of 1.4 mM PEP was empirically determined by monitoring the level of activation upon the addition of 0.1 mM Fru-1,6-BP (the in-well concentration used as a positive control) in the presence of the S12D mimic of protein phosphorylation and in the presence of allosteric inhibitors (Figure 2).
Figure 1.
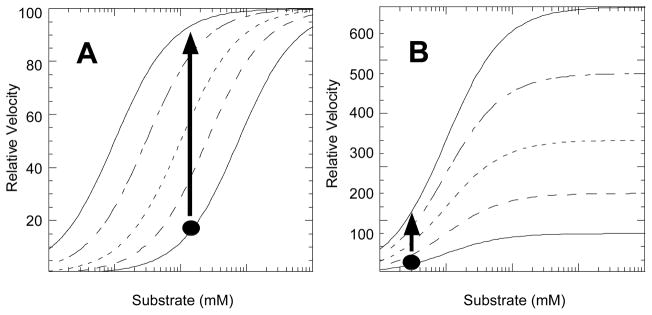
Modeled titrations of activity as a function of substrate, illustrated at five concentrations of activator or of ligands that bind competitively with inhibitors (increasing effector concentration from right to left in (A) and bottom to top in (B)). A). For maximum sensitive within the screen, substrate concentration should be chosen to give the maximum change in initial velocity upon addition of the activator control, Fru-1,6-BP in our example. B) Since our design is primarily focused on K-type activation, the assay conditions are less sensitive to effectors that increase Vmax.
Figure 2.

Expected increases in initial velocity due to an allosteric activation or removal of pre-existing inhibition. A vertical gray bar is included at the single PEP concentration used in the high-throughput screen. The response representative of the negative control (the S12D mutant mimic of phosphorylation, in the presence of Ala and ATP) included in the screen is in solid circles (●). Prevention of inhibition by phosphorylation is mimicked by the response of the wild type protein to varying PEP concentration, but in the presence of Ala and ATP (□). The response curve of S12D in the presence of Ala, but in the absence of ATP (◆) illustrates an expected response should ATP binding/inhibition be interrupted by a library compound. The removal of Ala (S12D assayed in the presence of ATP), demonstrates the expected outcome should a compound interrupt binding of Ala (○). Finally, the addition of Fru-1,6-BP when assaying S12D in the presence of both ATP and Ala serves both as the positive control and an example of allosteric activation (■). By comparing the %-change as each response curve cross the grey bar, an appreciation can be gained for the potential POC caused by library compounds.
Immediately before initiation of the high-throughput screen, an enzyme cocktail was mixed. The total volume of this cocktail to be mixed depended on the number of plates to be read. Volumes mixed per plate were 3.96 mls of 10X screening-assay buffer, 87 μl of 100 mM NADH, 8 μl of LDH, 198 μl of 400 mM ADP, 188μl of 471 mM ATP, 64 μl of 1.5 M Ala, 6 mg of fresh DTT, a volume of S12D hL-PYK that results in a ΔA340/min equal to ~0.015 in the final in-well assay (determined at the beginning of each day), and water to a final volume of 22 mls.
Also immediately before use, the 270 mM stock of PEP was diluted to 6.3 mM in 0.045% Triton-X100 (see Note 5).
Cocktail was pre-incubated before use. As noted below, a zero time point and a 1-hour time point were taken for each well. However, we noted a slight variation in linearity of the activity over the first 45 minutes. Although we could speculate a number of potential mechanisms for this slight variation (e.g. protein conformation shift in the cocktail with detergent and ligands, loss of ATP due to ATPase activity of hL-PYK, ect), we found that pre-incubating the cocktail for 2 hours at room temperature before initiating the reaction reduced this non-linearity.
For each plate containing aliquots of library compounds, 20 μl of 2.5% DMSO was added to column 1 using a 16-channel pipettor. These wells act as a negative control with no allosteric activation.
Likewise, 20 μl of 450 mM Fru-1,6-BP in 2.5% DMSO was added to column 2 of each plate using a 16-channel pipettor. These wells act as a positive control with known allosteric activation.
50 μl of pre-mixed, pre-incubated cocktail was added to each well using a Thermo Scientific Multidrop 384.
After a 4 minute delay, the reaction was started via the addition of 20 μl of 6.3 mM PEP in 0.045% Triton-X100 using a second Multidrop 384.
Immediately after the addition of PEP, the A340 (see Note 6 and 7) of each well of each plate was read (i.e. zero time point; ) using a Perkin Elmer Envision plate reader and using an internal P340 filter (340nm ±14nm, Tmax=20%).
After completion of the zero time point read for all 50 plates (see Note 8), A340 of each well of each plate was determined a second time (i.e. the 1-hour time point; ).
-
Data from an individual plate was only used if the Z′ score for that plate was >0.3, where
(Equation 1) Data to calculate the Z′ scores is contained in the 1st and 2nd column of the plate. For each well of each plate (i.e. for each compound in the library)(Equation 2) - Within each plate, the averageΔA340 for the positive control wells (i.e. in the presence of Fru-1,6-BP) was set equal to 100% and the averageΔA340 for the negative control wells was set equal to 0%. Data for each compound was expressed as a percentage of control (POC; Figure 3) using
(Equation 3) Compounds were sorted based on POC.
Figure 3.

A bar graph representation of a single 384-well plate. All data is presented as POC, as defined in the text. Plate columns (col#) are marked on the front x-axis and POC is marked on the y-axis. Plate rows on the Z-axis are not labeled. “Col1” on the far right contains the negative control series. “Col2” contains the positive control series. This is an unusual plate that contained several hit compounds; most plates contained no hit compounds. One of the compound discussed as an example below is labeled with a star above the representative bar.
3.2. Confirmation assay
The goal of this study was to identify potential drug leads from the compound library, not to identify all possible interacting compounds represented in the library. Therefore, false negatives are not a concern. In contrast, false positive are a major concern. Potential sources for false positives could arise if a library compound (included, but may not be limited to): 1) changes color over the time course of the assay, 2) slowly reacts with NADH, thereby increasing the rate of A340 reduction, 3) causes LDH to use NADH in a pyruvate independent manner, 4) binds to one active site of hL-PYK and mimics the homotropic cooperativity to increase the PEP affinity in a second active site of the protein, and 5) interacts synergistically with DMSO or Triton-X100 to modify enzymatic activity, but which would not have an impact in the absence of DMSO or Triton-X100.
Although it is common to run confirmation assays for the top 0.3% of hit compounds, this threshold contained only compounds that showed POC scores greater than 70. As demonstrated in Figure 2, the removal of inhibition due to phosphorylation or ATP will, at best, result in a POC score of 50. Therefore, the top 0.3% is not likely to contain compounds that bind competitively with ATP or that prevent inhibition by phosphorylation. In an effort to include these other types of drug leads, the top 0.6% compounds were selected. The same assay used for initial compound identification was used for the confirmation assay, with the one exception that hit compounds were transferred by hand from stock solutions. 472 compounds were confirmed to cause activation, as defined by a POC greater than 40 (This value allows for at least 20% error of the POC score of 50 used in selecting the top 0.6% of hit compounds) in the confirmation assay.
At the same time that confirmation assays were read, additional control plates were analyzed. 1) To test for PEP independent oxidation, the screen assay was read with the modification that 0.45% Triton-X100 was added to columns 1 and 3–24, in place of the 6.3 mM PEP in 0.45% Trition-X100 previously used (see Note 9). PEP was added to column 2 to maintain the positive control. 2) hL-PYK independent oxidation of NADH was evaluated by repeating the screen assay for hit compounds; with the exception that hL-PYK was not included for columns 1 and 3–24. hL-PYK was added to column 2 to maintain the positive control. Only nine compounds were removed due to PEP/hL-PYK independent oxidation of NADH.
Once hit compounds have been identified, there are a number of software options to aid in grouping compounds with similar chemical features. A common next step in drug screen strategies is to screen customized libraries containing compounds with the summarized chemical features obtained from the initial library screen. However, the multiple potential mechanisms of action anticipated by our design (see Figure 2) does not lend itself to this cyclic screen approach.
3.3. Distinguishing K-type vs. V-type effectors
To exemplify how one might further characterize the allosteric impact of a hit compound (i.e. a drug lead) after initial identification, the experimental approach to distinguish if a hit compound functions through an impact on the affinity for PEP (K-type response) vs. on Vmax, i.e. kcat, (V-type response) is detailed here.
Activity assays were used to determine initial velocity over a concentration range of PEP. From this data maximum velocity (Vmax) and substrate affinity/apparent affinity (Kapp-PEP) is determined. In turn, by determining Vmax and Kapp-PEP over a concentration range of the effector the influence of the effector on these parameters can be quantitatively assessed. Activity was measured by coupling the pyruvate production by hL-PYK with NADH oxidation catalyzed by lactate dehydrogenase.
Immediately before use, an enzyme cocktail was mixed. This cocktail included 36.96 mls of 10X assay buffer, 960μl of 100 mM NADH, 85 U/mL of lactate dehydrogenase, 1.848 mls of 400 mM ADP, and solid DTT to result in a final 2 mM concentration. Although the volume of wild type hL-PYK to be added to the enzyme cocktail was dependent on the activity of the individual protein preparation; the goal was to add sufficient activity to result in 0.08 Δ A340/min in the cuvette once effector and PEP added. As a final addition to the enzyme cocktail, water was added to a total volume of 79 mls.
Three additions were made to each well in a 96-well plate: 1) 195.5 μl of the appropriate effector concentration; 2) 74.5 μl of the enzyme cocktail; 3) the reaction was initiated by the addition of 80 μl of the appropriate PEP concentration. Since PEP and effectors were made as serial dilutions, 12 PEP concentrations were varied across columns 1–12 of the plate and 8 concentrations of effector were varied across rows A–H of the plate.
Changes in A340 of NADH over time were monitored using a Molecular Devices Spectramax Plus384 spectrophotometer. Assays were at 30°C. This temperature satisfies the ambient+5°C temperature requirement of the Molecular Devices Spectramax Plus384.
-
Once the initial velocity dependence on PEP concentration has been fit to a Michaelis-Menten or Hill equation, the fit parameters (Vmax and Kapp-PEP) can be plotted as a function of effector concentration (Figure 4). This data presentation alone can allow for qualitative data interpretation. However, equations for fitting this data to allow for quantitative interpretation are also available (13–15). To exemplify such fits, the control Fru-1,6-BP data included in Figure 4A is fit to:
(Equation 4) where Ka = Kapp-PEP when [Effector]=0, Kx = the dissociation constant for effector when [PEP]=0 and Qax =the coupling constant between PEP and the effector.
Figure 4.
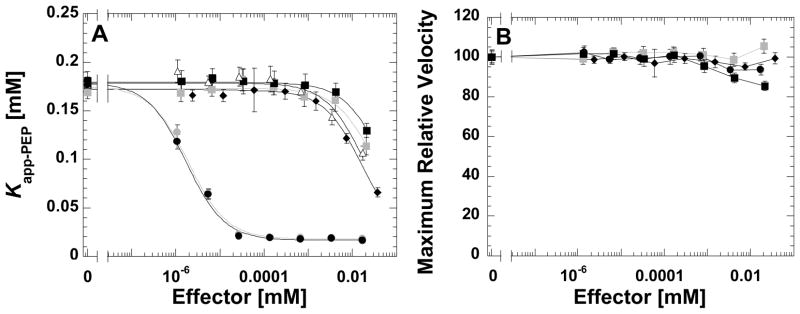
A) Kapp-PEP and B) maximal relative velocity as a function of effector concentration. To improve solubility of compounds, three of the compounds were used in the presence of 1% ethanol (data in black). A fourth compound was used in the presence of 1% DMSO (data in grey). Kapp-PEP as a function of Fru-1,6-BP (●), either with 1% ethanol or with 1% DMSO is included in A) as a control and lines running through data for this control represent the best fit to Equation 4. Without differentiating the four compounds included here, it is clear that each modifies Kapp-PEP without modifying maximal velocity.
We can draw a number of conclusions about the four compounds represented in Figure 4. Each “activates” by influencing PEP apparent affinity, without modifying Vmax activity. Each binds to hL-PYK with much less affinity than Fru-1,6-BP. The full activation (quantitative analysis of Qax from Equation 3) for each of the four compounds cannot be assessed with this data because the lower plateau is not defined by the effector concentration range included. Since the data in Figure 4 were collected with the wild type enzyme and in the absence of alanine and ATP, it seems likely that the representative four compounds increased the activity in the initial library screen by an allosteric activating mechanism, rather than by removing inhibition by alanine, ATP or the phosphorylation mimic.
Figure 5.

“Activation” and “inhibition” in an enzyme with allosteric regulation of substrate affinity. The open block arrows indicate effector influences on substrate affinity (i.e. left or right displacement of the curve.). However, if assays include only a single substrate concentration (i.e. the concentration at the black dot), the only observation is increase or decrease in initial velocity, as represented by the solid vertical arrows. As a result, allosteric effectors that facilitate substrate affinity are commonly referred to as activators and those that antagonize substrate affinity are commonly referred to as inhibitors.
Acknowledgments
This work was supported in part by NIH grant DK78076 (to A. W. F). Service for screening of a chemical library will be purchased from the High-Throughput Screening Laboratory at The University of Kansas. I would like to thank Byron Taylor both for his aid during screening of the 100,000 compound library. I also appreciate the contributions from Dr. Rathnam Chagaturu and Ashleigh Price.
Footnotes
The use of the words “activation” and “inhibition” should be further explored in the context of allosteric regulators. Traditionally, activation and inhibition refer to increased or decreased rates of catalysis. In the context of simple Michaelis-Menten model of substrate binding, two parameters are necessary to describe initial velocities of enzymatic reactions plotted as a function of substrate concentration; Vmax and Kapp-PEP. It follows that allosteric effector that increases or decreases Vmax are considered activators or inhibitors, respectively. It may be less intuitive why effectors that modulate Kapp-PEP are also commonly referred to by the terms activator and inhibitor. This more liberal use of these terms can best be appreciated by considering a simplistic experimental design that focus on assays at only a single substrate concentration (Figure 5). When assaying at a single substrate concentration, an increase or a decrease in activity is observed for effectors that either facilitate or antagonize substrate affinity, respectively.
Library compounds are often in a low concentration of DMSO. The stability of enzyme activity in the equivalent concentration of DMSO should be confirmed before initiating a screen.
Compounds in libraries are often pre-dispensed into the plates to be used. When using a spectroscopic technique, such as change in absorbance, it is necessary to confirm that the plates in use allow transmission of the proper wavelength.
Considering assays at one concentration of effector is a primary concern for high-throughput screening. Due to the limited number of measurements that can be collected for each compound when screening in a high-throughput setting, these screens are typically performed at one, or a limited number of (16), substrate concentrations. The detection used in our study was an increase in initial velocity when assayed at the same concentration of PEP as control experiments.
Evidence supports that colloidal aggregates of library compounds may be a cause of nonspecific effects (17, 18). Colloid formation and the resulting nonspecific effects of these colloids can be prevented by the addition of Triton-X100 (19, 20). However, before screening the library, it should be confirmed that the enzyme being screened retains activity in the presence of the detergent. Follow up assays are also necessary to insure that identified compound leads impact enzyme function in the absence of Triton-X100 and observed effects are not due to a synergistic effect between Triton-X100 and the library compound. In the presence of the 0.01% Triton-X100 (final in well concentration) used in our assays, the use of a Multidrop Micro to make additions to plates resulted in the formation of foam. This problem was avoided by using the larger diameter/lower flow rate of the Multidrop 384.
Precautions should be taken when using detections other than enzymatic activity. Detection such as protein conformational shifts detected by changes in tryptophan fluorescence that result from the binding of a library compound can indicate binding with no influence on active site function (4).
Although single point assays are common in high-throughput screens, the use of such an approach with an optical detection fails to consider that the library compound may also contribute to spectroscopic properties. Therefore if using an optical property of the protein or assay mix, it is best to use a detection based on a change in the optical property as a function of time.
Timing between the first and a second read may be (as was true in the experiments described here) determined by the rate of data collection. In our study, 50 plates were in read in one hour by the Envision.
Although not included in this study, it is conceivable to assay in the absence of Triton-X-100 to confirm that a hit compounds do not act synergistically with this detergent to result in activation, as well as assaying in the absence of phosphorylation or one of the allosteric inhibitors (Ala and ATP) as a means of distinguishing the mechanism by which each hit compound increase activity.
References
- 1.Hardy JA, Wells JA. Searching for new allosteric sites in enzymes. Curr Opin Struct Biol. 2004;14:706–715. doi: 10.1016/j.sbi.2004.10.009. [DOI] [PubMed] [Google Scholar]
- 2.Groebe DR. Screening for positive allosteric modulators of biological targets. Drug discovery today. 2006;11:632–639. doi: 10.1016/j.drudis.2006.05.010. [DOI] [PubMed] [Google Scholar]
- 3.Groebe DR. In search of negative allosteric modulators of biological targets. Drug discovery today. 2009;14:41–49. doi: 10.1016/j.drudis.2008.09.011. [DOI] [PubMed] [Google Scholar]
- 4.Fenton AW. Allostery: An illustrated definition for the ‘second secret of life’. Trends Biochem Sci. 2008;33:420–425. doi: 10.1016/j.tibs.2008.05.009. [DOI] [PMC free article] [PubMed] [Google Scholar]
- 5.Soudijn W, Van Wijngaarden I, APIJ Allosteric modulation of g protein-coupled receptors: Perspectives and recent developments. Drug discovery today. 2004;9:752–758. doi: 10.1016/S1359-6446(04)03220-9. [DOI] [PubMed] [Google Scholar]
- 6.Williams R, Holyoak T, McDonald G, Gui C, Fenton AW. Differentiating a ligand’s chemical requirements for allosteric interactions from those for protein binding. Phenylalanine inhibition of pyruvate kinase(,) Biochemistry. 2006;45:5421–5429. doi: 10.1021/bi0524262. [DOI] [PubMed] [Google Scholar]
- 7.Christopoulos A. Allosteric binding sites on cell-surface receptors: Novel targets for drug discovery. Nat Rev Drug Discov. 2002;1:198–210. doi: 10.1038/nrd746. [DOI] [PubMed] [Google Scholar]
- 8.Gunasekaran K, Ma B, Nussinov R. Is allostery an intrinsic property of all dynamic proteins? Proteins. 2004;57:433–443. doi: 10.1002/prot.20232. [DOI] [PubMed] [Google Scholar]
- 9.Swain JF, Gierasch LM. The changing landscape of protein allostery. Curr Opin Struct Biol. 2006;16:102–108. doi: 10.1016/j.sbi.2006.01.003. [DOI] [PubMed] [Google Scholar]
- 10.Fenton AW, Alontaga AY. Chapter 5: The impact of ions on allosteric functions in human liver pyruvate kinase. Methods Enzymol. 2009;466:83–107. doi: 10.1016/S0076-6879(09)66005-5. [DOI] [PMC free article] [PubMed] [Google Scholar]
- 11.Fenton AW, Hutchinson M. The ph dependence of the allosteric response of human liver pyruvate kinase to fructose-1,6-bisphosphate, atp, and alanine. Arch Biochem Biophys. 2009;484:16–23. doi: 10.1016/j.abb.2009.01.011. [DOI] [PMC free article] [PubMed] [Google Scholar]
- 12.Fenton AW, Tang Q. An activating interaction between the unphosphorylated n-terminus of human liver pyruvate kinase and the main body of the protein is interrupted by phosphorylation. Biochemistry. 2009;48:3816–3818. doi: 10.1021/bi900421f. [DOI] [PMC free article] [PubMed] [Google Scholar]
- 13.Reinhart GD. Quantitative analysis and interpretation of allosteric behavior. Methods Enzymol. 2004;380:187–203. doi: 10.1016/S0076-6879(04)80009-0. [DOI] [PubMed] [Google Scholar]
- 14.Reinhart GD. The determination of thermodynamic allosteric parameters of an enzyme undergoing steady-state turnover. Arch Biochem Biophys. 1983;224:389–401. doi: 10.1016/0003-9861(83)90225-4. [DOI] [PubMed] [Google Scholar]
- 15.Reinhart GD. Linked-function origins of cooperativity in a symmetrical dimer. Biophys Chem. 1988;30:159–172. doi: 10.1016/0301-4622(88)85013-0. [DOI] [PubMed] [Google Scholar]
- 16.Inglese J, Auld DS, Jadhav A, Johnson RL, Simeonov A, Yasgar A, Zheng W, Austin CP. Quantitative high-throughput screening: A titration-based approach that efficiently identifies biological activities in large chemical libraries. Proc Natl Acad Sci U S A. 2006;103:11473–11478. doi: 10.1073/pnas.0604348103. [DOI] [PMC free article] [PubMed] [Google Scholar]
- 17.Feng BY, Simeonov A, Jadhav A, Babaoglu K, Inglese J, Shoichet BK, Austin CP. A high-throughput screen for aggregation-based inhibition in a large compound library. J Med Chem. 2007;50:2385–2390. doi: 10.1021/jm061317y. [DOI] [PubMed] [Google Scholar]
- 18.Feng BY, Shelat A, Doman TN, Guy RK, Shoichet BK. High-throughput assays for promiscuous inhibitors. Nature chemical biology. 2005;1:146–148. doi: 10.1038/nchembio718. [DOI] [PubMed] [Google Scholar]
- 19.McGovern SL, Helfand BT, Feng B, Shoichet BK. A specific mechanism of nonspecific inhibition. J Med Chem. 2003;46:4265–4272. doi: 10.1021/jm030266r. [DOI] [PubMed] [Google Scholar]
- 20.Feng BY, Shoichet BK. A detergent-based assay for the detection of promiscuous inhibitors. Nature protocols. 2006;1:550–553. doi: 10.1038/nprot.2006.77. [DOI] [PMC free article] [PubMed] [Google Scholar]