

Abstract
A higher frequency of regulatory T cells (Tregs) has been observed in peripheral blood mononuclear cells (PBMC) of patients with different types of solid tumors and hematological malignancies as compared to healthy donors. In prostate cancer patients, Tregs in PBMC have been shown to have increased suppressive function. Tumor-induced biological changes in Tregs may enable tumor cells to escape immunosurveillance. We performed genome-wide expression analyses comparing the expression levels of more than 38,500 genes in Tregs with similar suppressive activity, isolated from the peripheral blood of healthy donors and patients with metastatic castration-resistant prostate cancer (mCRPC). The differentially expressed genes in mCRPC Tregs are involved in cell cycle processes, cellular growth and proliferation, immune responses, hematological system development and function, and the IL-2 and TGF-β pathways. Studies revealed that the levels of expression of genes responsible for T-cell proliferation (C-FOS, C-JUN, and DUSP1) and cellular migration (RGS1) were greater in Tregs from mCRPC patients as compared to values observed in healthy donors. Increased RGS1 expression in Tregs from mCRPC patients suggests a decrease in these Tregs’ migratory ability. Additionally, the higher frequency of CD4+CD25highCD127− Tregs in the peripheral blood of mCRPC patients may be the result of an increase in Treg proliferation capacity. Results also suggest that the alterations observed in gene expression profiles of Tregs in mCRPC patients may be part of the mechanism of tumor escape from host immune surveillance.
Keywords: regulatory T cells, prostate cancer, immune suppression
Introduction
Prostate cancer is the second leading cause of cancer death in men and accounts for about 11% of cancer-related deaths in that population. In 2012, new cases of prostate cancer in the United States were estimated at 241,740, resulting in 28,170 deaths.1
Traditional cancer treatments, including surgery, radiation therapy, hormonal therapy, and chemotherapy, provide only partial cures. Therapeutic cancer vaccines aim to activate a specific antitumor response in the host, with lower toxicity than standard treatments.2 However, tumor-induced immune suppression may hamper the effectiveness of immunotherapies and results in failure to arrest tumor progression.3 Various mechanisms have been proposed for the tumor’s ability to escape from host immune surveillance, including (a) the release of soluble factors that interfere with the host’s immune response against tumor,4 and (b) various immune cells that induce immunosuppression, including myeloid-derived suppressor cells,5 tumor-associated macrophages,6 type 2 natural killer T (NKT) cells,7 mast cells,8 and regulatory T cells (Tregs).9
Tregs play an important role in maintaining immunologic self-tolerance and controlling autoimmunity. However, in cancer, they contribute to tumor growth and progression by dampening the anti-tumor immune response. Although the Treg phenotype is debatable, CD4+CD25high Tregs display strong immunosuppressive activity and are regarded as the functional representative of Tregs in humans.10 CD25high cells represent 1% to 2% of CD4+ T cells in peripheral blood. CD4+CD25high Tregs express the transcription factor forkhead box P3 (FoxP3), which is the master regulator in the development and function of Tregs.11 It has also been shown that CD127 expression is inversely correlated with FoxP3 expression, and that CD127− in the CD4+CD25high population confers suppressive function.12
Tregs can suppress the immune response by a variety of mechanisms. They can affect both innate and adaptive immunity through (a) cytokine production; (b) activation, proliferation, and function of CD4+ and CD8+ T cells;13, 14 (c) immunoglobulin production and response of B cells;15 (d) maturation of dendritic cells;16 and (e) the function of natural killer (NK)17 and NKT cells.18 Possible mechanisms of Treg suppression have been suggested. Some studies have shown that cell-to-cell contact between Tregs and target cells is required for suppressive function.19 In particular, TGFβ and cytotoxic T lymphocyte-associated antigen 4 (CTLA4) surface molecules on Tregs inhibit conventional T-cell proliferation.20, 21 Other studies have demonstrated that Tregs exert a suppressive effect through the production of immunosuppressive cytokines such as IL-10 and TGFβ.22
In response to chemotactic stimuli, Tregs migrate selectively to inflammatory sites via chemokine integrin receptors.23 Attraction of Tregs to tumor sites by CCL17 or CCL22 through CCR4 has been shown in breast and gastric cancers.24 In addition, a higher percentage of Tregs isolated from cancer patients express the proliferation marker Ki67,24, 25 suggesting increased proliferation of Tregs in cancer patients. Higher Treg numbers observed in the peripheral blood and tumor sites of patients with solid and hematologic malignancies correlated to poor prognosis.26 Conversely, clinical studies have demonstrated that depletion of Tregs in cancer patients can improve vaccine-mediated antitumor responses.27
We have previously demonstrated an increased suppression of CD4+CD25− cell proliferation by Tregs isolated from PBMC of mCRPC patients compared to Tregs from healthy donors.28 Miller et al. found elevated Treg numbers in the tumors and peripheral blood of prostate cancer patients and detected CCL22 chemokine in the secretions of primary prostate tumors, malignant ascites, and prostate cancer cell lines.9 Despite this information about the relationship between prostate cancer and Tregs, the molecular mechanisms underlying the influence of prostate carcinomas on Tregs are still unclear. In this study, we investigated Treg characteristics beyond suppressive function by comparing the genome-wide expression profiles of Tregs with similar suppressive activity from mCRPC patients and healthy donors.
Materials and Methods
Patients and healthy donors
A concurrent multicenter randomized phase II prostate cancer vaccine trial29 at the National Cancer Institute (NCI), National Institutes of Health, enrolled 32 patients with mCRPC who had not received any radiotherapy or chemotherapy within 6 months prior to blood draw. Of these 32 patients, 17 were evaluable for this analysis. At enrollment, all patients had evidence of disease progression as defined by (a) new metastases on bone scan and/or (b) disease progression on CT scan, or (c) increased serum PSA as determined by PSA consensus criteria.30 All patients signed a consent form approved by the NCI’s Institutional Review Board. The median age of the 17 evaluable patients was 63 (range, 46–78). The median age of healthy donors (n = 33) was 49 (range, 23–76).
Isolation of peripheral blood mononuclear cells (PBMCs)
PBMCs were isolated by density gradient separation using CAPPEL LSM Lymphocyte Separation Medium (MP Biomedicals, Solon, OH). Isolated PBMCs were washed 3 times with PBS and cryopreserved in liquid nitrogen at 5 × 10⁷ cells/ml in heat-inactivated human serum with 10% DMSO.
Isolation of Tregs
PBMCs were collected from mCRPC patients pre-vaccination. CD4+ T cells were negatively selected from PBMCs by magnetic separation (CD4+ T-Cell Isolation Kit II, Miltenyi Biotec Inc., Auburn, CA). The CD4+ T cells obtained were stained with FITC-conjugated anti-CD25 and PE-conjugated anti-CD127 (BD Biosciences, San Jose, CA). CD25highCD127− cells, representing the Treg population, were isolated by a FACSDiva flow cytometer (BD Biosciences), and cell-sorting data were analyzed by FACSDiva software (BD Biosciences).
Immunosuppression assay
CD4+CD25− T cells (1 × 10⁴ cells/ml) were cultured alone or cocultured with Tregs (1 × 10⁴ cells/ml) with 1 μg/ml of anti-CD3 plate-bound antibody (clone OKT3; eBioscience, San Diego, CA) and irradiated (3,500 rad) T cell-depleted PBMCs (1 × 10⁵ cell/ml) in a 96-well flat-bottomed plate at 37oC and 5% CO2. Cells were cultured in RPMI 1640 (Mediatech, Manassas, VA) supplemented with 100 U/ml of penicillin, 100 μg/ml of streptomycin (Mediatech) and 2 mM of L-glutamine (Mediatech) in 10% heat-inactivated human AB serum (Gemini Bio-Products, West Sacramento, CA) at a total volume of 200 μl/well. T-cell proliferation was measured by [3H]thymidine (PerkinElmer, Waltham, MA) incorporation pulsed on day 4 at 1 μCi (0.037 MBq)/well and quantified 16 hours later using a liquid scintillation counter (PerkinElmer). All experiments were done in triplicate. Proliferation of CD4+CD25− T cells without coculturing with CD4+CD25high Tregs was defined as 100% proliferation.
RNA preparation
Total RNA was extracted from CD4+CD25highCD127− Tregs using TRIzol® Reagent (Invitrogen, Carlsbad, CA). Briefly, 800 μl of TRIzol® Reagent was added to each CD4+CD25highCD127− Treg sample, ranging from 3 × 10⁵ to 2 × 10⁶ Tregs. Samples were vortexed briefly and incubated at room temperature for 5 minutes. Chloroform (200 μl) was added to each sample and vortexed for 15 seconds. After incubation at room temperature for 3 minutes, samples were centrifuged at 12,000 xg at 4oC for 15 minutes. The aqueous phase (300 μl) was collected in a new tube and 300 μl of nuclease-free water was added to the organic phase for re-extraction. The aqueous phases were pooled and mixed with 100 μl of 1M Tris-HCl, pH 8.0, and 700 μl of 70% ethanol. The mixture was loaded into an RNeasy MinElute spin column (Qiagen, Valencia, CA) for RNA purification according to the manufacturer’s instructions. RNA contents and integrity were monitored by NanoDrop (Thermo Scientifics, Rockford, IL) and Agilent Bioanalzyer 2100 (Agilent Technologies, Palo Alto, CA).
Microarray hybridization
From each sample, 100 ng of total RNA was amplified using the Two-Cycle Target Labeling and Control Reagents kit (Affymetrix, Santa Clara, CA) and MEGAscript T7 kit (Ambion, Austin, TX) according to the manufacturer’s instructions. Biotin-labeled cRNAs were hybridized to GeneChip Human Genome U133 Plus 2.0 Arrays (Affymetrix). Hybridization signals were obtained using the GeneChip Scanner 3000 (Affymetrix). Microarray data were deposited into the Gene Expression Omnibus database of the National Center for Biotechnology Information under accession number GSE38043.
Expression array and gene network analysis
Raw gene expression data were quantile normalized by a robust multiarray average algorithm and analyzed in Partek Genomics Suite 6.4 (Partek, St. Charles, MO). Statistical analyses were performed on log 2-transformed data. Differential gene expression was evaluated using one-way ANOVA. Within the ANOVA model, linear contrasts were used to compare the Tregs from cancer patients and healthy donors. A step-up Benjamini false discovery rate (FDR) adjustment was used to adjust for multiple testing errors. FDR was set at < 10% to produce a list of significantly differentially expressed genes for each contrast described above. An expression cutoff of 3-fold was set to identify genes whose expression was significantly differentially regulated. The integrated gene network analysis on the gene set with significant expression changes was generated by Ingenuity Pathway Analysis (Ingenuity Systems, www.ingenuity.com), with an FDR of 5%. Each gene identifier was mapped to its corresponding gene object in the Ingenuity Knowledge Base. These genes, called focus genes, were overlaid onto a global molecular network developed from information contained in the Ingenuity Pathways Knowledge Base. Networks of these focus genes were then algorithmically generated based on their connectivity. Functional analysis identified the biological functions and/or diseases most significant to the data set. Fischer’s exact test was used to calculate a p value, determining the probability that each biological function and/or disease assigned to that data set is due to chance alone. A p value of < 0.05 was considered significant.
NanoString nCounter gene expression analysis
Analysis of gene expression was performed as previously described.31 Briefly, 10 μl of reporter CodeSet reagent, 5 μl of capture ProbeSet reagent and 10 μl of hybridization buffer (NanoString Technologies, Seattle, WA) were mixed, and 100 ng of total RNA was added to the mixture. Nuclease-free water was used to adjust the final volume of each hybridization assay to 30 μl. The RNA was hybridized to the probes at 65oC for at least 12 hours. After hybridization, excess probes were washed away by a 2-step magnetic bead-based purification procedure on the nCounter Prep Station (NanoString Technologies). Purified target/probe complexes were immobilized in the cartridge for data collection. Barcodes, which represent gene expression level, were counted in the nCounter Digital Analyzer.
Flow cytometry
Cryopreserved PBMCs were stained with APC-Cy7-conjugated anti-CD4, PE-Cy7-conjugated anti-CD25, PerCP-Cy5.5-conjugated anti-CD127 (BD Biosciences), APC-conjugated anti-FOXP3 (clone 236A/E7, eBioscience), and PE-conjugated anti-c-Jun (Santa Cruz Biotechnology, Santa Cruz, CA) antibodies for phenotypic characterization. One million PBMCs were resuspended in 100 μl of FACS sheath solution (BD Biosciences) and stained with the antibodies for 45 minutes at 4oC. Cells were fixed and permeabilized with FoxP3 staining buffer (eBioscience) according to the manufacturer’s protocol, then labeled with anti-FoxP3 and anti-c-Jun or isotype control antibodies. Flow cytometry was performed on an LSRII flow cytometer (BD Biosciences) and 100,000 events were acquired for each sample. Data were analyzed by FACSDiva software (BD Biosciences).
CD4+CD25− cells were isolated with a CD4+CD25+ Regulatory T Cell Isolation Kit according to the manufacturer’s instructions (Miltenyi). One million cells were surface stained with PE-Cy7-conjugated anti-CD4 and APC-conjugated anti-CD25 (BD Biosciences), then fixed and permeabilized as described above. Cells were then stained with rabbit anti-human RGS1 and mouse anti-human DUSP1, rabbit anti-human c-Jun and mouse anti-human c-Fos, or isotype controls, then with PE-conjugated goat anti-mouse IgG and FITC-conjugated goat anti-rabbit IgG secondary antibodies (Novus Biologicals, Littleton, CO). Flow cytometry was performed on an LSRII and 30,000 events were collected. Data were analyzed by FlowJo5 software (Treestar Inc, Ashland, OR).
Statistical analysis
The D’Agostino-Pearson omnibus normality test was performed in each group of data to check for normal distribution. An unpaired t test was used to assess differences among the groups for normally distributed data; otherwise, the Mann-Whitney test was performed. p < 0.05 was considered statistically significant.
Results
In order to best assess differences in the gene expression profile due to the presence of prostate cancer, Tregs that were as functionally and phenotypically similar as possible were selected for comparison. A representative example of the Treg analysis performed is shown in Figure 1. Functional activity was determined by the ability of Tregs to suppress autologous CD4+CD25− T-cell proliferation (Fig. 1a). CD4+CD25− T-cell proliferation was not significantly different between healthy individuals and cancer patients (p = 0.84, Supporting Information Table 1). Tregs from 3 healthy donors were analyzed by flow cytometry to confirm that CD4+CD25+CD127− Tregs were FoxP3+ (Fig. 1b). Samples from 3 healthy donors and 3 mCRPC patients with similar Treg suppressive activity (Table 1) were chosen for gene expression profiling using the GeneChip Human Genome U133 Plus 2.0 Array. A principal component analysis model was constructed from the microarray data (Fig. 2). In the principal component analysis model, a ball represents an individual’s global gene expression pattern. Of the gene array probes compared between the 3 healthy donors and the 3 mCRPC patients, 73% matched this principal component analysis model. The gene expression signature of the individuals within each group was highly similar, as illustrated by the close proximity of the balls within the same group in the principal component analysis diagram. The clear separation of these 2 groups of samples represented distinct differences in gene expression patterns. More than 38,500 genes were analyzed. At a false discovery rate of < 10% (p < 0.0038), 2,081 transcripts were differentially expressed. A more biologically relevant ≥ 3-fold change in expression level was set as the criterion for identifying genes that were differentially expressed. There were 384 transcripts that satisfied this criterion; 198 transcripts were up-regulated and 186 were down-regulated in mCRPC patients compared to healthy donors (Supporting Information Table 2). Five functional categories of biological processes, including cell cycle, cellular growth and proliferation, immune response, hematological system development and function, and cancer, were identified by Ingenuity Pathway Analysis (IPA) to be over-represented in Tregs from mCRPC patients (Supporting Information Table 3).
Figure 1.

Analysis of suppressive function of CD4+CD25high Tregs. (a) Example of suppression of CD4+CD25− T-cell proliferation by CD4+CD25high Tregs in a healthy donor. Isolated effectors (CD4+CD25 ) and Tregs (CD4+CD25high) were cultured separately, or cocultured at 3 different ratios (1:1, 1:0.5, and 1:0.2) upon stimulation with anti-CD3 and irradiated T cell-depleted PBMCs. Experiments were performed in triplicate. Columns: average count per minute (cpm); bars: SD. Percentages indicate level of inhibition of CD4+CD25− T-cell proliferation. (b) Expression of FoxP3 in CD4+CD25+CD127lo/− Tregs in a healthy donor. PBMCs from 3 healthy donors were analyzed by flow cytometry after cell surface staining with APC-Cy7-conjugated anti-CD4, PE-Cy7-conjugated anti-CD25, PerCP Cy5.5-conjugated anti-CD127, and intracellular staining with APC-conjugated FoxP3. The figure represents results from 1 healthy donor and similar results were also observed in other healthy donors and prostate cancer patients. Percentage indicates proportion of cells expressing FoxP3 in the CD4+CD25+CD127lo/− Treg population.
Table 1.
Suppressive activity of CD4+CD25high Treg samples
| Samples | CD4+CD25high Treg suppressive activity |
|---|---|
| HD1 | 44.3% |
| HD2 | 44.1% |
| HD3 | 56.1% |
| PCa 1 | 44.0% |
| PCa 2 | 55.8% |
| PCa 3 | 51.7% |
Results are expressed as % of suppressive activity of CD4+CD25high Treg against the proliferation of CD4+CD25− effector T-cell.
HD = healthy donor; PCa = metastatic prostate cancer patient.
Figure 2.

PCA model showing the global gene expression difference between healthy donors (red balls; n = 3) and mCRPC patients (blue balls; n = 3).
Microarray data showed increased expression of C-FOS (113-fold; p = 0.00015), C-JUN (27.2-fold; p = 0.00017), DUSP1 (9.1-fold; p = 0.00032), and RGS1 (3.5-fold; p = 0.00288) in Tregs from mCRPC patients compared to healthy donors. The differential expression patterns of these 4 genes were verified by NanoString technique in a separate experiment with Tregs isolated from 9 mCRPC patients and 10 healthy donors. The average level of suppressive activity of Tregs from the mCRPC patients was 46%, compared to 47% for the healthy donors. Expression levels of these 4 genes were significantly higher in Tregs obtained from mCRPC patients, with a fold change of 1.8x (p = 0.0093) for C-FOS, 1.6x (p = 0.009) for C-JUN, 1.5x (p = 0.0122) for DUSP1, and 1.5x (p = 0.0407) for RGS1 (Fig. 3ad).
Figure 3.
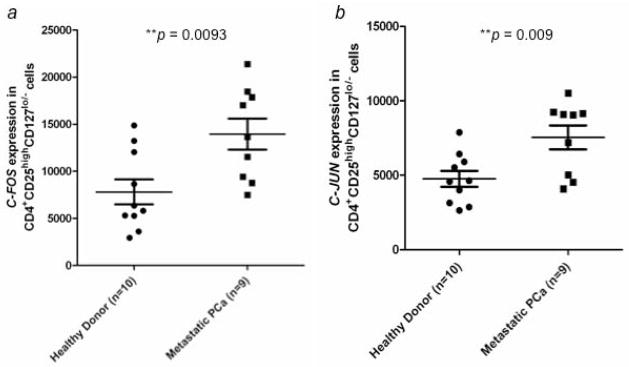

Verification of gene expression by NanoString analysis and flow cytometry. Expression of (a) C-FOS, (b) C-JUN, (c) DUSP1, and (d) RGS1 in CD4+CD25highCD127lo/− Tregs from healthy donors (n = 10) and mCRPC patients (n = 9) was analyzed by NanoString analysis. C-JUN protein expression in CD4+CD25highCD127lo/− Tregs was further examined by flow cytometry analysis. (e) Percentage of c-Jun+ cells from CD4+CD25highCD127lo/− Tregs was compared between healthy donors (n = 8) and mCRPC patients (n = 8). (f) Percentage of c-Jun+ cells in CD4+CD25highCD127lo/− Foxp3+ Tregs. A statistically significant difference was seen between healthy donors and mCRPC patients in all analyses. *, p < 0.05, **, p < 0.01, and ***, p < 0.001.
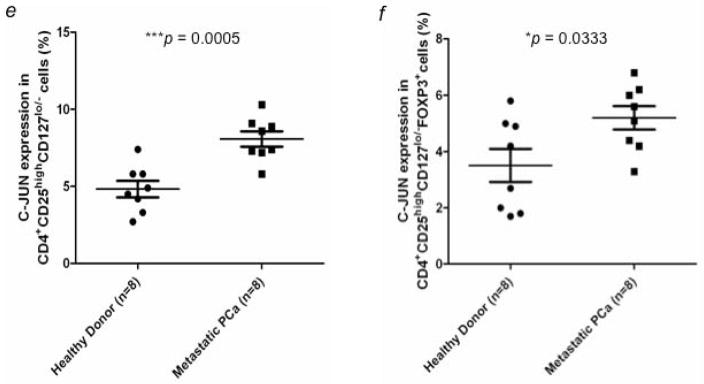
Expression of c-Jun at the protein level was evaluated in Tregs from 8 mCRPC patients and 8 healthy donors by flow cytometry. Expression of c-Jun was significantly higher in Tregs from mCRPC patients (8.08 ± 0.5%; range, 5.8–10.3%) than in Tregs from healthy donors (4.83 ± 0.53%; range, 2.7–7.4%) (Fig. 3e). Expression of c-Jun in CD4+CD25highCD127 FoxP3+ Tregs was also higher in mCRPC patients (5.2 ± 0.41%; range, 3.3–6.8%) than in healthy donors (3.51 ± 0.58%; range, 1.7–5.8%) (Fig. 3f). To determine if the up-regulation of these genes was specific to Tregs, we examined protein expression of c-Fos, c-Jun, DUSP1 and RGS1 in CD4+CD25− cells from healthy donors and mCRPC patients. There were no significant differences between healthy donors and mCRPC patients in the percentage of cells positive (Fig. 4) or mean fluorescence intensity (data not shown) for any of the 4 proteins.
Figure 4.
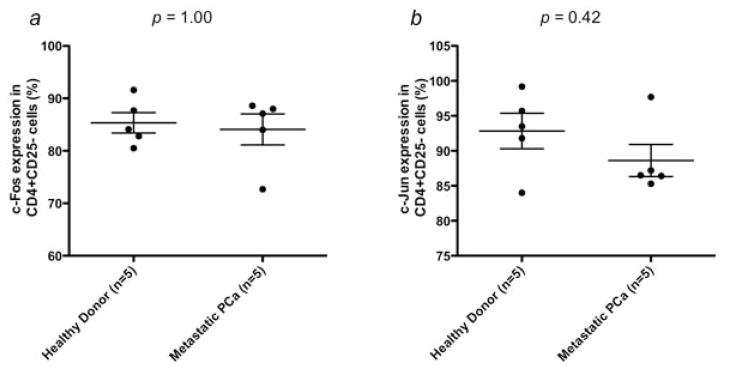
Differential gene expression between mCRPC patient and healthy donor Tregs is not applicable to all CD4+ cells. Expression of (a) c-Fos, (b) c-Jun, (c) DUSP1 and (d) RGS1 was examined at the protein level in CD4+CD25− cells isolated from mCRPC patients (n = 5) and healthy donors (n = 5). No significant differences were seen in the percentage of positive cells between the 2 groups (p > 0.05).
The differential expression of these genes in patients’ Tregs may imply a change in the rate of cell proliferation. Therefore, we investigated whether the frequency of Tregs in CD4+ T cells is different between 17 mCRPC patients and healthy donors. The percentage of Tregs in CD4+ T cells in mCRPC patients (6.92 ± 0.89%; range, 2.3–15.8%) vs healthy donors (4.97 ± 0.35%; range, 2.6–7.8%) was significantly higher (p = 0.0492) (Fig. 5a). However, there was no significant difference in the percentage of FoxP3+ cells in the CD4+CD25+CD127 compartment between mCRPC patients and healthy donors (Fig. 5b).
Figure 5.

Percentage of CD4+CD25highCD127lo/− Tregs in peripheral blood of healthy donors (n = 17) and mCRPC patients (n = 17). (a) Levels of CD4+CD25highCD127lo/− Tregs are presented as a percentage of total CD4+ T cells. A statistically significant difference was observed between the 2 groups (p < 0.05). (b) Percentage of FoxP3 expression in CD4+CD25highCD127lo/− Tregs from healthy donors (n = 8) and mCRPC patients (n = 8). No statistically significant difference was observed between the 2 groups (p > 0.05).
Discussion
This study showed that 384 genes had a ≥3-fold difference in expression between Tregs isolated from mCRPC patients and healthy donors. These genes fell into 5 functional categories: cell cycle, cellular growth and proliferation, immune response, hematological system development and function, and cancer. As Tregs are known to be poorly proliferative under most conditions, it was surprising to find that a number of genes involved in proliferation and the cell cycle were up-regulated in the Tregs from mCRPC patients. Although this study was focused on gene expression differences in Tregs, these effects did not appear to be applicable to the entire CD4+ population, as there was no significant difference in CD4+CD25− cell proliferation between healthy donors and cancer patients. These findings were further supported by a significantly higher frequency of Tregs in the peripheral blood of mCRPC patients than healthy donors. The up-regulation of four genes of interest, C-FOS, C-JUN, DUSP1 and RGS1, was confirmed by quantitative analysis of mRNA. C-FOS, C-JUN and DUSP1 are involved in various processes of cellular proliferation, while RGS1 regulates chemokine receptor signaling.
C-FOS and C-JUN form the heterodimer AP-1, which participates in the control of cellular responses to stimuli that regulate cell proliferation and differentiation, as well as cell death.32 In T cells, C-JUN activation is critical for T-cell receptor signaling, T-cell activation, development, differentiation, and proliferation, as well as lymphokine production.33–37 Studies have shown that transcriptional activation of C-JUN is inhibited in anergic T cells,38, 39 which is one of the features of Tregs. Another study demonstrated impairment of the promoter DNA-binding activity of AP-1 in natural Tregs upon stimulation with anti-CD3 and anti-CD28, in which FOXP3 played an inhibitory role in C-JUN-based AP-1 transcriptional activity by interacting with C-JUN in Tregs to maintain Treg unresponsiveness.40 Increased levels of C-JUN and C-FOS in Tregs from mCRPC patients could probably counteract the inhibitory effect of FoxP3 on AP-1 DNA-binding activity when the FoxP3 expression level remained unchanged. Consequently, the anergic characteristics of Tregs may be abrogated, leading to proliferation in response to activation signals in mCRPC patients.
Dusp1 is a phosphatase shown to be active in the mitogen i.e., "mitogen-activated protein" kinase (MAPK) pathway. MAPKs belong to an evolutionarily conserved group of serine/theronine protein kinases. In response to various stimuli, including growth factors, cytokines, and stress conditions, MAPKs play important roles in proliferation, differentiation, apoptosis, or immune responses such as production of inflammatory molecules.41 MAP kinase-specific phosphatases (MKPs) are regulators of MAPK in both innate and adaptive immune responses.42 Although the role of DUSP1 (MKP-1) in Tregs has not been addressed, a study of CD4+ and CD8+ T cells of DUSP1 knock-out mice demonstrated that DUSP1 was required for T-cell activation and proliferation.43 The increase in DUSP1 gene expression in this study, together with the increased expression of C-JUN and C-FOS, indicate an augmented activation and proliferation of Tregs in mCRPC patients.
Chemokine function is mediated through binding to chemokine receptors, thus stimulating the respective pathways for cellular migration.44 The expression of chemokine receptors on lymphocytes therefore determines the migration of immune cells into specific tissues.45 Chemokine receptors belong to the G-protein-coupled receptor family,46 for which signaling pathways can be controlled by the regulator of G-protein signaling (RGS) proteins.47 RGS proteins affect chemoattractant-stimulated cell migration and adhesion. A T-cell migration study demonstrated that Tregs migrated less than naïve CD4+ T cells in vivo, and that this phenomenon correlated with higher expression of RGS1.48 Up-regulation of RGS1 in Tregs from the peripheral blood may make them more responsive to tumor-derived chemokines, such as CCL22. This may contribute to the accumulation of Tregs reported at the site of prostate cancer tumors.49
A recent study demonstrated an increase in the frequency of CD4+CD25high Tregs in the peripheral blood of renal cell carcinoma patients.50 In the same study, customized oligonucleotide microarray was employed to quantify 350 genes associated with Treg phenotype. Results showed that 49 genes were significantly up- or down-regulated, with a ≥ 1.5-fold change in gene expression as compared to healthy controls. Although IPA was not used to classify biological functions, genes related to cell cycle and the immune system were identified. Higher levels of C-JUN, DUSP1, and RGS1 expression were also observed in CD4+CD25high Tregs from renal cell carcinoma patients, indicating that up-regulation of these genes is a common feature of Tregs affected by different types of cancer and is not cancer tissue-specific. In this same study, increased expression of the antiapoptotic genes LGALS3 and LGALS1 was confirmed by real-time PCR. The authors hypothesized that increased antiapoptotic activity might promote Treg survival and lead to the accumulation of Tregs in the periphery. While our study focused on the increased expression of proliferation genes, together these studies suggest a shift in the balance toward Treg survival in cancer patients that may counteract host antitumor immunity.
Our IPA showed that C-JUN and DUSP1 were associated with each other as well as with other genes (Supporting Information Fig. S1a). Gene expression profile data generated from this study thus suggest that differential gene expression in Tregs from cancer patients is not confined to a few genes, but a network of genes affecting each other through positive or negative feedback mechanisms. Mapping differentially expressed genes in de novo pathways by IPA showed genes related to T-cell cycle, cytokinesis, and expansion of Tregs were affected by, and had interactions with, master controlling genes such as p38, MAPK and NFkB (Supporting Information Fig. S1b). Moreover, our mapping of the differentially expressed genes to canonical TGFβ pathways (p = 0.0349) by IPA (Supporting Information Fig. S1c) revealed that the TGFβ pathway may also be altered in Tregs from mCRPC patients. Controlling these master genes through enhancers or inhibitors, such as abiraterone and sunitinib, may modulate the pathways of cellular proliferation or expansion of Tregs, thus decreasing Treg proliferation in cancer patients and increasing the efficacy of active immunotherapy.
One caveat of this study is that in comparing Tregs with similar suppressive ability from cancer patients and healthy donors the healthy donors chosen had relatively highly suppressive Tregs, which were not representative of the average. However, we felt that matching suppressive abilities was necessary to focus on the effects of prostate cancer on the Tregs. Another caveat is the limited amount of PBMC available from patients. The small percentage of Tregs recovered from isolation prevented functional studies from being performed on the patient samples in this study. In future studies, we plan to investigate several more of the differentially regulated genes found in this study, perform functional studies, and determine the effect of a cancer vaccine on the gene expression profile of Tregs from metastatic prostate cancer patients.
The gene expression studies reported here from Tregs of mCRPC patients indicate that several biological processes, including proliferation (through C-JUN, C-FOS, and DUSP1), lymphocyte migration (through RGS1), cell cycle, cell growth and proliferation, immune response, and hematological system development and function, were affected by the presence of the prostate cancer. We also found that mCRPC patients have an increase in the percentage of Tregs from peripheral blood. Taken together, these data suggest that the mCRPC tumors can affect Tregs at the molecular level, perhaps by influencing their proliferative and migratory abilities. An accumulation of Tregs at the tumor site could dampen the anti-tumor response and potentially result in tumor escape from immune surveillance. These studies thus support the rationale of a strategy that combines a therapeutic cancer vaccine or other forms of immunotherapy with an agent that targets Treg proliferation; this may lead to improved clinical outcomes for patients with prostate cancer.
Supplementary Material
Novelty.
This is the first study to compare the global gene expression patterns of CD4+CD25highCD127−FoxP3+ regulatory T cells (Tregs) from healthy donors and metastatic castration-resistant prostate cancer (mCRPC) patients. We found that genes related to cell cycle, cellular proliferation, and immune responses were differentially expressed in CD4+CD25highCD127−FoxP3+ Tregs from prostate cancer patients. We confirmed the up-regulation of C-FOS, C-JUN, DUSP1, and RGS1 gene expression in Tregs from prostate cancer patients, and found that this up-regulation correlated with an increased frequency of CD4+CD25highCD127−FoxP3+ Tregs. These results suggest that the alterations observed in gene expression profiles of Tregs in mCRPC patients may contribute to tumor escape from host immune surveillance.
Impact.
This study contributes to our knowledge of tumor-induced immune suppression in prostate cancer patients. These data show that Tregs from mCRPC patients have an up-regulation in genes involved in proliferation and migration, not seen in Tregs from healthy donors. This study indicates that inhibiting the influence of prostate cancer on Tregs function may enhance the efficacy of therapeutic cancer vaccines.
Acknowledgments
Grant sponsors: This research was supported by the Intramural Research Program of the Center for Cancer Research, National Cancer Institute, National Institutes of Health.
The authors thank Bonnie L. Casey and Debra Weingarten for editorial assistance in the preparation of this manuscript; Barbara Taylor and Subhadra Banerjee in the NCI FACS core facility for cell-sorting support; and Kathleen Hartman, Patricia Johnson, and Steven Shema in the NCI DNA Sequencing MiniCore for assistance in NanoString technique.
Abbreviations
- AP-1
activator protein 1
- C-FOS
FBJ murine osteosarcoma viral oncogene homolog
- C-JUN
JUN oncogene
- CTLA-4
cytotoxic T lymphocyte-associated protein 4
- DUSP1
dual specificity phosphatase 1
- FDR
false discovery rate
- FoxP3
forkhead box P3
- IPA
Ingenuity Pathway Analysis
- MAP
mitogen-activated protein
- MAPK
mitogen-activated protein kinase
- MKP
MAP kinase-specific phosphatase
- mCRPC
metastatic castration-resistant prostate cancer
- NCI
National Cancer Institute
- NK
natural killer
- NKT
natural killer T
- PBMC
peripheral blood mononuclear cell
- PCA
principal component analysis
- RGS1
regulator of G-protein signaling 1
- Treg
regulatory T cell
References
- 1.Jemal A, Siegel R, Xu J, et al. Cancer statistics, 2010. CA Cancer J Clin. 2010;60:277–300. doi: 10.3322/caac.20073. [DOI] [PubMed] [Google Scholar]
- 2.Van Poppel H, Joniau S, Van Gool SW. Vaccine therapy in patients with renal cell carcinoma. Eur Urol. 2009;55:1333–42. doi: 10.1016/j.eururo.2009.01.043. [DOI] [PubMed] [Google Scholar]
- 3.Whiteside TL. Immune responses to malignancies. J Allergy Clin Immunol. 2010;125:S272–83. doi: 10.1016/j.jaci.2009.09.045. [DOI] [PMC free article] [PubMed] [Google Scholar]
- 4.Wieckowski EU, Visus C, Szajnik M, et al. Tumor-derived microvesicles promote regulatory T cell expansion and induce apoptosis in tumor-reactive activated CD8+ T lymphocytes. J Immunol. 2009;183:3720–30. doi: 10.4049/jimmunol.0900970. [DOI] [PMC free article] [PubMed] [Google Scholar]
- 5.Ostrand-Rosenberg S. Myeloid-derived suppressor cells: more mechanisms for inhibiting antitumor immunity. Cancer Immunol Immunother. 2010;59:1593–600. doi: 10.1007/s00262-010-0855-8. [DOI] [PMC free article] [PubMed] [Google Scholar]
- 6.Sica A, Allavena P, Mantovani A. Cancer related inflammation: the macrophage connection. Cancer Lett. 2008;267:204–15. doi: 10.1016/j.canlet.2008.03.028. [DOI] [PubMed] [Google Scholar]
- 7.Berzofsky JA, Terabe M. The contrasting roles of NKT cells in tumor immunity. Curr Mol Med. 2009;9:667–72. doi: 10.2174/156652409788970706. [DOI] [PMC free article] [PubMed] [Google Scholar]
- 8.Groot Kormelink T, Abudukelimu A, Redegeld FA. Mast cells as target in cancer therapy. Curr Pharm Des. 2009;15:1868–78. doi: 10.2174/138161209788453284. [DOI] [PubMed] [Google Scholar]
- 9.Miller AM, Lundberg K, Ozenci V, et al. CD4+CD25high T cells are enriched in the tumor and peripheral blood of prostate cancer patients. J Immunol. 2006;177:7398–405. doi: 10.4049/jimmunol.177.10.7398. [DOI] [PubMed] [Google Scholar]
- 10.Baecher-Allan CM, Hafler DA. The purification and functional analysis of human CD4+CD25high regulatory T cells. Curr Protoc Immunol. 2006;Chapter 7(Unit 7):4B. doi: 10.1002/0471142735.im0704bs72. [DOI] [PubMed] [Google Scholar]
- 11.Hori S, Nomura T, Sakaguchi S. Control of regulatory T cell development by the transcription factor Foxp3. Science. 2003;299:1057–61. doi: 10.1126/science.1079490. [DOI] [PubMed] [Google Scholar]
- 12.Seddiki N, Santner-Nanan B, Martinson J, et al. Expression of interleukin (IL)-2 and IL-7 receptors discriminates between human regulatory and activated T cells. J Exp Med. 2006;203:1693–700. doi: 10.1084/jem.20060468. [DOI] [PMC free article] [PubMed] [Google Scholar]
- 13.Levings MK, Sangregorio R, Roncarolo MG. Human cd25(+)cd4(+) t regulatory cells suppress naive and memory T cell proliferation and can be expanded in vitro without loss of function. J Exp Med. 2001;193:1295–302. doi: 10.1084/jem.193.11.1295. [DOI] [PMC free article] [PubMed] [Google Scholar]
- 14.Piccirillo CA, Shevach EM. Cutting edge: control of CD8+ T cell activation by CD4+CD25+ immunoregulatory cells. J Immunol. 2001;167:1137–40. doi: 10.4049/jimmunol.167.3.1137. [DOI] [PubMed] [Google Scholar]
- 15.Lim HW, Hillsamer P, Banham AH, et al. Cutting edge: direct suppression of B cells by CD4+ CD25+ regulatory T cells. J Immunol. 2005;175:4180–3. doi: 10.4049/jimmunol.175.7.4180. [DOI] [PubMed] [Google Scholar]
- 16.Misra N, Bayry J, Lacroix-Desmazes S, et al. Cutting edge: human CD4+CD25+ T cells restrain the maturation and antigen-presenting function of dendritic cells. J Immunol. 2004;172:4676–80. doi: 10.4049/jimmunol.172.8.4676. [DOI] [PubMed] [Google Scholar]
- 17.Ghiringhelli F, Menard C, Terme M, et al. CD4+CD25+ regulatory T cells inhibit natural killer cell functions in a transforming growth factor-beta-dependent manner. J Exp Med. 2005;202:1075–85. doi: 10.1084/jem.20051511. [DOI] [PMC free article] [PubMed] [Google Scholar]
- 18.Azuma T, Takahashi T, Kunisato A, et al. Human CD4+ CD25+ regulatory T cells suppress NKT cell functions. Cancer Res. 2003;63:4516–20. [PubMed] [Google Scholar]
- 19.Sakaguchi S. Naturally arising CD4+ regulatory t cells for immunologic self-tolerance and negative control of immune responses. Annu Rev Immunol. 2004;22:531–62. doi: 10.1146/annurev.immunol.21.120601.141122. [DOI] [PubMed] [Google Scholar]
- 20.Nakamura K, Kitani A, Strober W. Cell contact-dependent immunosuppression by CD4(+)CD25(+) regulatory T cells is mediated by cell surface-bound transforming growth factor beta. J Exp Med. 2001;194:629–44. doi: 10.1084/jem.194.5.629. [DOI] [PMC free article] [PubMed] [Google Scholar]
- 21.Wing K, Onishi Y, Prieto-Martin P, et al. CTLA-4 control over Foxp3+ regulatory T cell function. Science. 2008;322:271–5. doi: 10.1126/science.1160062. [DOI] [PubMed] [Google Scholar]
- 22.Mougiakakos D, Choudhury A, Lladser A, et al. Regulatory T cells in cancer. Adv Cancer Res. 2010;107:57–117. doi: 10.1016/S0065-230X(10)07003-X. [DOI] [PubMed] [Google Scholar]
- 23.Mailloux AW, Young MR. Regulatory T-cell trafficking: from thymic development to tumor-induced immune suppression. Crit Rev Immunol. 2010;30:435–47. doi: 10.1615/critrevimmunol.v30.i5.30. [DOI] [PMC free article] [PubMed] [Google Scholar]
- 24.Gobert M, Treilleux I, Bendriss-Vermare N, et al. Regulatory T cells recruited through CCL22/CCR4 are selectively activated in lymphoid infiltrates surrounding primary breast tumors and lead to an adverse clinical outcome. Cancer Res. 2009;69:2000–9. doi: 10.1158/0008-5472.CAN-08-2360. [DOI] [PubMed] [Google Scholar]
- 25.Wang X, Zheng J, Liu J, et al. Increased population of CD4(+)CD25(high), regulatory T cells with their higher apoptotic and proliferating status in peripheral blood of acute myeloid leukemia patients. Eur J Haematol. 2005;75:468–76. doi: 10.1111/j.1600-0609.2005.00537.x. [DOI] [PubMed] [Google Scholar]
- 26.Ormandy LA, Hillemann T, Wedemeyer H, et al. Increased populations of regulatory T cells in peripheral blood of patients with hepatocellular carcinoma. Cancer Res. 2005;65:2457–64. doi: 10.1158/0008-5472.CAN-04-3232. [DOI] [PubMed] [Google Scholar]
- 27.Dannull J, Su Z, Rizzieri D, et al. Enhancement of vaccine-mediated antitumor immunity in cancer patients after depletion of regulatory T cells. J Clin Invest. 2005;115:3623–33. doi: 10.1172/JCI25947. [DOI] [PMC free article] [PubMed] [Google Scholar]
- 28.Yokokawa J, Cereda V, Remondo C, et al. Enhanced functionality of CD4+CD25(high)FoxP3+ regulatory T cells in the peripheral blood of patients with prostate cancer. Clin Cancer Res. 2008;14:1032–40. doi: 10.1158/1078-0432.CCR-07-2056. [DOI] [PubMed] [Google Scholar]
- 29.Gulley JL, Arlen PM, Madan RA, et al. Immunologic and prognostic factors associated with overall survival employing a poxviral-based PSA vaccine in metastatic castrate-resistant prostate cancer. Cancer Immunol Immunother. 2010;59:663–74. doi: 10.1007/s00262-009-0782-8. [DOI] [PMC free article] [PubMed] [Google Scholar]
- 30.Bubley GJ, Carducci M, Dahut W, et al. Eligibility and response guidelines for phase II clinical trials in androgen-independent prostate cancer: recommendations from the Prostate-Specific Antigen Working Group. J Clin Oncol. 1999;17:3461–7. doi: 10.1200/JCO.1999.17.11.3461. [DOI] [PubMed] [Google Scholar]
- 31.Geiss GK, Bumgarner RE, Birditt B, et al. Direct multiplexed measurement of gene expression with color-coded probe pairs. Nat Biotechnol. 2008;26:317–25. doi: 10.1038/nbt1385. [DOI] [PubMed] [Google Scholar]
- 32.Angel P, Karin M. The role of Jun, Fos and the AP-1 complex in cell-proliferation and transformation. Biochim Biophys Acta. 1991;1072:129–57. doi: 10.1016/0304-419x(91)90011-9. [DOI] [PubMed] [Google Scholar]
- 33.Behrens A, Sabapathy K, Graef I, et al. Jun N-terminal kinase 2 modulates thymocyte apoptosis and T cell activation through c-Jun and nuclear factor of activated T cell (NF-AT) Proc Natl Acad Sci U S A. 2001;98:1769–74. doi: 10.1073/pnas.98.4.1769. [DOI] [PMC free article] [PubMed] [Google Scholar]
- 34.Chen CY, Del Gatto-Konczak F, Wu Z, et al. Stabilization of interleukin-2 mRNA by the c-Jun NH2-terminal kinase pathway. Science. 1998;280:1945–9. doi: 10.1126/science.280.5371.1945. [DOI] [PubMed] [Google Scholar]
- 35.Garcia CA, Wang H, Benakanakere MR, et al. c-jun controls the ability of IL-12 to induce IL-10 production from human memory CD4+ T cells. J Immunol. 2009;183:4475–82. doi: 10.4049/jimmunol.0901283. [DOI] [PMC free article] [PubMed] [Google Scholar]
- 36.Rincon M, Pedraza-Alva G. JNK and p38 MAP kinases in CD4+ and CD8+ T cells. Immunol Rev. 2003;192:131–42. doi: 10.1034/j.1600-065x.2003.00019.x. [DOI] [PubMed] [Google Scholar]
- 37.Sabapathy K, Kallunki T, David JP, et al. c-Jun NH2-terminal kinase (JNK)1 and JNK2 have similar and stage-dependent roles in regulating T cell apoptosis and proliferation. J Exp Med. 2001;193:317–28. doi: 10.1084/jem.193.3.317. [DOI] [PMC free article] [PubMed] [Google Scholar]
- 38.Wotton D, Higgins JA, O’Hehir RE, et al. Differential induction of the NF-AT complex during restimulation and the induction of T-cell anergy. Hum Immunol. 1995;42:95–102. doi: 10.1016/0198-8859(94)00004-a. [DOI] [PubMed] [Google Scholar]
- 39.Kitagawa-Sakakida S, Schwartz RH. Multifactor cis-dominant negative regulation of IL-2 gene expression in anergized T cells. J Immunol. 1996;157:2328–39. [PubMed] [Google Scholar]
- 40.Lee SM, Gao B, Fang D. FoxP3 maintains Treg unresponsiveness by selectively inhibiting the promoter DNA-binding activity of AP-1. Blood. 2008;111:3599–606. doi: 10.1182/blood-2007-09-115014. [DOI] [PubMed] [Google Scholar]
- 41.Johnson GL, Lapadat R. Mitogen-activated protein kinase pathways mediated by ERK, JNK, and p38 protein kinases. Science. 2002;298:1911–2. doi: 10.1126/science.1072682. [DOI] [PubMed] [Google Scholar]
- 42.Liu Y, Shepherd EG, Nelin LD. MAPK phosphatases--regulating the immune response. Nat Rev Immunol. 2007;7:202–12. doi: 10.1038/nri2035. [DOI] [PubMed] [Google Scholar]
- 43.Zhang Y, Reynolds JM, Chang SH, et al. MKP-1 is necessary for T cell activation and function. J Biol Chem. 2009;284:30815–24. doi: 10.1074/jbc.M109.052472. [DOI] [PMC free article] [PubMed] [Google Scholar]
- 44.Ebert LM, Schaerli P, Moser B. Chemokine-mediated control of T cell traffic in lymphoid and peripheral tissues. Mol Immunol. 2005;42:799–809. doi: 10.1016/j.molimm.2004.06.040. [DOI] [PubMed] [Google Scholar]
- 45.Moser B, Loetscher P. Lymphocyte traffic control by chemokines. Nat Immunol. 2001;2:123–8. doi: 10.1038/84219. [DOI] [PubMed] [Google Scholar]
- 46.Thelen M, Munoz LM, Rodriguez-Frade JM, et al. Chemokine receptor oligomerization: functional considerations. Curr Opin Pharmacol. 2010;10:38–43. doi: 10.1016/j.coph.2009.09.004. [DOI] [PubMed] [Google Scholar]
- 47.Yu JH, Wieser J, Adams TH. The Aspergillus FlbA RGS domain protein antagonizes G protein signaling to block proliferation and allow development. EMBO J. 1996;15:5184–90. [PMC free article] [PubMed] [Google Scholar]
- 48.Agenes F, Bosco N, Mascarell L, et al. Differential expression of regulator of G-protein signalling transcripts and in vivo migration of CD4+ naive and regulatory T cells. Immunology. 2005;115:179–88. doi: 10.1111/j.1365-2567.2005.02146.x. [DOI] [PMC free article] [PubMed] [Google Scholar]
- 49.Sfanos KS, Bruno TC, Maris CH, et al. Phenotypic Analysis of Prostate-Infiltrating Lymphocytes Reveals TH17 and Treg Skewing. Clin Cancer Res. 2008;14:3254–61. doi: 10.1158/1078-0432.CCR-07-5164. [DOI] [PMC free article] [PubMed] [Google Scholar]
- 50.Jeron A, Pfoertner S, Bruder D, et al. Frequency and gene expression profile of regulatory T cells in renal cell carcinoma. Tumour Biol. 2009;30:160–70. doi: 10.1159/000228909. [DOI] [PubMed] [Google Scholar]
Associated Data
This section collects any data citations, data availability statements, or supplementary materials included in this article.