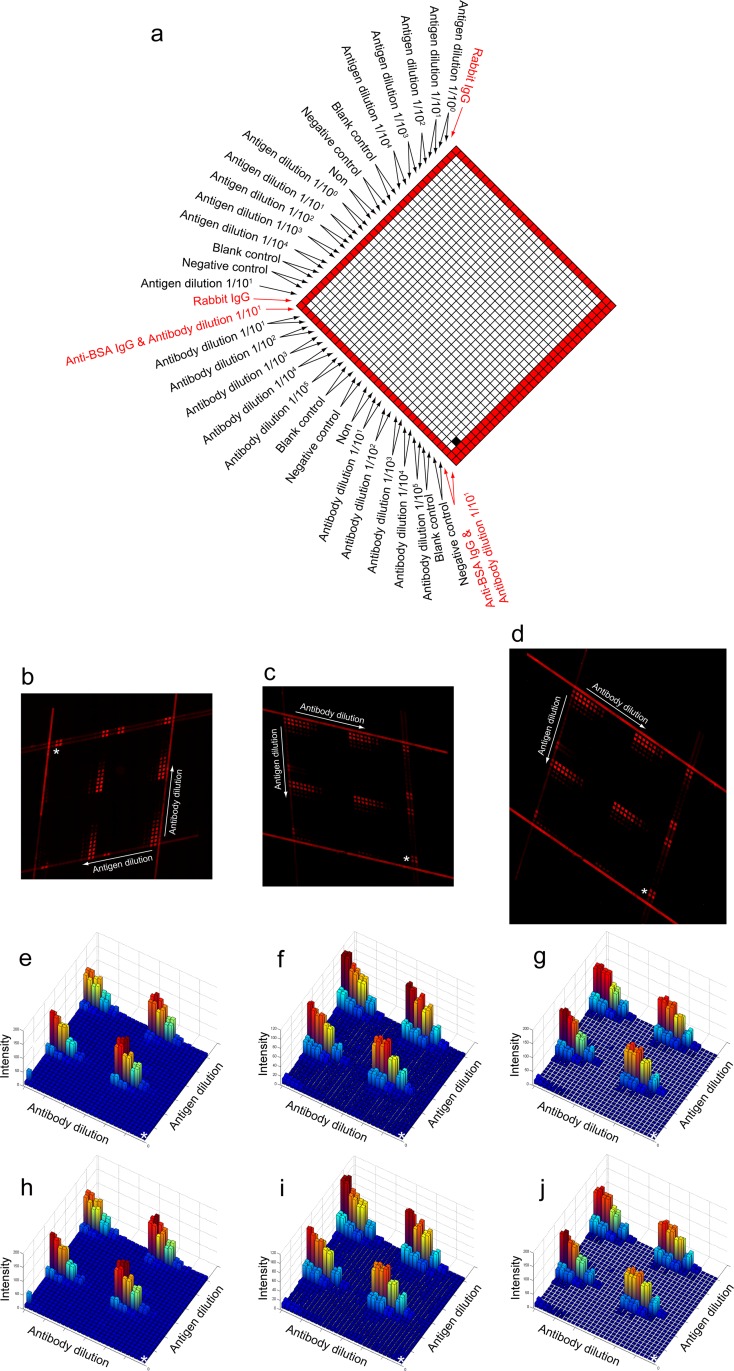
Figure 5.
The high throughput immunoassay using the closed function pattern-incorporated microfluidic network (structure 2). (a) The scheme for sample introduction. This is a concentration gradient experiment. We highlight the function patterns in red. (b)–(d) We captured the fluorescence images in different styles. (e)–(g) The 3D plots of the arithmetic mean for (b)–(d), respectively. (h)–(j) The 3D plots of the median for (b)–(d), respectively. The white asterisks in (e)–(j) indicate the origin of the 3D plots and correspond to the white asterisks in (b)–(d), respectively. This origin is shown in (a) in a black square.

