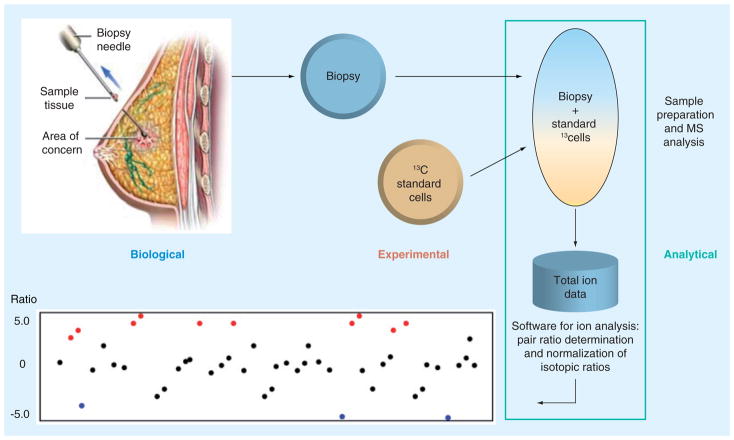
Figure 4. The Isotopic Ratio Outlier Analysis™ phenotyping application.
The material to be phenotyped is mixed with 13C (Isotopic Ratio Outlier Analysis) cells and/or standard compounds that allow one to find and pair all peaks. The deviation from the standard is diagnostic of the sample’s biochemical phenotype.

