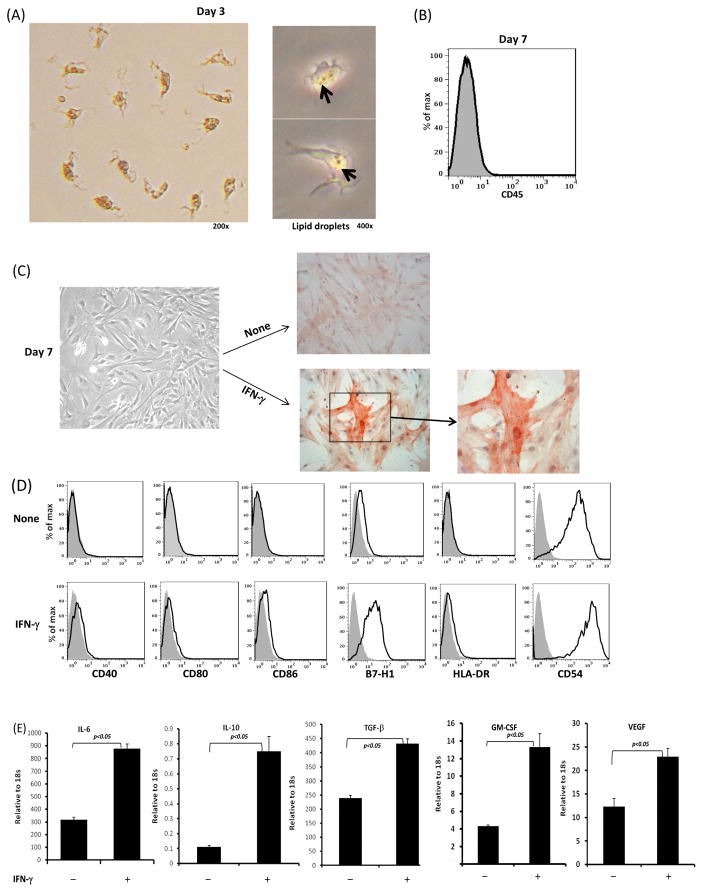
Figure 1. Phenotypic analysis of human HSCs.
Cells were isolated from the tissue of a donor liver the size of which needed to be reduced for transplantation, enriched for HSCs through percoll gradient centrifugation, and cultured in uncoated plastic plates as described in Materials and Methods. (A) Images of HSCs at day 3 of culture. The pictures in right panel were taken through the phase contrast microscope, showing the intra-cellular lipid droplets. (B) HSCs at day 7 of culture show without contamination of CD45+ hematopoietic cells as determined by flow analysis (histogram). Shaded profile represents isotype control. (C) INF-γ stimulation enhances HSCs activation. HSCs were exposure to INF-γ (100U/μl) for the last 18 hours of culture (7 days). Expression of α-SMA was determined by immunohistochemical staining (red). (D) Expression of surface key molecules on HSCs determined by flow analysis with or without INF-γ stimulation. (E) Expression of key cytokine mRNA in HSCs. RNA was isolated from the cells harvested after culture for 7 days with or without IFN-γ stimulation. Expression of cytokines was determined by q-PCR. The data are representative of three separate experiments.

