

Abstract
Host response to cancer signals has emerged as a key factor in cancer development; however, the underlying molecular mechanism is not well understood. In this report, we demonstrate that activating transcription factor 3 (ATF3), a hub of the cellular adaptive response network, plays an important role in host cells to enhance breast cancer metastasis. Immunohistochemical analysis of patient tumor samples revealed that expression of ATF3 in stromal mononuclear cells, but not cancer epithelial cells, is correlated with worse clinical outcomes and is an independent predictor for breast cancer death. This finding was corroborated by data from mouse models showing less efficient breast cancer metastasis in Atf3-deficient mice than in WT mice. Further, mice with myeloid cell–selective KO of Atf3 showed fewer lung metastases, indicating that host ATF3 facilitates metastasis, at least in part, by its function in macrophage/myeloid cells. Gene profiling analyses of macrophages from mouse tumors identified an ATF3-regulated gene signature that could distinguish human tumor stroma from distant stroma and could predict clinical outcomes, lending credence to our mouse models. In conclusion, we identified ATF3 as a regulator in myeloid cells that enhances breast cancer metastasis and has predictive value for clinical outcomes.
Introduction
Cancers are not simply autonomous masses of cells; they secrete soluble factors to elicit systemic responses from the host, and the host responses, in turn, affect cancer cells (1–6). A key target tissue for cancer cells to modulate the host is the bone marrow, which provides precursor cells for various immune cells and mesenchymal cells (7). These precursor cells can be recruited to the primary tumor site; there, they differentiate and become a part of the tumor stroma or microenvironment — in addition to the resident stromal cells. Stromal cells secrete soluble factors to exert their influence on cancer cells, which in turn secrete factors to influence the stromal cells, forming a loop of stroma-cancer interactions.
A key functional consequence of the host responses at the early stage of cancer development is antitumor inflammatory response, where the innate immunity cells (such as macrophages and mast cells) and adaptive immunity cells (such as T and B cells) work together to inhibit cancer progression. However, over time, these immune responses are co-opted by the cancer cells; they become tumor promoting, rather than tumor inhibiting. Thus, the host inflammatory response is a double-edged sword and plays a dichotomous role in cancer development (8–10). Among various immune cells, macrophages/myeloid cells have been widely studied in the cancer context, and their dichotomy is well documented (11, 12). The current view is that, upon “education” or “co-option” by the cancer cells, tumor-associated macrophages (TAMs) express different sets of genes, contributing to their conversion from anticancer to procancer (11, 12). One set of such genes is the so-called M1 and M2 genes, where the M1 genes (such as Il6 and Il12) are expressed under acute inflammation, and the M2 genes (such as Tgfb and Arg1) are expressed under chronic inflammation. This M1 to M2 skew is believed to contribute to the procancer change in macrophage bioactivity in the cancer environment (13). Another set of genes critical for macrophage bioactivity encodes proteins that remodel the ECM; these proteins include MMPs, a disintegrin and metalloproteases (ADAMs), ADAMs with thrombospondin type I motifs (ADAMTSs), and tissue inhibitors of metalloproteases (TIMPs). Since ECM remodeling plays an important role in cancer cell invasion and metastasis (14), regulating the expression of these ECM remodeler genes is critical for the ability of macrophages to affect cancer progression. Despite the emerging appreciation for cancer-host interaction in metastasis, our understanding of how the host cells, including macrophages/myeloid cells, respond to the cancer signals and turn on their prometastatic programs is rudimentary. It is likely that cancer cells hijack the existing machineries or molecules in the host cells to accomplish this. In the present study, we found that the cellular adaptive response was hijacked in this process. Specifically, we identified activating transcription factor 3 (ATF3) as a molecule that regulated the host response and contributed to the co-option of the host by cancer cells to promote metastasis. ATF3 is a member of the ATF/CREB family of transcription factors (15–17). Overwhelming evidence indicates that ATF3 is encoded by an immediate early gene, whose expression in most — if not all — cell types is low or undetectable, but can be induced by various extra- and intracellular signals (18). Based on these and other findings, we put forth the idea that Atf3 can be viewed as a “hub” of the cellular adaptive response network that helps cells to adapt to disturbances of homeostasis (19, 20).
Previously, we demonstrated that ATF3 plays an oncogenic role in MCF10CA1a breast cancer epithelial cells (21, 22): (a) it protects the cells from stress-induced cell cycle arrest, (b) it enhances their cell motility and epithelial-to-mesenchymal transition (EMT), and (c) it increases their tumor initiating cell features, as evidenced by mammosphere assay and tumor formation after limited dilution. Furthermore, we found that ATF3 mediates the effect of TGF-β and positively feeds back on TGFB (22), providing a potential explanation for the ability of ATF3 to enhance cell motility and EMT — 2 key consequences of TGF-β signaling. The oncogenic role of ATF3 was also demonstrated by a transgenic mouse approach expressing ATF3 under the cytokeratin 5 promoter (23). Importantly, the ATF3 gene was amplified in approximately 80% of the 48 human breast tumors examined, and its expression was elevated in the tumors (21, 23). Since no mutations were found in the open reading frame of the ATF3 gene (21), its elevated expression suggested an oncogenic role of ATF3 in human breast cancer development, consistent with findings from cultured cells and mouse models. In testing whether ATF3 — in the breast cancer epithelial cells — has any clinical relevance, we surprisingly found that it did not correlate with any clinical parameters. Rather, the expression of ATF3 in the stroma, specifically the mononuclear cells, correlated with worse outcome. Our findings, as well as additional findings from mouse models, shed light on an important role of ATF3 in the host, particularly in the myeloid cells. We thereby suggest that, as an adaptive response gene, Atf3 mediates the myeloid response to signals in the cancer environment and enhances metastasis. Since Atf3 is induced by many stress signals relevant to the cancer environment, our findings have significant implications. These implications and the roles of ATF3 in cancer epithelial cells versus myeloid cells are discussed below.
Results
ATF3 is expressed in the mononuclear cells of human breast tumors, and its expression correlates with worse clinical outcome.
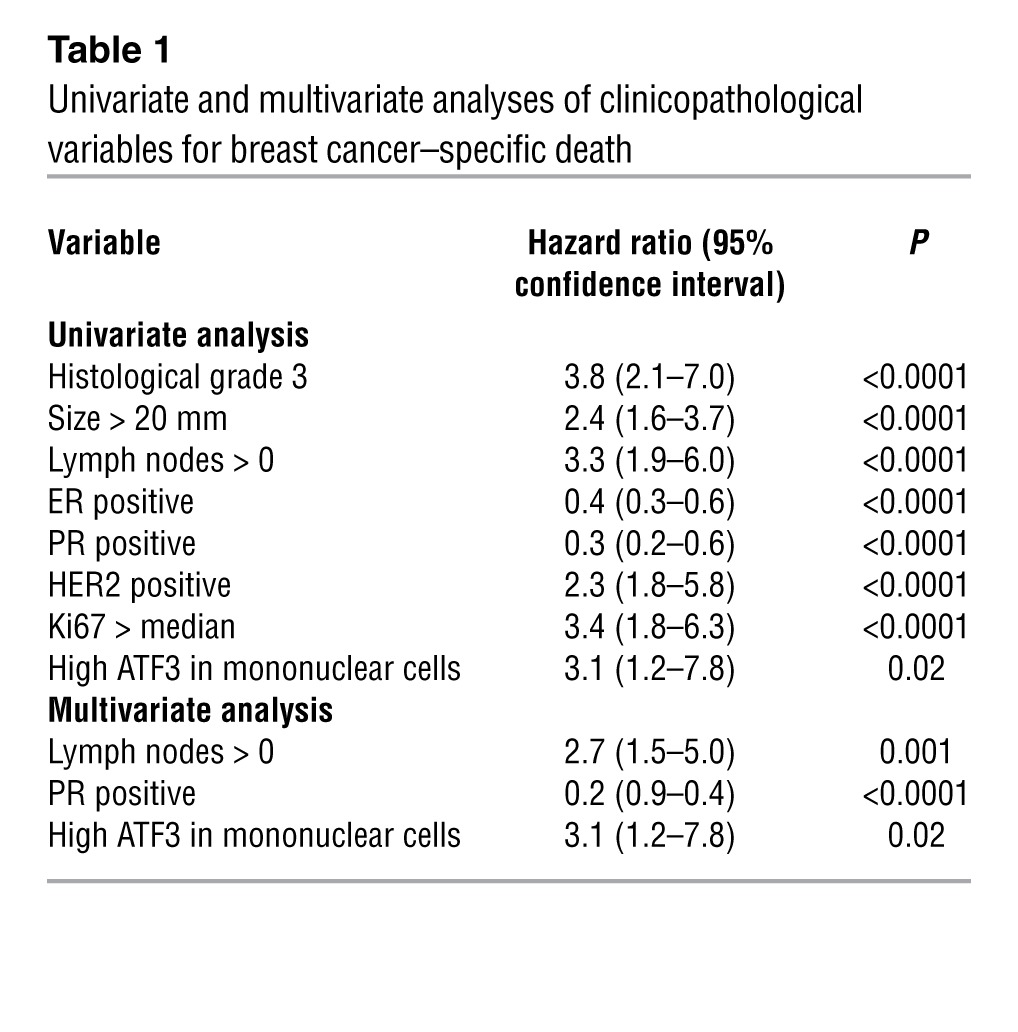
To test whether ATF3 — in breast cancer epithelial cells — correlates with clinical outcome, we first analyzed publicly available RNA array datasets with outcome information (Oncomine) and found that high ATF3 expression correlated with reduced survival (Figure 1A) and lower metastasis-free survival (Figure 1B). Because RNA microarrays analyze RNAs derived from the entire tumor, they do not provide information on protein levels and do not distinguish stroma from cancer cells. We therefore examined ATF3 in human breast tumor samples by immunohistochemistry. As expected, ATF3 was expressed in cancer epithelial cells (pan-keratin+); however, ATF3 was also expressed in the stroma (Figure 1C). To test whether ATF3 expression correlates with clinical outcomes, we analyzed a tumor microarray (292 patient samples) with accompanying outcome data and other clinical information by immunohistochemistry. A board-certified pathologist scored ATF3 signals separately in epithelial cells and stroma, specifically the mononuclear cells (based on morphology), using the Allred system. Surprisingly, ATF3 in the epithelium did not correlate with any clinical parameters. However, high ATF3 expression (score ≥ 4) in mononuclear cells correlated with high Ki67 in the tumor (P = 0.005) and worse outcome (Figure 1D and Table 1; Kaplan-Meier survival analysis, hazard ratio, 3.1; 95% confidence interval, 1.2–7.8; P = 0.02). Importantly, multivariate analysis indicated that high ATF3 in mononuclear cells was an independent predictor of breast cancer–specific death in this cohort (Table 1). However, ATF3 expression did not correlate with tumor size, histological grade, PR, HER2 FISH, or lymph node status. Since macrophages are well documented to modulate cancer development (24, 25), we examined ATF3 expression in these cells by staining for ATF3 and CD68, a macrophage marker. Some CD68+ cells, but not all, corresponded to ATF3+ cells (Figure 1E). Using coimmunofluorescence, we analyzed 11 breast carcinoma samples that contained macrophage infiltrates. We scored on average approximately 2,000 macrophages per patient sample, depending on macrophage abundance, and found that the percentage of CD68+ cells expressing ATF3 ranged from 10% to 30% (15% ± 2%). An example of the coimmunofluorescent images is shown in Figure 1F. Since CD68 has been shown to be expressed in cells other than macrophages (26), we also carried out immunofluorescence for ATF3 and CSF1R, a marker more selective to macrophages than CD68 (26). Only a portion of the CSF1R+ cells expressed ATF3 (estimated 13%–17%; 3 patient samples averaging ∼500 macrophages analyzed per patient; see Supplemental Methods; supplemental material available online with this article; doi: 10.1172/JCI64410DS1). An example of the coimmunofluorescent images is shown in Figure 1G. Importantly, the lack of ATF3 in 100% of CSF1R+ cells indicates that ATF3 is not simply a marker for the CSF1R cells; rather, we posit that it is an indicator of stressed cells. The Allred system used to score the immunohistochemistry signals in the tumor microarray considers both the staining intensity and the percentage of positive cells. Thus, a higher percentage of ATF3+ cells, presumably reflecting more stressed tumor microenvironment, will contribute to a higher score. Taken together, our data indicate that ATF3 expression in the mononuclear cells of human breast tumors predicts worse outcomes, but its expression in epithelial cells does not. These results prompted us to test whether ATF3 in the host (stroma) affects mammary carcinoma progression in mouse models.
Figure 1. ATF3 expression in human breast tumors correlates with worse patient outcome.

(A) Patients from 2 independent RNA microarray datasets — Sorlie et al. (54) and van’t Veer et al. (55) — were arbitrarily classified into ATF3-high (above median) and ATF3-low (below median) groups. Kaplan-Meier curves of their 5-year survival are shown. (B) Same as A, except from a dataset with lung metastasis-free survival rate (56). (C) Serial sections of human breast tumors were analyzed by immunohistochemistry for ATF3 or pan-keratin (an epithelial marker) and counterstained with hematoxylin. Arrow indicates ATF3 staining in the stroma. (D) Immunohistochemistry signals in a tumor microarray was scored by a pathologist in a blinded fashion using the Allred system. Kaplan-Meier survival curves for high (score > 4) and low ATF3 expression in mononuclear cells are shown. (E) Same as C, except ATF3 and CD68 (a macrophage marker) were analyzed. Red outlines indicate a cluster of TAMs. (F and G) Examples of images for ATF3 and CD68 (F) or ATF3 and CSF1R (G) coimmunofluorescence in breast carcinoma samples. Red, ATF3; green, CD68 or CSF1R; blue, Topro-3 (nuclei). Arrowheads indicate cells with ATF3 expression; arrows indicate those without. Dashed lines demarcate cell boundaries. Scale bars: 100 μm (C, E, and F and G, left); 5 μm (F and G, right). *P < 0.05, log-rank test.
Table 1.
Univariate and multivariate analyses of clinicopathological variables for breast cancer–specific death
Atf3 expression in the host facilitates mammary carcinoma metastasis: increase in circulating tumor cells and lung colonization.
We compared Atf3+/+ and Atf3–/– mice (referred to throughout as WT and KO, respectively) for their ability to support mammary carcinoma progression using a syngeneic, orthotopic injection model. The KO mice described previously are in the C57BL/6 background (27). We thus generated a breast cancer cell line derived from this strain of mice using primary tumors from the transgenic mice expressing polyoma middle T-antigen (PyMT) under the control of the murine mammary tumor virus (MMTV) promoter (MMTV-PyMT in C57BL/6 background; ref. 28). These cancer cells are Atf3+/+ and are referred to herein as PyMT cells. We injected the cells into the mammary fat pads of the WT or KO mice, removed the primary tumors when they reached approximately 1.2 cm3, and examined lung metastasis 2 months later (around day 85; Figure 2A). The PyMT cancer cells developed primary tumors in the WT and KO hosts at a similar rate (Figure 2B). However, they metastasized more efficiently in the WT than KO mice, as judged by the percentage of mice that developed lung nodules, the number of lung nodules per mouse, and lung metastasis burden per mouse (Figure 2, C–E). Representative lung images are shown in Figure 2F. Since the cancer cells were the same (Atf3+/+) and the primary tumor growth was the same, our data suggest that ATF3 in the host facilitates metastasis.
Figure 2. Atf3 deficiency in the host reduces metastasis, but not primary tumor growth.

(A) Orthotopic injection model in C57BL/6 mice. (B) Primary tumors from WT (Atf3+/+; n = 16) or KO (Atf3–/–; n = 14) mice injected with PyMT cells were measured. A representative result from 3 experiments is shown. P = NS, Mann-Whitney test. (C) Lung nodules at day 85 were analyzed for percent mice that developed lung metastases. Numbers above bars indicate metastasis incidence. *P < 0.05, χ2 test. (D) Lung nodules at day 85 were analyzed for numbers of lung nodules per mouse. *P < 0.05, Student’s t test. (E) Lung nodules at day 85 were analyzed for lung burden per mouse (as rank orders; WT n = 16, KO n = 14). *P < 0.05, Mann-Whitney test. (F) Representative images of lungs at day 85. Arrows indicate metastases. (G) Orthotopic injection model in FVB/N mice. (H) Primary tumors from WT or KO mice injected with MVT-1 cells were analyzed as in B. A representative result from 2 experiments is shown (n = 5). P = NS, Mann-Whitney test. (I) Mice from H at day 35 were analyzed as in C for percent developed lung metastases. *P < 0.01, χ2 test. (J) Mice from H at day 35 were analyzed for lung nodule numbers per mouse (n = 11). *P < 0.001, Mann-Whitney test. (K) Representative images at day 35. Arrows indicate metastases.
To test whether the effect of host ATF3 is affected by the mouse strain, we generated homozygous KO mice in the FVB/N strain by 10 backcrosses. We then injected the WT or KO FVB/N mice with Met-1 cells, which were derived from FVB/N transgenic mice expressing the PyMT oncogene (29). Again, KO hosts showed similar primary tumor progression to WT hosts, but reduced lung metastasis (Supplemental Figure 1, A–C), indicating that the effect of host ATF3 is not strain specific. Importantly, because Met-1 cells were derived from the same oncogene we used to produce the PyMT cells (see above), this result also alleviated the concern that our results are due to the clonal-specific effect of the cancer cells. We also repeated the experiment using the MVT-1 mammary carcinoma cell line, which was derived from FVB/N mice expressing 2 transgenes — VEGF and cMyc — by the MMTV promoter (30). Again, these cells are Atf3+/+. This model takes 35 days to finish (versus 85–90 days in the model above) and does not require primary tumor removal, since lung metastasis was already detectable by day 35 (Figure 2G). Similar to the above results, host ATF3 status did not affect primary tumor growth (Figure 2H), but significantly enhanced lung metastasis, judged by the percentage of mice that developed lung nodules and by the number of lung metastasis per mouse (Figure 2, I and J). Representative lung images are shown in Figure 2K. Thus, the effect of host ATF3 was observed in 2 mouse strains (C57BL/6 and FVB/N) using cancer cells derived from different transforming events (PyMT and VEGF+cMyc).
Cancer cells take several steps to metastasize: invade the stroma, intravasate, survive in the blood, extravasate, and colonize distant sites. To assess the steps contributing to the reduced metastasis in KO mice, we examined the circulating tumor cells (CTCs) in the blood to assess the combined effect of the first 3 steps. We isolated cells from the blood and examined their mRNAs for PyMT (for the PyMT model) or cMyc (for the MVT-1 model) by RT coupled with quantitative PCR (RT-qPCR) as a marker for cancer cells. The marker RNA level was much lower in the tumor-bearing KO mice than that in the WT counterpart (Figure 3, A and D), which suggests that cancer cells in the KO mice had defects in early steps of metastasis. We next examined whether the host ATF3 affects extravasation and colonization by injecting the mammary carcinoma cells into the circulation via tail vein. As shown in Figure 3, B and E, breast cancer cells colonized the lung more efficiently in WT than KO hosts in both the PyMT and MVT-1 models. Representative lung images are shown in Figure 3, C and F. We also repeated the experiment using the Met-1 breast cancer cells and found reduced lung colonization in KO hosts (Supplemental Figure 1, D and E). Taken together, our data from CTCs and lung colonization assay indicate that host ATF3 facilitates mammary carcinoma metastasis by affecting both early and late steps. This conclusion was further supported by our in vitro coculture assays (see below), which demonstrated that ATF3 in the macrophage — a host cell known to play an important role in modulating cancer development — promoted the ability of macrophages to stimulate cancer cell invasion and transendothelial migration.
Figure 3. Atf3 deficiency in the host impairs both early and late events in metastasis.

(A) WT and KO C57BL/6 mice were injected with PyMT cells at mammary fat pad. 25 days later, blood cells were isolated and analyzed by RT-qPCR for PyMT as an indicator for CTCs. Blood cells from WT mice with no PyMT cell injection were used as a control. Signals were standardized against tubulin, and the standardized signal from the control mice was arbitrarily defined as 1. A representative result from 2 experiments is shown (n indicated above bars). *P < 0.05, Mann-Whitney test. (B) WT (n = 10) and KO (n = 7) C57BL/6 mice were injected with PyMT cancer cells by tail vein, and lung nodules per mouse were counted at 90 days after injection. A representative result from 3 experiments is shown. Data are expressed as nodule area (pixels) per lung (pixels). *P < 0.05, Mann-Whitney test. (C) Representative images of lungs from B. (D) Same as A, except FVB/N mice injected with MVT-1 cells were analyzed at day 35 for cMyc. A representative result from 2 experiments is shown. *P < 0.05, Mann-Whitney test. (E) Same as B, except FVB/N mice injected with MVT-1 cells were analyzed at day 18 for lung nodule area using NIH ImageJ. A representative result from 3 experiments is shown (n = 10). *P < 0.001, Mann-Whitney test. (F) Representative images of H&E stain of lungs from E.
We also tested the role of ATF3 using a transgenic model, comparing the MMTV-PyMT mice in the KO background (Atf3–/–-Tg[MMTV:PyMT]) with those in the WT background (Atf3+/+-Tg[MMTV:PyMT]). As shown in Supplemental Figure 1, F and G, the primary tumor and lung metastasis were reduced in the KO background. Since the status of Atf3 differed between WT and KO transgenic mice in both the cancer epithelial cells and the host cells (the noncancer cells in the organism), this model does not distinguish the role of ATF3 in the host cells from that in the cancer cells. In addition, interpretation of these transgenic mouse data is potentially complicated by the dichotomous role of ATF3 in the cancer epithelial cells (22).
ATF3 alters host systemic environment.
Since soluble factors are an integral part of the mechanisms for cancer-host interaction, we analyzed plasma by an antibody array from 4 groups of mice: (a) tumor-bearing WT, (b) tumor-bearing KO, (c) normal WT, and (d) normal KO. The array detects 308 proteins, including various cytokines, chemokines, and MMPs. We focused on candidates that fit the following criteria: (a) soluble proteins, (b) modulated (up- or downregulated) by tumor development in the WT plasma, and (c) differential levels in KO versus WT tumor-bearing mice. 107 candidates met these criteria; among them, 27 have been demonstrated in the literature to play an important role in metastasis (Supplemental Figure 2A). Supplemental Figure 2B shows results for osteopontin (OPN), IL-9, and MMP9. Thus, ATF3 in the host contributes to an altered systemic environment that correlates with enhanced metastasis.
The macrophage/myeloid is a key cell type in which ATF3 plays a functionally important role to facilitate metastasis.
A key site where cancer cells exert their actions (via soluble factors) to elicit host response is the bone marrow (2, 6). Therefore, we tested whether bone marrow transplantation can transfer the phenotype. KO bone marrow reduced lung nodule burden in the WT recipients (Figure 4A). Representative lung images are shown in Figure 4B. Control analysis for Atf3 status showed efficient replacement of the blood cells in the recipient mice by the transplanted cells (Figure 4C). Thus, ATF3 in the bone marrow plays a key role in host-enhanced metastases. Since bone marrow provides precursors for multiple cells (hematopoietic cells, mesenchymal cells, and endothelial cells; ref. 7), it is not clear in which cell types ATF3 plays an important role. Our mononuclear cell and macrophage data from human breast tumor samples (Figure 1, D–G) prompted us to examine the functionality of ATF3 in macrophage/myeloid cells in our mouse models. We first determined whether Atf3 is expressed (induced) in the TAMs in our mouse models. Immunohistochemistry and coimmunofluorescent analysis of primary tumors for ATF3 and F4/80, a macrophage marker, showed that Atf3 was expressed in TAMs of both PyMT and MVT-1 tumors (Figure 5A and Supplemental Figure 3, A and B): approximately 35% of F4/80+ cells expressed Atf3 in the PyMT model (2 mice, ∼100 F4/80+ cells counted), and approximately 25% in the MVT-1 model (2 mice, ∼800 F4/80+ cells counted). We interpret this to mean that Atf3 is induced in TAMs by signals present in the tumor microenvironment. Consistent with this notion, Atf3 was induced in bone marrow–derived macrophages by IL-4, TGF-β, hypoxia, and coculture with cancer cells (Supplemental Figure 4).
Figure 4. ATF3 is functionally important in macrophage/myeloid cells.

(A) WT C57BL/6 mice transplanted with WT or KO bone marrow–derived cells were injected with PyMT cancer cells and analyzed as in Figure 3E (n = 5). *P < 0.01, Mann-Whitney test; from 1 of 2 experiments. (B) Representative images of lungs from A. (C) Engraftment was assessed by analyzing blood cells for Atf3 using RT-qPCR. Standardized signals (against tubulin) from WT transplantation were defined as 1 (n = 5). *P < 0.05, Mann-Whitney test. (D) Atf3 flox allele (Atf3f). (E) Peritoneal macrophages (MΦ) from CKO (Atf3f/f/LysM-Cre) or control (Atf3+/+/LysM-Cre) mice were analyzed. Left: Genomic DNA by PCR for the indicated alleles (F, floxed; R, recombined; W, WT). Reference (Ref.) lane shows the position of the PCR products for the WT and floxed alleles on the same gel. Right: Protein extract by immunoblot. (F) CKO and control mice were injected with MVT-1 cells at fat pads, and their primary tumors were measured (n = 9). From 1 of 3 experiments. (G) Lung nodules from F were counted at day 35. *P < 0.05, Mann-Whitney test. (H) Same as G, except tail vein injection. *P < 0.01, Mann-Whitney test.
Figure 5. Atf3 deficiency affects the gene expression, but not the abundance, of TAMs in primary tumors.

(A) Primary tumors from WT or KO mice injected with PyMT cancer cells were analyzed by coimmunofluorescence for ATF3 (red) and F4/80 (green), with Topro-3 stain for nuclei (blue). Arrowheads indicate macrophages with Atf3 expression; arrows indicate macrophages without Atf3 expression. The ATF3+ cells in the KO panel are presumably the cancer cells, since PyMT cells are Atf3+/+. (B) Primary tumors in A were analyzed by immunohistochemistry (left) and flow cytometry (right) for F4/80+ cells (n = 5). P = NS, Mann-Whitney test. (C) Cancer cells and TAMs from primary tumors in A were isolated using magnetic beads and analyzed by RT-qPCR for F4/80, Epcam, and Atf3 (n = 6). The following standardized signals (against tubulin) were arbitrarily defined as 1: Epcam in WT cancer cells, F4/80 and Atf3 in WT TAMs. *P < 0.01, Mann-Whitney test; from 1 of 2 experiments. (D and E) Same as C, except that only TAMs were analyzed for the indicated genes. Standardized signals (against tubulin) from WT cells were arbitrarily defined as 1 (n = 6). *P < 0.01, #P ~ 0.07, Mann-Whitney test; from 1 of 2 experiments. (F) Genes regulated by ATF3 in TAMs based on the cRNA array data were analyzed by IPA; a subset of the enriched biological functions is shown. Dashed lines denote the P = 0.05 threshold. Scale bars: 15 μm (A); 100 μm (B).
To test whether Atf3 expression in the macrophage/myeloid is functionally important, we generated conditional KO (CKO) mice that contain the homozygous Atf3 flox allele (Atf3f; Figure 4D) and the LysM-Cre allele, which harbors a knockin of the Cre recombinase in the LysM locus (31) and has been widely used to generate myeloid-selective KO (or knockdown). Supplemental Figure 5 shows the targeting vector and characterization of the ES cells. Analyses of the resulting Atf3f/f/LysM-Cre CKO mice showed efficient recombination of the flox alleles (as determined by PCR) and near-undetectable level of ATF3 protein (as determined by immunoblot) in the peritoneal macrophages (Figure 4E). Importantly, upon orthotopic injection of the MVT-1 mammary carcinoma cells, CKO mice had reduced lung metastasis compared with ATF3+/+/LysM-Cre control mice (P < 0.05; Figure 4G), although their primary tumor growth was comparable (Figure 4F). Lung colonization assay (tail vein injection of cancer cells) showed a similar result (Figure 4H). One caveat of interpreting the above results is that LysM drives expression not only in macrophages, but also in neutrophils (31). However, Atf3 was not induced in tumor-associated neutrophils in either the PyMT or the MVT-1 model (Supplemental Figure 3C; 2 mice each, ∼150–200 Ly6G+ cells scored), which indicates that the phenotypes observed in CKO mice can be mainly attributed to the deletion of Atf3 in macrophages.
The above data from CKO mice indicate that ATF3 is necessary for macrophages/myeloid cells to enhance metastasis; however, they did not address the issue of sufficiency. We carried out a sequential injection experiment by delivering WT or KO CD11b+ myeloid cells into tumor-bearing KO mice (Supplemental Figure 6A). The WT myeloid cells performed better than their KO counterparts in promoting lung metastasis (Supplemental Figure 6B), although their primary tumor size was not affected (data not shown). Since the recipient mice were Atf3–/–, all host cells (except those derived from the injected CD11b+ cells) lacked Atf3, which suggests that ATF3 in myeloid cells is sufficient to promote metastasis. We also performed a rescue experiment by ectopically expressing ATF3 in the KO myeloid cells via retroviral transduction using the CD68 promoter, a macrophage-selective promoter. Mice injected with the ATF3-transduced cells showed higher lung metastasis than that with control-transduced cells (Supplemental Figure 6, C–E). Thus, ectopic expression of ATF3 can rescue the ability of KO myeloid cells to enhance metastasis.
Since macrophage recruitment to primary tumors plays an important role in cancer progression, we asked whether its recruitment differs in the WT and KO hosts. We examined primary tumors for macrophages by immunohistochemistry and flow cytometry. No difference in macrophage abundance between WT and KO hosts was observed (Figure 5B). Since ATF3 was found to be functionally important in myeloid cells for host-enhanced metastasis, this lack of difference in their recruitment suggested that ATF3 may affect macrophage bioactivity. We isolated WT and KO TAMs by magnetic beads (based on F4/80+); RT-qPCR analyses of control genes confirmed the enrichment of macrophages (Figure 5C). We then compared WT and KO TAMs for a few M1 and M2 genes, since their expression affects macrophage bioactivity (13). Arg1 was found to be higher in WT than in KO TAMs, but the opposite was observed for Il12 (Figure 5D). Thus, ATF3 (directly or indirectly) upregulates Arg1 (an M2 gene), but downregulates Il12 (an M1 gene), suggestive of an M2 (procancer) skew by ATF3. We also compared WT and KO TAMs for several ECM remodelers (MMPs and MMP regulators) known to be expressed in macrophages and known to modulate cancer cell invasiveness (14, 32, 33). Mmp9 mRNA was reduced in KO versus WT TAMs (P < 0.01; Figure 5E). Importantly, MMP9 protein was also reduced in KO plasma, as indicated by antibody array (Supplemental Figure 2). Thus, we subsequently focused on Mmp9. We noted that Mmp2 and Adam15 showed some differences, but these were not statistically significant (P ∼ 0.08 and P ∼ 0.06, respectively). More investigation is required to address whether ATF3 affects their expression. To gain broader insight into the effect of ATF3 on macrophage gene expression, we carried out cRNA microarray analysis (Agilent mouse oligo array) using TAMs isolated from the WT and KO tumor-bearing mice by fluorescence-activated cell sorting (∼94% purity; Supplemental Figure 7A). We identified 478 genes regulated by ATF3. Ingenuity Pathway Analysis (IPA) showed that the top 3 molecular and cellular functions regulated by ATF3 in TAMs were cell movement, cell growth, and cell-cell communication (Figure 5F). The cell-cell communication function is of particular interest and is discussed below.
Mmp9 is a direct target gene of ATF3 in macrophages and is functionally important for WT macrophages to enhance cancer cell invasiveness and transendothelial migration in vitro.
The finding of reduced Mmp9 mRNA in KO TAMs suggested that Mmp9 is a downstream target gene of ATF3, directly or indirectly. Given the importance of MMP9 in ECM remodeling (14), we tested whether it is functionally important in the context of ATF3 using in vitro assays. When grown on a laminin-rich Matrigel (mimicking ECM), mammary epithelial cells form a 3D structure (34), and WT macrophages induce this structure to make protrusions (35), an indication of invasiveness in vitro (36). Time-lapse analyses showed a dynamic process of macrophage interaction with the 3D structure (Supplemental Figure 8A). Significantly, the KO macrophages were less efficient than the WT macrophages at inducing 3D invasion in MCF10A cells (Figure 6A). Nuclear stain indicated that the invasive structure was made of cells, not just membrane (Figure 6A); representative invasive versus noninvasive 3D images are also shown. We obtained similar results (Supplemental Figure 8B) using PyMT mammary carcinoma cells, which are derived from tumors and differ from MCF10A, an immortalized but not transformed cell line. Using retroviral transduction, we tested whether ATF3 add-back can rescue the phenotype of the KO macrophages. ATF3 retrovirus partially rescued the phenotype, but the control virus expressing Venus did not (Figure 6B). The partial rescue may be due to the partial transduction of the macrophages (∼40%; Supplemental Figure 8C). Taken together, our results indicate that ATF3 is necessary for the macrophages to induce breast epithelial cell invasion in vitro.
Figure 6. MMP9 plays a role in the ability of ATF3 in macrophages to facilitate invasiveness in vitro.

(A) Left: 3D structures of MCF10A cells were cocultured without (–) or with WT or KO bone marrow–derived macrophages. Percent 3D structures with invasion was scored as in Methods (3 experiments). *P < 0.05, Mann-Whitney test. Right: Phase-contrast (top) and immunofluorescent (bottom) images. Green, laminin V (basement membrane); blue, Topro-3 (nuclei). Arrows denote basement membrane disruption. (B) Same as A, but macrophages were transduced with retrovirus expressing ATF3 or control (Venus). (C) Same as A, but macrophages were treated with MMP9 inhibitor (MMP9-i) or with vehicle (V). (D) Raw264.7 macrophage cells expressing vector or ATF3 were analyzed for Mmp9 by RT-qPCR (left) or zymogram (right). The standardized Mmp9 mRNA signal (against tubulin) from vector-expressing cells was defined as 1. (E) Same as D, but percent 3D structures with invasion was scored (from 3 experiments). *P < 0.05, Mann-Whitney test. (F) Left: Same as D, but ATF3-expressing Raw cells were used and transfected with Mmp9 or control siRNA before coculture with the 3D structures. Right: Knockdown efficiency was tested by RT-qPCR. (G) ChIP analysis using IgG control or ATF3 antibody for Mmp9 promoter in Raw cells (representative from 3 experiments). *P < 0.05, Student’s t test. (H) Same as G, but primary macrophages were used (left, qPCR; right, gel). Scale bars: 50 μm (A).
To test whether MMP9 is functionally important for ATF3-enhanced invasion, we used a selective chemical inhibitor, MMP9 Inhibitor I. The inhibitor dampened the ability of WT macrophages to induce 3D structure invasion, but had no effect on KO macrophages (Figure 6C). We also took an alternative approach by ectopically expressing ATF3 followed by knocking down Mmp9 or control knockdown using the RAW264.7 macrophage cell line. Our results demonstrated that ectopically expressing ATF3 in RAW264.7 cells increased their MMP9 level and their ability to enhance the 3D structure invasion, and that this effect of ATF3 could be diminished by knocking down Mmp9 (Figure 6, D–F). To test whether Mmp9 is a direct target of ATF3, we examined the binding of ATF3 to the Mmp9 promoter, which contains 2 ATF/CRE-like sites within approximately 500 bp of its transcriptional initiation site. As shown by ChIP assay, ATF3 bound the Mmp9 promoter in both RAW264.7 cells (Figure 6G) and WT bone marrow–derived macrophages (Figure 6H). The specificity of the ChIP signals was indicated by the lack of signals using control IgG or KO macrophages. Thus, Mmp9 is likely a direct and functionally important target gene of ATF3 in macrophages, in the context of in vitro 3D invasion assay.
We also examined the role of ATF3 in macrophages by transendothelial migration assay (see Methods and Figure 7A). WT macrophages enhanced the ability of MVT-1 cancer cells to migrate through the monolayer of HUVECs with higher efficiency than the KO macrophages (Figure 7B). This difference was recapitulated by conditioned media from these macrophages, which indicates that the difference was due to the soluble factors they secrete. Transduction of KO macrophages with ATF3-expressing retrovirus, but not the control virus, partially rescued the phenotype (Figure 7B). Importantly, Mmp9-expressing retrovirus compensated for the deficiency of Atf3, which supports the notion that Mmp9 is a functionally important downstream target of ATF3 in macrophages to promote cancer cell transendothelial migration. Representative images of the transendothelial migration assay are shown in Figure 7C. The ability of ATF3 in macrophages to enhance cancer cell transendothelial migration is consistent with the in vivo data, which showed a higher colonization of cancer cells in WT than KO lungs as early as 8 hours after i.v. injection (Figure 7D). At 8 hours, the difference was presumably partly due to the differences in the ability of cancer cells to extravasate. Representative images are shown in Figure 7E.
Figure 7. ATF3 facilitates the ability of macrophages to enhance breast cancer cell transendothelial migration.

(A) Transendothelial migration assay using Boyden chamber. C.M., conditioned media. (B) MVT-1 cells labeled with tGFP were placed on top of a monolayer of HUVECs, without (–) or with WT or KO bone marrow–derived macrophages in the bottom chamber. Alternatively, conditioned media from macrophages transduced with control, ATF3-expressing, or Mmp9-expressing retrovirus were placed in the bottom chamber. tGFP cells on the underside of the membrane were counted (see Supplemental Methods), and the number in the absence of macrophages was defined as 1. A representative result from 3 experiments is shown. *P < 0.05, Student’s t test. (C) Representative images of conditioned media from virus-transduced macrophages in B. (D) WT or KO FVB/N mice were injected with tGFP-labeled MVT-1 cancer cells by tail vein; lung sections were analyzed for tGFP+ cells at the indicated hours after injection (n = 3 per group). *P < 0.05, Student’s t test. (E) Representative images of samples from D. Scale bars: 100 μm (C); 50 μm (E).
In summary, our in vitro assays indicate that ATF3 in macrophages plays an important role in the ability of macrophage to facilitate cancer cell invasion and transendothelial migration. These results fit well with our data from mouse models, showing: (a) reduced CTCs in KO versus WT hosts (Figure 3, A and D), reflecting the combined effect of invasion and intravasation; and (b) reduced lung colonization in KO versus WT hosts upon i.v. injection (Figure 3, B, C, E, and F; Figure 4, A, B, and H; Figure 7, D and E; and Supplemental Figure 1, D and E), reflecting the combined effect of adherence of cancer cells to the endothelium, extravasation, and survival/proliferation in the lung parenchyma.
A subset of genes regulated by ATF3 in the mouse TAMs is differentially expressed in the human breast cancer stroma versus “distant” stroma and has predictive value for clinical outcome.
To test whether the genes we identified in the mouse TAMs have any relevance to human breast tumors, we compared the 478 genes we identified by cRNA microarray with the breast cancer stroma data from Finak et al. (37), which compared 49 human tumor stroma with 52 “distant” stroma (the so-called “adjacent normal”) after laser-capture microdissection by RNA microarray. Among the 478 genes in our data, 282 were represented on the platform they used (Agilent array). Of these 282 human orthologs, 117 (referred to herein as ATF3-117 genes) had highly variable expression across the human stromal samples (variance cutoff > 0.5). These ATF3-117 genes could in fact distinguish tumor stroma from “distant” stroma (Figure 8A). When the variance cutoff was increased to > 1, we identified 60 genes that can distinguish tumor stroma from “distant” stroma (ATF3-60 genes; Supplemental Figure 7B).
Figure 8. A subset of genes differentially regulated by ATF3 in TAMs can distinguish tumor stroma versus “distant” stroma in human breast samples and can segregate patients with different outcomes.

(A) The ATF3-117 genes were differentially expressed in the stroma of human breast samples, based on the McGill stroma microarray dataset (accession no. GSE4823). P < 4 × 10–27, Fisher exact test; P = 0.009 by 10,000 random permutations. (B) 70 ATF3-117 genes were available in the NKI dataset (55) and 103 in the Stockholm dataset (accession no. GSE1456) that could segregate the patients into high- and low-risk groups, as shown by Kaplan-Meier curve. *P < 0.001, #P < 0.02; log-rank test, 1,000 permutations.
We further analyzed the ATF3-117 genes against the publicly available breast cancer datasets with gene expression and outcome results. 70 of the ATF3-117 genes were available in the Netherlands Cancer Institute (NKI) dataset, and 103 were available in the Stockholm datasets. Importantly, these genes could stratify the patients in each dataset into low- and high-risk groups, significantly better than random. Figure 8B shows the Kaplan-Meier curves for survival. Similar results were obtained when the ATF3-60 genes were analyzed (Supplemental Figure 7C). Taken together, these results indicate that a subset of the genes regulated by ATF3 in mouse TAMs is dysregulated in the tumors of breast cancer patients and has predictive value for clinical outcome. The significance of these results is 2-fold: first, it lends credence to the relevance of our mouse models, and second, it is consistent with our finding that high expression of ATF3 itself in the mononuclear cells predicted worse outcome in a cohort of breast cancer patients (Figure 1D and Table 1).
Discussion
Our data indicated that ATF3 in the host facilitates breast cancer metastasis, at least in part, by its function in macrophages/myeloid cells. Although ATF3 was shown to play a role in macrophages (38–41), the previous studies differ from our report in 2 important aspects. First, they studied the roles of ATF3 in noncancer, acute stress contexts: septic shock and post–septic shock infection. Second, they used the whole-body Atf3 KO mice, without using CKO mice to address the roles of ATF3 in macrophages/myeloid cells. Thus, our present study is the first to use CKO mice and demonstrate a functional role of ATF3 in macrophages/myeloid cells to promote metastasis. Importantly, Atf3 is an adaptive response gene and is induced in macrophages by a variety of stress signals relevant to the tumor microenvironment, such as hypoxia, cytokines (IL-4, TGF-β, IL-6, and TNF-α), and coculture with cancer cells (Supplemental Figure 4 and reviewed in ref. 18). Thus, our present work linked macrophage/myeloid stress response to metastasis.
Epidemiological findings support the concept that chronic stress, such as obesity and psychological distress, is a risk factor for cancer (42, 43). Recently, studies using mouse models provided experimental support for a potential causal relation between chronic stress and increased cancer risk. These include increased melanoma development accompanying high-fat diet (44), increased breast tumor size in transgenic mice with diabetic symptoms (45), and increased mammary carcinoma metastasis in mice with restriction stress (daily restraint of movement for 2 hours; ref. 46). Importantly, in the restriction stress model, the stress treatment increased macrophage infiltration in the tumor, and GW2580 (a CSF1R inhibitor) reduced macrophage infiltration and dampened restriction stress–enhanced metastasis, supporting a role of macrophages in this process (46). Since Atf3 is a stress-inducible gene, it will be interesting to determine whether ATF3 in macrophages plays a role in any stress-enhanced cancer progression.
Although various genes have been shown to be important for macrophages/myeloid cells in the breast cancer context, few have been documented to be necessary in vivo using the CKO approach, including Ets2, Vegf, and Hif1a (47–50). Atf3 differs from them in a key aspect, in that it is an immediate-early gene induced by a wide spectrum of stress signals. Immediate-early genes encode transcription factors and are known to modulate genes encoding transcription factors, which in turn regulate downstream genes, leading to a cascade of changes in transcriptional programs. Thus, ATF3 has far-reaching effects in orchestrating the cellular adaptation to stress signals. Our data suggest that ATF3 in macrophages promotes M2 skew, since Il12 mRNA (M1) was lower in WT than KO cells, but Arg1 mRNA (M2) was higher (Figure 5D). We note that the promoters of both genes contain consensus ATF/CRE sites (38, 51), potential binding sites for ATF3. Since ATF3 can either activate or suppress gene expression depending on its dimerization with other basic region leucine zipper proteins (18), it is possible that ATF3 directly upregulates Arg1, but downregulates Il12. Our microarray data indicate that ATF3 modulates the expression of genes involved in cell-cell communication, a key component for the function of the immune network. Supplemental Figure 9 shows the cytokines involved in communications among various immune cells, many of which were regulated by ATF3 (directly or indirectly) in macrophages. Thus, ATF3 can affect the ability of macrophages to communicate with other immune cells. Our data also indicate that ATF3 affects the ability of macrophages to communicate with cancer epithelial cells in vitro, as evidenced by 2 coculture assays (3D invasiveness and transendothelial migration; Figures 6 and 7). Macrophages are well documented as affecting cancer cell invasion, intravasation, and extravasation (2, 12, 14, 25). Our present study identified Atf3, an adaptive response gene that encodes a transcription factor and is induced by various stress signals, as a regulator of these macrophage bioactivities. Mechanistically, Mmp9 is a functionally important target of ATF3 for macrophages to stimulate cancer cell invasion and transendothelial migration in vitro. However, we do not imply that Mmp9 is the only functionally important target; more analyses are required to address the potential importance of other ATF3 downstream genes. Taken together, our results are consistent with the model that, as an immediate-early gene, Atf3 in macrophages links various stress signals in the cancer environment to alterations in transcriptional programs. This results in changes in macrophage bioactivities to facilitate metastasis (Figure 9).
Figure 9. Model by which ATF3, a hub of the cellular adaptive response network, links various signals in the tumor microenvironment to alterations in macrophage transcriptional programs and bioactivities.

Our data did not show statistically significant differences in macrophage recruitment in the WT and KO primary tumors (Figure 5B). Preliminary analysis of CD45+ hematopoietic cells or CD11b+/Gr1+ myeloid-derived suppressor cells also showed no difference in primary tumors, lung, spleen, or bone marrow (Supplemental Figure 3, D and E). Analyses of VEGFr1+ cells, a cell type important for premetastatic niche formation (5, 52), showed no difference between WT and KO lung or bone marrow (Supplemental Figure 3F). Thus, our studies did not show obvious differences in cell recruitment. However, we do not rule out the possibility that our assays were not sensitive enough to detect subtle differences or that ATF3 in the host may affect the trafficking of some unexamined or unidentified cell types.
Although we showed that the macrophage/myeloid is a key cell type for ATF3 function, we do not exclude the potential roles of ATF3 in other cell types. This is because Atf3 can be induced by stress signals in many cell types (18, 20) and because various host cells other than macrophages/myeloid cells — such as T cells, B cells, fibroblasts, adipocytes, and endothelial cells — have been shown to play important roles in cancer development (1, 10). Further investigation is required to address these issues. We note that it is not clear when macrophage/myeloid starts to express ATF3 during human breast cancer development; further investigation using a large number of samples at different stages of breast cancer development is also required.
Finally, the ATF3-117 and ATF3-60 genes derived from mouse TAMs could stratify the breast cancer patients in the NKI and Stockholm datasets into low- and high-risk groups (Figure 8B and Supplemental Figure 7C). Importantly, Figure 1D and Table 1 indicate that the expression of ATF3 in the mononuclear cells of human breast tumors correlated with worse outcome. Thus, our data from mouse models and human samples corroborate each other, suggesting that ATF3 may be used as a prognostic marker for metastatic disease. We note that ATF3 expression in the cancer epithelial cells did not correlate with clinical outcomes. This may be because the study was underpowered, or because the expression of ATF3 in the breast cancer epithelium is not a predictor of outcomes. However, this does not mean that ATF3 expression in the cancer epithelium is not functionally important. As shown previously, ATF3 in breast cancer cells plays an oncogenic role in both in vitro and in vivo models (21–23). Thus, the expression of ATF3 in mammary epithelium has functional importance, even though it does not correlate with clinical outcome.
In conclusion, our studies demonstrated that ATF3 — a hub of the cellular adaptive response network — is induced in both the cancer epithelia and the mononuclear cells in the stroma. Our data support a model whereby ATF3 induction in the mononuclear cells (presumably reflecting a reactive stroma) alters their gene expression and bioactivities, contributing to host-enhanced metastasis. Importantly, this expression of ATF3 predicted poor clinical outcome in a cohort of patients, suggesting that dampening ATF3 expression in the host may be a potential therapeutic approach.
Methods
Further information can be found in Supplemental Methods.
Animal studies and human samples.
Age-matched C57BL/6 (Atf3+/+ and Atf3–/–) or FVB/N (Atf3+/+, Atf3–/–, Atf3f/f/LysM-Cre, and Atf3+/+/LysM-Cre) female mice (6–8 weeks of age) were used. Cancer cells were injected into mammary fat pad or tail vein and analyzed (see Supplemental Methods). Primary tumors and lung nodules were measured by caliper; lung nodule numbers were counted, and nodule areas were measured using ImageJ after sectioning (Supplemental Methods). Female MMTV-PyMT transgenic mice in the Atf3+/+ or Atf3–/– background (C57BL/6 strain) were analyzed for primary tumors every third day starting at 4 months of age and sacrificed for analysis of lung metastasis at 6 months of age.
3D coculture and transendothelial migration assays.
Breast epithelial cells were grown on Matrigel-coated plates for 12–14 days to form 3D structures as previously described (refs. 34, 35, and Supplemental Methods); bone marrow–derived macrophages were overlaid on top, and the invasive structures were assessed after 24 hours of coculture. At least 150 3D structures were scored in a blinded fashion for the percentage of 3D with invasion. The percentage in the absence of macrophages (basal invasiveness) varied from experiment to experiment, and was arbitrarily defined as 1. Transendothelial migration assay was carried out using Transwell inserts covered with a monolayer of HUVECs, as previously described (ref. 53 and Supplemental Methods). Turbo GFP–labeled (tGFP-labeled) MVT (2 × 10⁵) cells were added to the upper chamber on top of HUVECs, with the indicated macrophages or macrophage conditioned medium in the bottom chamber. Transendothelial migration was assessed 16–20 hours later by fluorescence microscopy.
Bone marrow cells and transplantation.
Bone marrow cells were harvested from the hind legs and used in either transplantation or in vitro differentiation (see Supplemental Methods). Briefly, for transplantation, recipient WT mice were myeloablated by irradiation and injected within 5 hours with Atf3+/+ or Atf3–/– bone marrow cells via tail vein. 30 days later, mice were either assessed for engraftment efficiency by analyzing their blood cells for Atf3 mRNA or injected with cancer cells via tail vein. Mice were then analyzed for tumor nodules in their lungs 42 days after cancer cell injection.
Microarray analyses of the mouse data against the human data.
TAMs from primary tumors were stained with CD45-APC and F4/80-FITC antibodies and sorted directly into TRIzol-LS (Invitrogen), followed by RNA isolation and microarray analyses (G4122F; Agilent Oligo Array). 4 mice from each group (WT or KO) were used, with RNA from each mouse analyzed separately by 1-color hybridization on the microarray platform. Only genes demonstrating ≥ 1.8-fold difference between the WT and KO TAMs (from the quadruple sets) were included for further analyses (accession no. GSE36904).
Human tumor microarray analyses.
A tumor array containing 249 useable samples from 292 patients with outcome data and other clinical parameters was analyzed for ATF3 by immunohistochemistry and scored by a board-certified pathologist for signals in the cancer epithelia and mononuclear cells (based on morphology) using the Allred system in a blinded fashion. Scores ≥ 4 were defined as high. Statistical evaluation was performed using Statview 5.0 Software (Abacus Systems). See Supplemental Methods for details.
Statistics.
Data were analyzed using log-rank test, Mann-Whitney test, χ2 test, Fisher exact test, or 2-tailed Student’s t test, as indicated. All data represent mean ± SEM. A P value less than 0.05 was considered statistically significant. For all box and whisker plots, box indicates lower and upper quartiles, and dashed line indicates median.
Study approval.
All mouse studies were approval by the Ohio State University Institutional Animal Care and Use Committee. The use of all human samples except the tumor microarray was approved by the Ohio State University Institutional Review Board. The use of tumor microarray was approved by the Institutional Review Board at St. Vincent’s Hospital (Sydney, Australia). All patients provided informed consent prior to the studies.
Supplementary Material
Acknowledgments
This work was supported in part by NIH grants CA118306, ES021018, and P30 NS045758 and a Pelotonia Idea Grant (to T. Hai); NIH grant T32 CA090223 (to S.J. McConoughey); National Health and Medical Research Council grant 535903, Australian Cancer Research Foundation, RT Hall Trust, and Petre Foundation (to R.L. Sutherland); Cancer Institute New South Wales Translational Program 10/TPG/1-04 (to R.L. Sutherland, E.K.A. Millar, and S.A. O’Toole); Sydney Catalyst Translational Research Centre 11/TRC/1-02 (to R.L. Sutherland); Sydney Catalyst Fellowship 10/CRF/1-07 (to S.A. O’Toole); Australia and New Zealand Breast Cancer Trials Group (to R.L. Sutherland and S.A. O’Toole); and Sydney Breast Cancer Foundation (to S.A. O’Toole). We record with sorrow the recent passing of R.L. Sutherland, the Inaugural Director of The Kinghorn Cancer Center and Director of the Cancer Research Program, Garvan Institute of Medical Research.
Footnotes
Conflict of interest: The authors have declared that no conflict of interest exists.
Citation for this article:J Clin Invest. 2013;123(7):2893–2906. doi:10.1172/JCI64410.
References
- 1.Hanahan D, Coussens LM. Accessories to the crime: functions of cells recruited to the tumor microenvironment. Cancer Cell. 2012;21(3):309–322. doi: 10.1016/j.ccr.2012.02.022. [DOI] [PubMed] [Google Scholar]
- 2.Joyce JA, Pollard JW. Microenvironmental regulation of metastasis. Nat Rev Cancer. 2009;9(4):239–252. doi: 10.1038/nrc2618. [DOI] [PMC free article] [PubMed] [Google Scholar]
- 3.Bissell MJ, Radisky D. Putting tumours in context. Nat Rev Cancer. 2001;1(1):46–54. doi: 10.1038/35094059. [DOI] [PMC free article] [PubMed] [Google Scholar]
- 4.Cichon MA, Degnim AC, Visscher DW, Radisky DC. Microenvironmental influences that drive progression from benign breast disease to invasive breast cancer. J Mammary Gland Biol Neoplasia. 2010;15(4):389–397. doi: 10.1007/s10911-010-9195-8. [DOI] [PMC free article] [PubMed] [Google Scholar]
- 5.Psaila B, Lyden D. The metastatic niche: adapting the foreign soil. Nat Rev Cancer. 2009;9(4):285–293. doi: 10.1038/nrc2621. [DOI] [PMC free article] [PubMed] [Google Scholar]
- 6.DeNardo DG, Johansson M, Coussens LM. Immune cells as mediators of solid tumor metastasis. Cancer Metastasis Rev. 2008;27(1):11–18. doi: 10.1007/s10555-007-9100-0. [DOI] [PubMed] [Google Scholar]
- 7.Direkze NC, Alison MR. Bone marrow and tumour stroma: an intimate relationship. Hematol Oncol. 2006;24(4):189–195. doi: 10.1002/hon.788. [DOI] [PubMed] [Google Scholar]
- 8.Johansson M, Denardo DG, Coussens LM. Polarized immune responses differentially regulate cancer development. Immunol Rev. 2008;222:145–154. doi: 10.1111/j.1600-065X.2008.00600.x. [DOI] [PMC free article] [PubMed] [Google Scholar]
- 9.de Visser KE, Eichten A, Coussens LM. Paradoxical roles of the immune system during cancer development. Nat Rev Cancer. 2006;6(1):24–37. doi: 10.1038/nrc1782. [DOI] [PubMed] [Google Scholar]
- 10.Grivennikov SI, Greten FR, Karin M. Immunity, inflammation, and cancer. Cell. 2010;140(6):883–899. doi: 10.1016/j.cell.2010.01.025. [DOI] [PMC free article] [PubMed] [Google Scholar]
- 11.Mantovani A, Sica A. Macrophages, innate immunity and cancer: balance, tolerance, and diversity. Curr Opin Immunol. 2010;22(2):231–237. doi: 10.1016/j.coi.2010.01.009. [DOI] [PubMed] [Google Scholar]
- 12.Qian BZ, Pollard JW. Macrophage diversity enhances tumor progression and metastasis. Cell. 2010;141(1):39–51. doi: 10.1016/j.cell.2010.03.014. [DOI] [PMC free article] [PubMed] [Google Scholar]
- 13.Mantovani A, Sozzani S, Locati M, Allavena P, Sica A. Macrophage polarization: tumor-associated macrophages as a paradigm for polarized M2 mononuclear phagocytes. Trends Immunol. 2002;23(11):549–555. doi: 10.1016/S1471-4906(02)02302-5. [DOI] [PubMed] [Google Scholar]
- 14.Kessenbrock K, Plaks V, Werb Z. Matrix metalloproteinases: regulators of the tumor microenvironment. Cell. 2010;141(1):52–67. doi: 10.1016/j.cell.2010.03.015. [DOI] [PMC free article] [PubMed] [Google Scholar]
- 15.Chen BPC, Liang G, Whelan J, Hai T. ATF3 and ATF3DeltaZip: Transcriptional repression versus activation by alternatively spliced isoforms. J Biol Chem. 1994;269(22):15819–15826. [PubMed] [Google Scholar]
- 16.Hai T, Hartman MG. The molecular biology and nomenclature of the ATF/CREB family of transcription factors: ATF proteins and homeostasis. Gene. 2001;273(1):1–11. doi: 10.1016/S0378-1119(01)00551-0. [DOI] [PubMed] [Google Scholar]
- 17.Thompson MR, Xu D, Williams BR. ATF3 transcription factor and its emerging roles in immunity and cancer. J Mol Med. 2009;87(11):1053–1060. doi: 10.1007/s00109-009-0520-x. [DOI] [PMC free article] [PubMed] [Google Scholar]
- 18.Hai T, Wolfgang CD, Marsee DK, Allen AE, Sivaprasad U. ATF3 and stress responses. Gene Expr. 1999;7(4–6):321–335. [PMC free article] [PubMed] [Google Scholar]
- 19.Hai T, Wolford CC, Chang YS. ATF3, a hub of the cellular adaptive-response network, in the pathogenesis of diseases: Is modulation of inflammation a unifying component? Gene Expr. 2010;15(1):1–11. doi: 10.3727/105221610X12819686555015. [DOI] [PMC free article] [PubMed] [Google Scholar]
- 20.Hai T. Gene Expression And Regulation. 2006. The ATF transcription factors in cellular adaptive responses. In: Ma J, ed. pp. 322–333. Beijing, China and New York, USA: Higher Education Press and Springer; [Google Scholar]
- 21.Yin X, DeWille J, Hai T. A potential dichotomous role of ATF3, an adaptive-response gene, in cancer development. Oncogene. 2008;27(15):2118–2127. doi: 10.1038/sj.onc.1210861. [DOI] [PubMed] [Google Scholar]
- 22.Yin X, Wolford CC, McConoughey SJ, Ramsey SA, Aderem A, Hai T. ATF3, an adaptive-response gene, enhances TGFbeta signaling and cancer initiating cell features in breast cancer cells. J Cell Sci. 2010;123(pt 20):3558–3565. doi: 10.1242/jcs.064915. [DOI] [PMC free article] [PubMed] [Google Scholar]
- 23.Wang A, et al. The transcription factor ATF3 acts as an oncogene in mouse mammary tumorigenesis. BMC Cancer. 2008;8:268. doi: 10.1186/1471-2407-8-268. [DOI] [PMC free article] [PubMed] [Google Scholar]
- 24.Mantovani A, Schioppa T, Porta C, Allavena P, Sica A. Role of tumor-associated macrophages in tumor progression and invasion. Cancer Metastasis Rev. 2006;25(3):315–322. doi: 10.1007/s10555-006-9001-7. [DOI] [PubMed] [Google Scholar]
- 25.Condeelis J, Pollard JW. Macrophages: obligate partners for tumor cell migration, invasion, and metastasis. Cell. 2006;124(2):263–266. doi: 10.1016/j.cell.2006.01.007. [DOI] [PubMed] [Google Scholar]
- 26.Ruffell B, Au A, Rugo HS, Esserman LJ, Hwang ES, Coussens LM. Leukocyte composition of human breast cancer. Proc Natl Acad Sci U S A. 2012;109(8):2796–2801. doi: 10.1073/pnas.1104303108. [DOI] [PMC free article] [PubMed] [Google Scholar]
- 27.Hartman MG, et al. Role for activating transcription factor 3 in stress-induced beta-cell apoptosis. Mol Cell Biol. 2004;24(13):5721–5732. doi: 10.1128/MCB.24.13.5721-5732.2004. [DOI] [PMC free article] [PubMed] [Google Scholar]
- 28.Davie SA, et al. Effects of FVB/NJ and C57BL/6J strain backgrounds on mammary tumor phenotype in inducible nitric oxide synthase deficient mice. Transgenic Res. 2007;16(2):193–201. doi: 10.1007/s11248-006-9056-9. [DOI] [PMC free article] [PubMed] [Google Scholar]
- 29.Borowsky AD, et al. Syngeneic mouse mammary carcinoma cell lines: two closely related cell lines with divergent metastatic behavior. Clin Exp Metastasis. 2005;22(1):47–59. doi: 10.1007/s10585-005-2908-5. [DOI] [PubMed] [Google Scholar]
- 30.Pei XF, et al. Explant-cell culture of primary mammary tumors from MMTV-c-Myc transgenic mice. In Vitro Cell Dev Biol Anim. 2004;40(1–2):14–21. doi: 10.1290/1543-706X(2004)40<14:ECOPMT>2.0.CO;2. [DOI] [PubMed] [Google Scholar]
- 31.Clausen BE, Burkhardt C, Reith W, Renkawitz R, Forster I. Conditional gene targeting in macrophages and granulocytes using LysM-cre mice. Transgenic Res. 1999;8(4):265–277. doi: 10.1023/A:1008942828960. [DOI] [PubMed] [Google Scholar]
- 32.Lucas T, Abraham D, Aharinejad S. Modulation of tumor associated macrophages in solid tumors. Front Biosci. 2008;13:5580–5588. doi: 10.2741/3101. [DOI] [PubMed] [Google Scholar]
- 33.Siveen KS, Kuttan G. Role of macrophages in tumour progression. Immunol Lett. 2009;123(2):97–102. doi: 10.1016/j.imlet.2009.02.011. [DOI] [PubMed] [Google Scholar]
- 34.Debnath J, Muthuswamy SK, Brugge JS. Morphogenesis and oncogenesis of MCF-10A mammary epithelial acini grown in three-dimensional basement membrane cultures. Methods. 2003;30(3):256–268. doi: 10.1016/S1046-2023(03)00032-X. [DOI] [PubMed] [Google Scholar]
- 35.DeNardo DG, et al. CD4(+) T cells regulate pulmonary metastasis of mammary carcinomas by enhancing protumor properties of macrophages. Cancer Cell. 2009;16(2):91–102. doi: 10.1016/j.ccr.2009.06.018. [DOI] [PMC free article] [PubMed] [Google Scholar]
- 36.O’Brien LE, Zegers MM, Mostov KE. Opinion: Building epithelial architecture: insights from three-dimensional culture models. Nat Rev Mol Cell Biol. 2002;3(7):531–537. doi: 10.1038/nrm859. [DOI] [PubMed] [Google Scholar]
- 37.Finak G, et al. Stromal gene expression predicts clinical outcome in breast cancer. Nat Med. 2008;14(5):518–527. doi: 10.1038/nm1764. [DOI] [PubMed] [Google Scholar]
- 38.Gilchrist M, et al. Systems biology approaches identify ATF3 as a negative regulator of Toll-like receptor 4. Nature. 2006;441(7090):173–178. doi: 10.1038/nature04768. [DOI] [PubMed] [Google Scholar]
- 39.Hoetzenecker W, et al. ROS-induced ATF3 causes susceptibility to secondary infections during sepsis-associated immunosuppression. Nat Med. 2012;18(1):128–134. doi: 10.1038/nm.2557. [DOI] [PMC free article] [PubMed] [Google Scholar]
- 40.Whitmore MM, Iparraguirre A, Kubelka L, Weninger W, Hai T, Williams BR. Negative regulation of TLR-signaling pathways by activating transcription factor-3. J Immunol. 2007;179(6):3622–3630. doi: 10.4049/jimmunol.179.6.3622. [DOI] [PubMed] [Google Scholar]
- 41.Khuu CH, Barrozo RM, Hai T, Weinstein SL. Activating transcription factor 3 (ATF3) represses the expression of CCL4 in murine macrophages. Mol Immunol. 2007;44(7):1598–1605. doi: 10.1016/j.molimm.2006.08.006. [DOI] [PubMed] [Google Scholar]
- 42.Calle EE, Kaaks R. Overweight, obesity and cancer: epidemiological evidence and proposed mechanisms. Nat Rev Cancer. 2004;4(8):579–591. doi: 10.1038/nrc1408. [DOI] [PubMed] [Google Scholar]
- 43.Chida Y, Hamer M, Wardle J, Steptoe A. Do stress-related psychosocial factors contribute to cancer incidence and survival? Nat Clin Pract Oncol. 2008;5(8):466–475. doi: 10.1038/ncponc1134. [DOI] [PubMed] [Google Scholar]
- 44.Pandey V, Vijayakumar MV, Ajay AK, Malvi P, Bhat MK. Diet-induced obesity increases melanoma progression: involvement of Cav-1 and FASN. Int J Cancer. 2012;130(3):497–508. doi: 10.1002/ijc.26048. [DOI] [PubMed] [Google Scholar]
- 45.Novosyadlyy R, et al. Insulin-mediated acceleration of breast cancer development and progression in a nonobese model of type 2 diabetes. Cancer Res. 2010;70(2):741–751. doi: 10.1158/0008-5472.CAN-09-2141. [DOI] [PMC free article] [PubMed] [Google Scholar]
- 46.Sloan EK, et al. The sympathetic nervous system induces a metastatic switch in primary breast cancer. Cancer Res. 2010;70(18):7042–7052. doi: 10.1158/0008-5472.CAN-10-0522. [DOI] [PMC free article] [PubMed] [Google Scholar]
- 47.Zabuawala T, et al. An Ets2-driven transcriptional program in tumor-associated macrophages promotes tumor metastasis. Cancer Res. 2010;70(4):1323–1333. doi: 10.1158/0008-5472.CAN-09-1474. [DOI] [PMC free article] [PubMed] [Google Scholar]
- 48.Stockmann C, et al. Deletion of vascular endothelial growth factor in myeloid cells accelerates tumorigenesis. Nature. 2008;456(7223):814–818. doi: 10.1038/nature07445. [DOI] [PMC free article] [PubMed] [Google Scholar]
- 49.Qian BZ, et al. CCL2 recruits inflammatory monocytes to facilitate breast-tumour metastasis. Nature. 2011;475(7355):222–225. doi: 10.1038/nature10138. [DOI] [PMC free article] [PubMed] [Google Scholar]
- 50.Doedens AL, et al. Macrophage expression of hypoxia-inducible factor-1 alpha suppresses T-cell function and promotes tumor progression. Cancer Res. 2010;70(19):7465–7475. doi: 10.1158/0008-5472.CAN-10-1439. [DOI] [PMC free article] [PubMed] [Google Scholar]
- 51.Sharda DR, et al. Regulation of macrophage arginase expression and tumor growth by the Ron receptor tyrosine kinase. J Immunol. 2011;187(5):2181–2192. doi: 10.4049/jimmunol.1003460. [DOI] [PMC free article] [PubMed] [Google Scholar]
- 52.Kaplan RN, et al. VEGFR1-positive haematopoietic bone marrow progenitors initiate the pre-metastatic niche. Nature. 2005;438(7069):820–827. doi: 10.1038/nature04186. [DOI] [PMC free article] [PubMed] [Google Scholar]
- 53.Ma C, Wang XF. In vitro assays for the extracellular matrix protein-regulated extravasation process. CSH Protoc. 2008;2008:pdb.prot5034. doi: 10.1101/pdb.prot5034. [DOI] [PubMed] [Google Scholar]
- 54.Sorlie T, et al. Gene expression patterns of breast carcinomas distinguish tumor subclasses with clinical implications. Proc Natl Acad Sci U S A. 2001;98(19):10869–10874. doi: 10.1073/pnas.191367098. [DOI] [PMC free article] [PubMed] [Google Scholar]
- 55.van ‘t Veer LJ, et al. Gene expression profiling predicts clinical outcome of breast cancer. Nature. 2002;415(6871):530–536. doi: 10.1038/415530a. [DOI] [PubMed] [Google Scholar]
- 56.Minn AJ, et al. Genes that mediate breast cancer metastasis to lung. Nature. 2005;436(7050):518–524. doi: 10.1038/nature03799. [DOI] [PMC free article] [PubMed] [Google Scholar]
Associated Data
This section collects any data citations, data availability statements, or supplementary materials included in this article.